


Postprandial hyperglycaemia and hyperinsulinaemia play an important role in the development of chronic diseases such as type 2 diabetes and CVD(Reference Ludwig1). The concentrations of blood glucose and insulin are primarily determined by dietary carbohydrates (CHO). The term glycaemic index (GI) was introduced to classify the different sources of CHO and CHO-rich foods according to their postprandial glycaemic responses(Reference Jenkins, Wolever and Taylor2). Correspondingly, the insulinaemic index (II) indicates the insulinaemic response to the different CHO sources.
The glycaemic responses to foods, and the factors modifying them, have been studied widely in recent years. GI values for mixed meals, as well as for the whole diet, have been assessed. The main factors modifying the glycaemic responses to mixed meals are the amount of fat and protein. This is because fat reduces the glycaemic responses by delaying gastric emptying and by enhancing the secretion of incretins(Reference Collier and O'Dea3–Reference Deane, Nguyen and Stevens6), and protein by increasing insulin secretion(Reference Nuttall, Mooradian and Gannon7) and also by the slowing of gastric emptying(Reference Karamanlis, Chaikomin and Doran8). Nevertheless, there are differing opinions on the effects of fat and protein on the glycaemic responses to mixed meals. The study of Flint et al. (Reference Flint, Moller and Raben9) has shown that the GI of mixed meals, which was calculated by using the values of published GI tables, did not predict the measured GI and that GI is more strongly correlated either with the fat or with the protein content than with the CHO content alone. On the other hand, Wolever et al. (Reference Wolever, Yang and Zeng10) concluded that CHO content and GI together explained about 90 % of the variation of the glycaemic responses to mixed meals, and thus fat and protein have only negligible effects on the glycaemic responses. In addition, this same study has observed a strong correlation between the glycaemic and insulinaemic responses to mixed meals(Reference Wolever, Yang and Zeng10). However, a recent study has illustrated that mixed meals with similar CHO content induce a wide range of insulin responses. Furthermore, it has also been observed that the fat content of a mixed meal had a significant inverse relationship with the insulinaemic responses(Reference Bao, de Jong and Atkinson11).
Studies have reported highly variable GI values for mashed potatoes, ranging from 71 to 106(Reference Atkinson, Foster-Powell and Brand-Miller12, Reference Tahvonen, Hietanen and Sihvonen13). Added to that, it has been shown that potatoes are one of the most insulinogenic foods(Reference Holt, Miller and Petocz14). Glycaemic and insulinaemic responses to mashed potato are, however, modified when ingested as part of a mixed meal: the co-ingestion of fat and protein reduced the glycaemic responses and the co-ingestion of protein increased the insulinaemic responses in subjects with type 2 diabetes(Reference Gulliford, Bicknell and Scarpello15). Moreover, a recent study has reported that the addition of various toppings to baked potato caused different decreases in the GI value(Reference Henry, Lightowler and Kendall16). There are, however, also studies showing no or increasing effect of fat on GI(Reference Gannon, Ercan and Westphal17, Reference Leeman, Östman and Björck18). Therefore, it is important to consider the influence of macronutrients on the postprandial responses to composite meals.
We examined the glycaemic and insulinaemic responses of a mashed potato-based meal when a high-fat food (rapeseed oil) or a high-protein food (chicken breast) or fat, protein and salad together were added to the meal. Furthermore, we studied how the predicted and measured GI values of the mixed meal differed from each other.
Materials and methods
Subjects
A total of twelve healthy subjects, three men and nine women, aged 36·2 (sd 14·1) years with a BMI of 21·3 (sd 1·7) kg/m2, with a normal glucose tolerance based upon a 2 h 75 g oral glucose tolerance test, were recruited to voluntarily participate in the study. Of the twelve subjects, one did not complete all the test meals and was thus excluded from the analyses. The exclusion criteria were an active gastrointestinal or metabolic disease or a first-degree family history of diabetes, as well as chronic medication (oral contraceptives were allowed), and for women, in addition to pregnancy, breast-feeding, a history of gestational diabetes and polycystic ovary syndrome. The present study was conducted according to the guidelines laid down in Declaration of Helsinki, and all procedures involving human subjects were approved by the Ethics Committee of the Hospital District of Helsinki and Uusimaa. Written informed consent was obtained from all subjects.
Study meals
The subjects were given six different mashed potato-based meals in a randomised order, 1-week apart. A glucose solution was used as the reference food and was consumed twice. Each of the test meals and the reference food were given as portions, providing 50 g of the available CHO, except three of the meals that included salad as portions, providing about 54 g of the available CHO. The total liquid volume of the meals was standardised to 550 ml by adjusting the water content. The chemical composition of the study meals was analysed by VTT (Valtion Teknillinen Tutkimuskeskus (Technical Research Centre of Biotechnology), Espoo, Finland). Protein content was estimated (N × 6·25) from the quantitative analysis of N by the Kjeldahl method(Reference Eagan, Kirk and Sawyer19). Fats were determined gravimetrically by extraction with diethyl ether and petroleum ether after hydrolysis with acid(20). Total, soluble and insoluble fibres were determined using the Asp method(Reference Asp, Johansson and Hallmer21). Free sugars (glucose, fructose, maltose, maltotriose and sucrose) were determined by the Dionex ion chromatograph system. Furthermore, the enzymatically available starch contents of the test meals and the evening meals were analysed by the method proposed by McCleary et al. (Reference McCleary, Gibson and Mugford22), using an assay kit of Megazyme (Wicklow, Republic of Ireland). The available CHO was calculated as the sum of the free sugars and the enzymatically available starch. The energy content of the meals varied between 1063 and 3138 kJ. The nutrient composition of the test meals is shown in Table 1.
Table 1 Nutrient content of the test meals
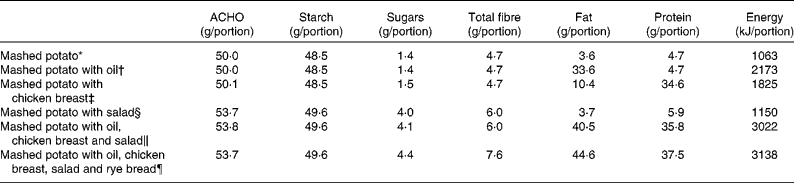
ACHO, available carbohydrate.
* All the test meals contained mashed potato (Van Gogh, prepared with water and margarine). The portion size of the mashed potato was 362 g in all meals, except in the meal that contained rye bread. Served with 170 ml of water and 40 g of cucumber.
† Rapeseed oil (30 g) blended with mashed potato. Served with 170 ml of water and 40 g of cucumber.
‡ Chicken breast, 108 g (HK Ruokatalo Limited, Turku, Finland). Served with 100 ml of water and 40 g of cucumber.
§ The salad contained cucumber, tomato and lettuce. The portion size of the salad was 120 g. Served with 50 ml of water.
∥ Rapeseed oil 30 g+chicken breast 108 g+salad 120 g. Served with 50 ml of water.
¶ The portion size of mashed potato was 272 g+rapeseed oil 30 g+chicken breast 108 g+salad 120 g+rye bread (whole-grain rye flour 36 %, Vaasan Ruispalat; Vaasan & Vaasan Limited, Helsinki, Finland) 30 g, margarine, 80 % fat (Valio Limited, Helsinki, Finland), 6 g. Served with 90 ml of water.
Study protocol
Baseline data on diet, health and lifestyle were assessed by administering a questionnaire. The food composition database and the related software at the National Institute for Health and Welfare were used to calculate the energy and nutrient intakes from a validated FFQ(Reference Paalanen, Männistö and Virtanen23). These intake data together with questionnaire data on physical activity at work and during leisure time were used to compose an individual's standardised meal for the evening preceding the study day. The energy content of the evening meal amounted to 15 % of the daily energy needs of each individual, and the proportion of energy from the evening meal that came from CHO was 55 %. The subjects were requested to follow their usual diet throughout the study period. They were also advised to consume at least 150 g of CHO daily during the 3 d before the test mornings. The subjects were asked not to drink alcohol and to avoid strenuous exercise during the previous day.
The subjects were requested to fast 10–12 h after their standardised evening meal. To avoid exercise on the mornings when the study was conducted, they were advised to arrive by car or by public transportation. In the clinic, each subject's weight was recorded, and a baseline capillary blood sample was taken from a fingertip. Thereafter, the subject consumed the study meal within 10 min. After the subject started to eat the meal, capillary blood samples were collected at 15, 30, 45, 60, 90 and 120 min.
Capillary blood glucose was directly determined by using the HemoCue® Glucose 201 meter (HemoCue Limited, Espoo, Finland). The results were automatically transformed to express the plasma glucose values. The capillary blood samples (500 μl) for insulin determination were collected in non-heparin-treated gel tubes and were allowed to clot at room temperature. After clotting, the samples were centrifuged (4000 g, 15 min) within 20 min, and then they were separated into serum and kept at − 70°C until being analysed. Serum insulin from the capillary samples was determined by an AxSYM system, which is based on the Microparticle Enzyme Immunoassay technology (Abbot Laboratories, Abbot Park, IL, USA). During the course of the study, the inter-assay CV of insulin were 4·7 % (low-level control, 30 mU/l (215·25 pmol/l) n 63) and 4·8 % (high-level control, 134 mU/l (961·45 pmol/l) n 56). The sensitivity of the insulin assay was 1·0 mU/l (7·175 pmol/l).
Calculations and statistical analysis
The incremental areas under the glucose and insulin response curves (IAUC), ignoring the area beneath the baseline, were calculated using the trapezoid method(24). The GI was defined as the percentage of the plasma glucose IAUC of the study meal from that of the reference glucose solution. The same method was used to calculate the II.
The predicted GI (GIpred) of the test meals were calculated by using the recommended method of weighting the GI of each component in the study meal.
where GIA is the GI of the component A, g A is the amount of available CHO in the component A (g) and g is the total amount of available CHO measured in g in the study meal. For rye bread, we used the measured GI value of our own laboratory, GI = 77(Reference Hätönen, Similä and Virtamo25). However, there were no GI values for salad vegetables(Reference Atkinson, Foster-Powell and Brand-Miller12). As proxy, we used the unpublished value for raw carrots (GI = 39), which was assessed in our laboratory(Reference Similä, Valsta and Virtanen26).
Excluded from the analyses were the 2 h insulin curves that included one or more strongly or three or more mildly haemolysed serum samples. The data were analysed with SAS software (version 8.2; SAS Institute, Cary, NC, USA). All results are expressed as means with their standard errors, and the statistical significance of difference was assessed by applying the non-parametric Wilcoxon test with Bonferroni's corrections. The P values of < 0·05 were considered to be statistically significant.
Results
Of the study meals, the highest increase in glucose at 30 min was produced by the consumption of mashed potato alone and with salad. The glucose concentrations at 120 min after these meals fell below the baseline levels (Fig. 1). The incremental peaks and areas under the curves were the highest, resulting in a GI value of 108 for both (Table 2). Mashed potato produced high insulinaemic responses, resulting in an insulin index of 118, whereas the insulin index for mashed potato with salad was slightly lower, 105 (Table 3).
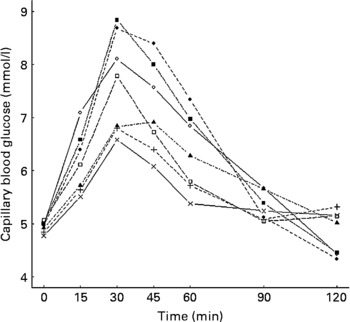
Fig. 1 Mean changes in plasma glucose in healthy subjects (n 11) after the consumption of the study meals. ◇, Glucose; ◆, mashed potato; ▲, mashed potato with oil; □, mashed potato with chicken breast; ■, mashed potato with salad; ×, mashed potato with oil, chicken breast and salad; +, mashed potato with oil, chicken breast, salad and rye bread.
Table 2 Fasting blood glucose values, incremental peaks and incremental areas under the curves (IAUC) of the capillary blood glucose and glycaemic index (GI) values in healthy subjects after the study meals
(Mean values with their standard errors, n 11)
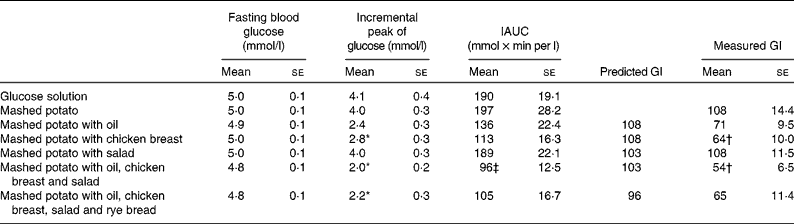
* Mean values were significantly different from those of the incremental peak of glucose of mashed potato: P < 0·05.
† Mean values were significantly different from those of the predicted GI values: P < 0·05.
‡ Mean value was significantly different from that of the IAUC of mashed potato: P < 0·05.
Table 3 Fasting blood insulin values, incremental peaks of insulin and insulinaemic indices (II) in healthy subjects after the study meals
(Mean values with their standard errors and number of individuals)
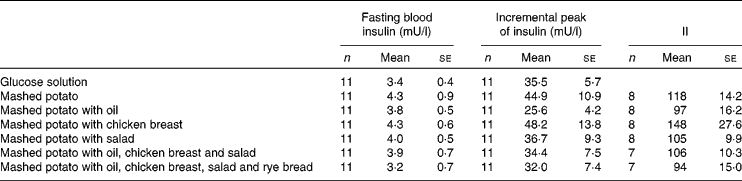
Ingestion of mashed potato with rapeseed oil slowed down the initial glucose increase, the value being 1·6 mmol/l lower at 30 min than that for mashed potato alone (P = 0·08; Fig. 1 and Table 2). Furthermore, the addition of oil reduced the IAUC, resulting in a GI value of 71. The II for mashed potato with oil was 97 (Table 3).
The addition of a protein source, i.e. chicken breast, to a mashed potato meal produced a 1·2 mmol/l smaller increase in glucose at 30 min than mashed potato alone (P = 0·04). The protein source provided a 42 % reduction in the IAUC (P = 0·08; Table 2), resulting in a GI value of 64 (P = 0·05), whereas it increased the insulin response, resulting in the highest II value of 148 (Table 3).
The co-ingestion of oil, chicken breast and salad with mashed potato significantly diminished the glycaemic response, and the result was a low GI value of 54 (P = 0·03; Table 2). When part of the available CHO of mashed potato was substituted with that of rye bread, the IAUC was moderately increased, resulting in the GI value of 65 (P = 0·21). When oil, chicken breast and salad were simultaneously eaten with mashed potato, the II was 106. In addition, the meal containing rye bread produced the lowest II value of 94 (Table 3).
The GI values of the study meals ranged from 54 to 108. However, the predicted GI values varied only from 96 to 108 (Table 2). The consumption of chicken breast with mashed potato resulted in a clearly lower GI value, which was 40 % lower than the predicted GI value, 108 v. 64 (P = 0·048). Moreover, oil in the mixed meal diminished the GI values by 34 %, 108 v. 71 (P = 0·06).
Discussion
The present study shows that by adding a fat component or a protein component either alone or together to a mashed potato-based meal results in a decrease in glycaemic responses. This highlights the problems encountered when predicting the GI values of mixed meals. The protein component of the mixed meal evoked the largest insulinaemic responses and markedly increased the II of the mixed meal containing protein. However, introducing fat into the meal decreased the effect of protein on the insulinaemic responses.
In recently published international GI tables(Reference Atkinson, Foster-Powell and Brand-Miller12), high GI values have been reported for mashed potatoes, varying between 71 and 102. In addition, one previous study has measured an even higher GI value, i.e. 106, for mashed potatoes(Reference Tahvonen, Hietanen and Sihvonen13). Some studies have established that fat ingested with potato lowers glycaemic responses(Reference Collier and O'Dea3, Reference Ercan, Gannon and Nuttall27, Reference Gannon, Nuttall and Westphal28). On the other hand, no effect of fat was observed on the glycaemic responses in subjects with type 2 diabetes(Reference Gannon, Ercan and Westphal17). Furthermore, one study observed that when healthy subjects co-ingested 15 g of sunflower oil with boiled potatoes, an elevated GI was obtained(Reference Leeman, Östman and Björck18). In the present study, we found that the addition of 30 g of rapeseed oil into mashed potatoes markedly reduced the peak rise of blood glucose and resulted in a 37 unit smaller GI value than for the consumption of mashed potato alone. This finding is consistent with previous studies(Reference Henry, Lightowler and Kendall16, Reference MacIntosh, Holt and Brand-Miller29). Moreover, according to MacIntosh et al. (Reference MacIntosh, Holt and Brand-Miller29), the different degrees of saturation of added fat did not affect the glycaemic responses. For example, dietary fat and protein were associated inversely with GI(Reference Jenkins, Wolever and Taylor2); protein had a two- to threefold greater reducing gram-for-gram effect on the glycaemic responses than fat(Reference Moghaddam, Vogt and Wolever30). In the present study, the addition of 30 g protein reduced the glycaemic response slightly more than the addition of 30 g fat. Furthermore, the present results demonstrate that the co-ingestion of fat and protein with mashed potato markedly decreased the glycaemic responses and the GI values, which is consistent with the results of a previous study(Reference Gulliford, Bicknell and Scarpello15).
In the present study, the CHO content of all meals was kept constant at 50 g, except for the meals with salad. Mashed potato with salad, mashed potato with oil, chicken breast and salad, and mashed potato with oil, chicken breast, salad and rye contained about 4 g more of the available CHO than the other meals. However, 4 g more of the available CHO did not affect the glycaemic responses. Hence, the differences in the GI values of the meals were due to the fat or protein content of these meals. This observation is supported by previous findings(Reference Flint, Moller and Raben9, Reference Henry, Lightowler and Kendall16).
Previous studies have provided divergent results about the use of the GI of the different CHO sources to determine the glycaemic responses of mixed meals(Reference Flint, Moller and Raben9, Reference Wolever, Yang and Zeng10). For instance, the study by Flint et al. (Reference Flint, Moller and Raben9) concluded that it was not reliable to predict the GI value of mixed meals by using literature-based GI values only, and that in fact, the GI of the mixed meals was more strongly correlated either with the fat or the protein content than with the CHO content alone. Wolever et al. (Reference Wolever, Yang and Zeng10), again, found only negligible effects of protein and fat on the mean glycaemic responses to the mixed meals, and thus CHO explained about 90 % of the glycaemic response. However, in the present study, the predicted GI values of the mixed meals were not the same as the measured GI values of the meals because the GI value decreased remarkably after the addition of oil and/or protein to the mashed potato meal. This finding is similar to that of Flint et al. (Reference Flint, Moller and Raben9).
The results of the present study illustrate that the insulin responses to mashed potato-based meals were high. This finding is consistent with previous observations, which have classified potato as one of the most insulinogenic foods(Reference Holt, Miller and Petocz14). However, our findings demonstrated that adding fat or protein to the meal substantially modified the insulinaemic responses to mashed potato. Previous studies have shown that protein has an insulinogenic effect(Reference Gulliford, Bicknell and Scarpello15, Reference Bornet, Costagliola and Rizkalla31, Reference Gannon, Nuttall and Neil32), while fat reduces insulin responses(Reference Welch, Bruce and Hill5, Reference Gulliford, Bicknell and Scarpello15, Reference Gannon, Ercan and Westphal17) when the source of the available CHO was potatoes. Although both fat and protein slow gastric emptying and thereby reducing postprandial glycaemia, it seems that the reduced glycaemia due to protein is more likely to be explained by the enhanced insulin secretion(Reference Gentilcore, Chaikomin and Jones4, Reference Ma, Stevens and Cukier33). In the present study, the insulinaemic response was moderately reduced when 120 g of salad were added to the mashed potato meal. When the mashed potato meal included rapeseed oil, chicken breast and salad, the insulin response was smaller than that for mashed potato alone. Thus, oil and salad were able to overcome the strong increase in insulin response that was induced by the protein source alone. Another important factor is that the higher energy content of the meal slows gastric emptying(Reference Kwiatek, Menne and Steingoetter34), which may partly explain this finding.
Conclusion
We conclude that both fat and protein have an independent decreasing effect on the glycaemic responses to mashed potatoes in healthy subjects. The estimation of the GI of a mixed meal by calculation is imprecise when the meal contains fat and/or protein. The insulin response and the II to a mixed meal depend on the fat, protein and salad content of the meal. Since a mashed potato-based meal including a high-fat or high-protein food induces a substantially lower glycaemic response than mashed potatoes alone, there is no reason for recommendations to avoid eating potatoes. The nutrient content of potatoes is favourable; therefore, using potatoes moderately as a part of a meal should be encouraged.
Acknowledgements
We warmly thank the volunteers for taking the time to participate in the postprandial study. We extend our appreciation to Heikki Pakkala and Jukka Lauronen for assisting with the technical aspects of the study, and Laura Lund, Pia Mustonen and Raija Nevala for laboratory assistance. The present study was supported by the Ministry of Agriculture and Forestry, the Academy of Finland (grant no. 111420), the Juho Vainio Foundation, the Finnish Cultural Foundation and the Finnish Graduate School on Applied Bioscience: Bioengineering, Food and Nutrition, Environment. The contribution of each author was as follows: K. A. H., J. V., J. G. E. and L. M. V. contributed to the conception and design of the study; K. A. H and L. M. V. carried out the postprandial studies; J. E. S. was responsible for the analysis of the blood samples; H. K. S. carried out the statistical analysis; K. A. H. wrote the first draft of the manuscript; K. A. H., J. V., J. G. E. and L. M. V. participated in the writing of the final draft of the manuscript; K. A. H., J. V., J. G. E., H. K. S., J. E. S. and L. M. V. were responsible for the final manuscript. There are no conflicts of interest.


