

Summarizing the work of Martin Gilens and Benjamin Page, Larry Bartels recently exclaimed, “Rich People Rule!” Footnote 1 Indeed, the emerging scholarly consensus offers a startling picture of unequal representation in the United States. Footnote 2 Much of this research can trace its roots to the 2004 American Political Science Association Task Force on Inequality and American Democracy, which brought a renewed focus in political science to issues of inequality and representation. In the subsequent decade, academic attention to these issues has exploded and the resulting scholarship has had an impressive influence on the scholarly community. Footnote 3
This research has also influenced politicians, policymakers, and pundits. Barack Obama referenced Bartels' Unequal Democracy during the 2008 presidential campaign. Footnote 4 More recently, Jared Bernstein, who was a member of President Obama's economic team and Chief Economist and Economic Adviser to Vice President Biden wrote, “Both [Bartels and Gilens] rigorously document the disproportionate influence that the wealthy have on politicians and the political process.” Footnote 5 On the media side, Ezra Klein's Vox highlighted the attention Gilens and Page's work has received by referring to their article as “The new study about oligarchy that's blowing up the Internet.” Footnote 6 This work on unequal representation is among the most accepted and influential research by political scientists today.
Perhaps the most striking finding from this research is that when the preferences of wealthy and middle-income Americans diverge, policy only reflects the preferences of the most affluent. Footnote 7 Based on this result, Gilens concludes, “actual government policy does not respond to the preferences of the median voter.” Footnote 8 This is a shocking result because the median has the electoral power to change election outcomes. When those in the middle do not receive their preferred policy, they can presumably swing the next election outcome by voting for the opposing party. Footnote 9 Yet, Gilens finds that even when the preferences of low- and middle-income individuals align with each other and diverge from the preferences of the wealthy—i.e., when we would expect middle- and low-income voters to form an electoral majority—policy still only reflects the preferences of the highest income group. Footnote 10
These results raise a crucial question. Given their potential electoral influence, why don't those in the economic middle elect politicians who might better represent their interests? Scholars have long been interested in the relative silence of groups that do not appear to get their political way. Footnote 11 Yet, the apparent acquiescence of the median is particularly perplexing. Footnote 12 Even the theory of “economic-elite domination” predicts that the average citizen holds “some independent influence.” Footnote 13 According to Gilens and Page, Biased Pluralism, which emphasizes the disproportionate influence of organized interest groups, is the one theory that assigns “little or no independent influence” to the average citizen. Footnote 14 Yet, even E. E. Schattschneider, who drew attention to the “strong upper-class accent” of interest group politics, acknowledged that the public holds some political influence. Footnote 15 In response to Charles Erwin Wilson's (the former president and chief executive of General Motors) famous remark, “what is good for General Motors is good for the country,” Schattschneider explained, “it follows that Mr. Wilson's comment, far from demonstrating that the public interest is a fraud, proves that he thinks that the public interest is so important that even a great private corporation must make obeisance to it.” Footnote 16
In sum, existing theories of representation range from predicting hyper-responsiveness to the median voter to some responsiveness to the median on some issues. Why then, do policymakers ignore those in the economic middle—who Gilens and Page consider a proxy for the average citizen—and why do those in the middle ignore the fact that they are being ignored? Footnote 17 One possible explanation is that the political system is so tilted in favor of the affluent that those in the middle simply accept this political fate. I propose, however, that we do not observe a political backlash from those in the economic middle because policy typically corresponds with the median's preferences as much as it does the preferences of the affluent. Gilens, of course, acknowledges that when the preferences of the median and the affluent align, even if politicians only follow the affluent, policy will reflect the median's interests. I take this argument one step further. I show theoretically and empirically that even on those issues where the preferences of the wealthy and the median diverge (i.e., where Gilens finds that the middle receives no representation), policy can (and does) end up about where we would expect if policymakers followed the economic median and ignored the affluent. This result occurs because those in the middle still receive what I call coincidental representation.
I develop this theoretical argument in the following section and then examine the resulting predictions with Gilens' data. Gilens' research represents the best practice in studying representation and his data are the most comprehensive data ever collected on different groups' policy preferences and whether these policies became law. For these reasons, I build on Gilens' analytic approach throughout this article. After examining income groups, I then consider the preferences of strong partisans. In contrast to high- and middle-income groups, where coincidental representation is the norm, for strong Democrats and Republicans the opportunities for unequal representation are large. Although future research should consider the implications of relative policy support and coincidental representation for other groups, these results reinforce the importance of party identification for understanding policy outcomes and who gets represented. Footnote 18 My conclusion further considers the implications of the current findings for how we understand representation in the United States.
Preference Gaps, Relative Policy Support, and Representation
If two groups share the same preferences, even if policymakers only pay attention to one of these groups, both groups receive their preferred policy. Footnote 19 I call this coincidental representation. Because we are most interested in who gets represented when coincidental representation does not occur, scholars typically focus on issues where a preference gap exists. This preference gap represents the percent of one group who support a particular policy minus the percent of another group who support that policy. If the gap is zero, both groups express equal levels of support. Larger gaps have been interpreted as evidence of more distinct policy preferences and thus more opportunity for unequal representation.
Whether the groups correspond with income, gender, race, the politically informed, or voters and nonvoters, scholars have emphasized the representational implications of preference gaps. Footnote 20 Highlighting the preference gap between high- and low-income groups, Gilens concludes, “it is hard to escape the conclusion that public policy in the United States would look rather different if poor Americans had the influence over government policy that affluent Americans appear to enjoy.” Footnote 21
The key assumption of this research is that when preference gaps exist, coincidental representation is no longer possible. If policymakers ignore a particular group, policy outcomes will not align with that group's preferences. I propose, however, that when a preference gap exists, coincidental representation can (and does) occur. Even when the level of support for a policy differs across groups and policymakers only consider the preferences of one of the groups, both groups can receive equal representation. This result is possible as long as two conditions holds.
First, when policymakers consider the public's preferences, policies with greater amounts of support must be more likely, on average, to become law. Suppose, for example, that 80 percent of respondents favor more government spending on public schools and 60 percent favor increasing the minimum wage. All else equal, more spending on public schools should be more likely to pass than higher minimum wage. There are many reasons to expect this pattern to hold. Political decisions take place in a complex and resource-constrained environment. Thus, even if politicians wanted to follow the public's preferences, if a strong majority favored increasing government spending on education, defense, health care, and social security, fiscal constraints might limit the government's ability to do so. Furthermore, even when fiscal constraints are not present, producing legislation takes time and effort. Not all popular policies can be enacted. If the goal was to best represent the public's preferences, we should expect policymakers to look at which policy area (or areas) received the most public support. This expectation does not mean that politicians only (or always) consider the public's preferences. But when they do, they should consider how much support a policy receives. Because we are comparing support across polices, I refer to this as relative policy support. Footnote 22 Thus, in the previous hypothetical example, relative policy support was higher for spending on public schools (80 percent) than for increasing the minimum wage (60 percent).
Perhaps not surprisingly, it is easy to find evidence in support of this first assumption. Figure 1, which replicates Figure 3.2 in Gilens’ Affluence and Influence, shows that as relative policy support increases along the x-axis, the proportion of policies adopted (y-axis) also increases. The relationship is not perfectly monotonic, but the overall pattern is clear.

Figure 1 The relationship between policy adoption and relative policy support
Note: Replication of Gilens Reference Gilens2012, figure 3.2.
The second condition necessary for the possibility that groups with distinct preferences receive coincidental representation relates to how we define representation. I follow Gilens (and Gilens and Page) and focus on the congruence between relative policy support and whether the proposed policy becomes law. Footnote 23 In other words, if (as in figure 1) the probability of policy adoption increases as relative policy support increases, we have evidence of representation. I suspect that these two conditions (i.e., when politicians consider the public's preferences, more relative policy support corresponds with an increased probability of policy adoption and that such a relationship is evidence of representation) are straightforward—perhaps even axiomatic. Yet, as I will demonstrate, these conditions hold crucial—and surprising—implications for the existence of unequal representation.
Relative Policy Support by Group
When we examine the public as a whole, there is no need to differentiate between relative policy support and the level of public support for a policy. The higher (lower) the percentage supporting a policy, the more (less) relative support. The two concepts are interchangeable. Footnote 24 However, as I show in figure 2, when we consider groups, focusing on the level of policy support can yield different conclusions about representation than when focusing on relative policy support. Specifically, if two groups express different levels of policy support (i.e., a preference gap exists) relative policy support can still be equal. Footnote 25 To see why, consider figure 2. This figure presents hypothetical levels of support for two policies (more school funding and higher minimum wage) among the top- and middle-income groups. Of course, the real policy-making environment involves more than two policies, but this simplified example illustrates how a preference gap does not necessarily translate into different relative policy support across groups.

Figure 2 Hypothetical scenario 1: High- and middle-income preferences differ by more than 10 percentage points, but relative policy support is equal (both groups prefer more school funding more than increasing the minimum wage)
In figure 2, support among high-income respondents is plotted on the x-axis and support among middle-income respondents is plotted on the y-axis. In this hypothetical example, middle-income respondents are more supportive than high-income respondents of both higher minimum wage and more school funding by more than 10 percentage points (52 percent versus 40 percent support for minimum wage and 72 percent versus 60 percent for school funding). I set the preference gap to be more than 10 percentage points because this gap corresponds with Gilens’ definition of preference divergence. Footnote 26 Standard interpretations of this preference gap would conclude that the probability of more school funding and increased minimum wage would be higher if politicians considered the preferences of middle-income respondents and lower if they followed wealthy respondents. This perspective, however, ignores the concept of relative policy support. Recall that Gilens measures representation as “the strength of the association between policy outcomes and the degree of support expressed by the public (or a subgroup thereof).” Footnote 27 Although middle-income respondents are more supportive of both policies than high-income respondents, relative policy support (what Gilens calls the “degree of support”) for more school funding is greater for both groups. Regardless of which income group politicians turned to, we would expect the probability of legislating more school funding to be higher than increasing the minimum wage. Coincidental representation would occur.
Of course, a preference gap of more than ten percentage points can produce other patterns of relative policy support. Figure 3 presents an alternate scenario. Here, the wealthy prefer more school funding to increasing the minimum wage (62 percent versus 50 percent), while the middle-income group favors both policies equally (40 percent support). If a politician aimed to reflect the preferences of the wealthy, this politician should be more likely to support increasing school funding. This scenario would be consistent with Gilens' results, as we would expect a positive association between the relative policy support of the affluent and the probability of policy adoption and a near-zero association for those in the middle. Interestingly, even if a policymaker wanted to align his or her vote with middle-income respondents, these constituents are indifferent. Thus, the strategic vote would be for school funding. Absent a clear signal of support for one policy or the other from middle-income respondents, this politician should aim to please the group with distinct preferences over the two policies.

Figure 3 Hypothetical scenario 2: The wealthy prefer more school funding more than increasing the minimum wage, middle-income respondents are indifferent
Figure 4 presents a third hypothetical scenario. Here, middle-income respondents prefer increasing the minimum wage and high-income respondents prefer more school funding. The preference gap is equal to the first hypothetical scenario (figure 2), but in this example, distinct preferences correspond with different relative policy support. Footnote 28 As a result, the probability of policy adoption will be different depending on whether policymakers consider the preferences of high-income or middle-income constituents. If policymakers prioritize the preferences of the wealthy, we would expect increased school funding to be adopted against the preferences of the middle-income group. If relative policy support follows this pattern, and if policy outcomes reflect the preferences of the affluent, we would expect a negative association between the preferences of those in the middle and probability of policy adoption. This pattern would offer the strongest evidence of unequal representation.

Figure 4 Hypothetical scenario 3: High- and middle-income preferences differ by more than 10 percentage points and relative policy support is distinct (The wealthy prefer more school funding and middle-income respondents prefer increasing the minimum wage)
These three hypothetical scenarios illustrate that even when a substantial preference gap exists, we do not necessarily observe different relative policy support across groups. Preference gaps can produce different relative policy support (as in figure 3 or 4), but this outcome is not a guarantee (as in figure 2). The question then becomes, when we analyze relative policy support, which figure do the data most closely resemble?
Analysis: Coincidental Representation?
The above discussion shows that when two groups express different levels of support for a particular policy (i.e., preference gaps exist), similar patterns of relative policy support can lead to coincidental representation. Below, I use Gilens' data to analyze the implications of this argument for different income and different partisan groups.
The Fiftieth and the Ninetieth Income Percentiles
I begin by plotting the relative policy support of the fiftieth income percentile and the relative policy support of the ninetieth income percentile for the 1,836 survey questions in Gilens' data. The more the relationship follows a flat or negative slope (like figures 3 and 4) the more opportunity for unequal representation. By contrast, the more tightly the values cluster around a positive slope (like figure 2) the more we would expect coincidental representation to occur. The data in figure 5 clearly follow the latter scenario. The correlation is an impressive r=0.94. Footnote 29 Although the similar patterns of relative policy support are striking, these results are consistent with a large body of literature that finds a lack of relationship between economic self-interest and policy preferences. Footnote 30 As Gilens explains, “the empirical evidence suggests that for most people, most of the time, politics is not about the pursuit of individual gain, and that policy preferences reflect considerations of self-interest only weakly, if at all.” Footnote 31

Figure 5 Relative policy support among the 90th income percentile and the median income
Note: Hollow dots represent policy issues where the difference between high- and middle-income groups is 10 percent or less.
Because the preferences of middle- and high-income groups often overlap, Gilens suggests that those in the middle will often automatically get the policies they want when their preferences differ by 10 percentage points or less. The hollow dots in figure 5 represent these policies, which constitute 82 percent of the observations in Gilens' data. Thus, we are most interested in the policies where the preferences of middle- and high-income respondents differ by more than 10 percentage points (solid black dots). Interestingly, when we focus on just these policies, we continue to see some evidence of common relative policy support. The correlation is an impressive r=0.68. These similarities suggest that coincidental representation could still exist. Even if policy only responds to the wealthy, because those in the middle tend to be more (less) supportive of the same policies that the wealthy are more (less) supportive, we should expect policy to end up about where those in the middle would expect if they received the same representation as the affluent. If so, it would be reasonable for those in the middle to “feel” like their preferences are represented—at least to the same extent that the preferences of the wealthy are represented.
To test this possibility, we need an estimate of the probability of policy adoption if the rich received no representation and those in the middle received the same representation as the rich are thought to receive. To estimate this counterfactual scenario, I build on Gilens' analysis. Footnote 32 For each of the 1,836 survey questions in the data, Gilens determines whether the proposed policy or policy change was adopted within the subsequent four years. Thus, it is possible to identify the relationship between policy support and whether the policy (or policy change) was adopted. Gilens estimates the relationship between the preferences of the ninetieth income percentile and the probability of policy adoption to be 0.47 with a standard error of 0.18. Footnote 33 For the current analysis, we want to know what would be the expected probability of policy adoption if the wealthy received no representation and the relationship between the preferences of those in the middle and the probability of policy adoption equalled 0.47 (i.e., the estimated representation received by the wealthy). Since we know the proportion of middle-income respondents who support each policy, we can easily estimate the predicted probability of policy adoption under this counterfactual scenario. Footnote 34
Figure 6 reports the results of this exercise. The x-axis corresponds with the proportion of the ninetieth income percentile that supports each policy. The y-axis indicates the predicted probability of policy adoption. The grey dots and grey vertical lines indicate the predicted probability and 95 percent confidence interval of policy adoption based on the preferences of the ninetieth income percentile. These estimates are based on a replication of Gilens' table 3.2 and, not surprisingly, match Gilens' figure 3.5, which shows that the probability of policy change increases as support for the policy among the wealthy increases. Footnote 35
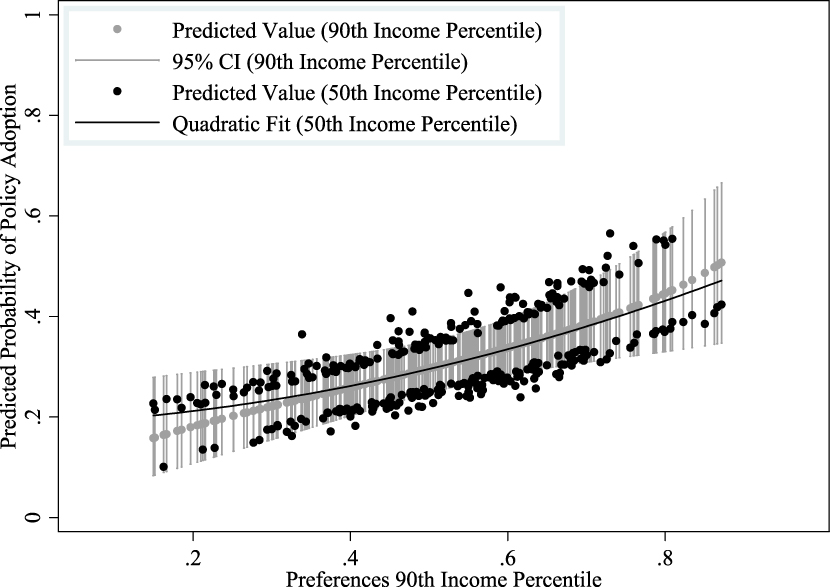
Figure 6 The expected probability of policy adoption based on the preferences of the 90th income percentile and the expected probability of policy adoption if the 50th income percentile received the same amount of representation as the 90th income percentile (and the 90th income percentile received no representation)
The black dots indicate the expected probability of policy adoption if the affluent received no representation and those in the middle of the income distribution received the same representation (based on Gilens' estimates) as those at the top. Several patterns stand out. First, notice that a vertical gap separates these predicted values based on middle-income preferences. This gap results because the figure only includes policies for which those in the middle expressed more than 10 percentage points more or less support than high-income respondents. Thus, when we multiply .47 (the estimated representation of high income respondents) times the policy preferences of those in the middle, the resulting predicted values will always fall above or below the estimates for the ninetieth income percentile. Nevertheless, there is substantial overlap in the two sets of predicted values. In fact, approximately 66 percent of the predicted values based on middle-income preferences fall within the 95 percent confidence intervals of the predicted values for the affluent. This is an impressive overlap because these data represent the 18 percent of policies where the preferences of high- and middle-income respondents differ the most. Furthermore, none of the predicted values for the middle-income are statistically different from the affluent.
The thin black line in figure 6 represents the quadratic fit between the predicted values based on the preferences of the median income and the preferences of the ninetieth income percentile. This line offers a direct indication of the association between expected outcomes and relative policy support. The near identical correspondence between this line and the predicted values from the ninetieth income percentile (grey dots) means that even if policy only reflected the preferences of those in the middle, we would still expect the probability of policy change to increase as the support for the policy among the wealthy increased. Of course, the converse is also true. Figure A-1 in Supplementary Appendix 2 plots the probability of policy adoption as a function of the preferences of the fiftieth income percentile (instead of the ninetieth income percentile). When the predicted values are plotted in this way, we see that the probability of policy adoption also increases as support among those in the middle increases. This is exactly what we would expect if those in the middle receive substantial coincidental representation when their preferences differ from the wealthy.
Gilens' results have been interpreted to mean that when wealthy and middle-income Americans disagree, policy ends up where the wealthy want—at the expense of those in the middle. But this is typically not the case. Even when policy preferences differ across groups, when relative policy support is similar—as we see here—policy ends up about where it would have been if those in the middle received the exact same representation as the wealthy. These conclusions hold when we only consider economic and social welfare policies (refer to figure A-2 in Supplementary Appendix 3) and when we include the preferences of organized interest groups in the statistical model (refer to figure A-3 in Supplementary Appendix 4).
The results do, however, affirm another of Gilens' important findings—status quo bias. Even at the highest levels of public support, the expected probability of policy change almost never exceeds 0.5. This is an important result because status quo bias means that rising economic inequality is more likely to continue. Footnote 36
Strong Democrats and Strong Republicans
In this section I consider strong partisans. Strong partisans represent an important segment of the electorate, because we might expect politicians to be particulary responsive to their base. Furthermore, when policymakers prioritize their partisan base, coincidental representation should be unlikely to occur. In recent decades, Democrats and Republicans have become increasingly sorted, preferring distinct policies. Footnote 37 These distinct policy preferences imply much less overlap in relative policy support. Thus, if policy tends to follow the preferences of Republicans (Democrats), in contrast to the results in the previous section, we would not expect Democrats (Republicans) to “feel” like their preferences were represented.
To evaluate this expectation, I again utilize Gilens' data, and I estimate the probability of policy adoption given the preferences of Strong Republicans and Strong Democrats. I focus on strong partisans because these individuals allow us to observe patterns of relative policy support that are most likely to be distinct. The analysis is limited to survey questions that were asked between 1999 and 2002 because this is the period for which the preferences of strong partisans are available in the data (the proposed policies, if adopted, became law between 2000 and 2004). Footnote 38 In these surveys, 15.5 percent of respondents identified as Strong Democrats and 19.6 percent indicated they were Strong Republicans. Given the partisan sorting in the electorate, not surprisingly, we observe much less overlap in the preferences of Strong Democrats and Strong Republicans than we observed with middle- and high-income groups. The overall correlation between the percent favoring policy change among Strong Democrats and Strong Republicans is r=0.43. When these groups' preferences differ by at least 10 percentage points, the correlation drops to r=0.21.
During the period of analysis (1999–2004), national politics strongly favored Republicans. Although Bill Clinton occupied the White House in 1999 and 2000, both the House and the Senate were majority Republican. Furthermore, President George W. Bush enjoyed a majority Republican House and a split Senate during his first two years and a Republican majority in both the House and the Senate during his second two years. Not surprisingly, the relationship between the proportion of Strong Republicans that favored a policy and the probability that the policy became law is statistically significant and substantively important (b=0.79, s.e.=0.25, refer to table A-1 in Supplementary Appendix 5). The corresponding relationship for Strong Democrats is small and not statistically different from zero (b=0.10, s.e.=0.17).
Figure 7 illustrates the substantive implications of these relationships. The x-axis corresponds with the proportion of Strong Republicans that supports each policy and the y-axis indicates the predicted probability of policy adoption. The grey dots and grey vertical lines indicate the predicted probability and 95 percent confidence interval of policy adoption based on the preferences of Strong Republicans. Consistent with expectations, we see a strong relationship between the preferences of Strong Republicans and the probability of policy adoption between 1999 and 2004.
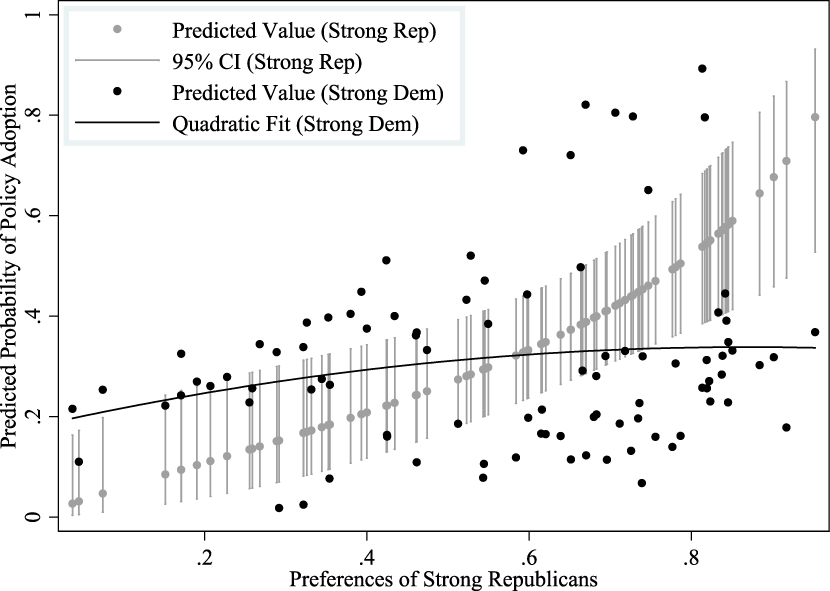
Figure 7 The expected probability of policy adoption based on the preferences of strong Republicans and the expected probability of policy adoption if strong Democrats received the same amount of representation as strong Republicans (and strong Republicans received no representation)
To evaluate whether Strong Democrats received coincidental representation, I examined the counterfactual scenario where Strong Democrats received the same Representation as Strong Republicans. The black dots in figure 7 indicate the expected probability of policy adoption based on this counterfactual scenario. Footnote 39 These predicted probabilities follow a much different pattern than what we observed for middle-income individuals in figure 6. First, the predicted values for Strong Democrats are much more dispersed. In fact, 76 percent are outside the 95 percent confidence intervals based on Strong Republicans. Not only is this more than twice as many as for the middle-income respondents, but the proportion of policies where preferences differ by more than 10 percentage points is also much greater for strong partisans than for middle- and high-income groups (72 percent versus 18 percent). Thus, these values outside the confidence intervals represent 55 percent of all policies in the strong partisan analysis while the values outside of the 95 percent confidence intervals for middle-income respondents represented just six percent of all observations. These patterns suggest that if policy during the early 2000s followed the preferences of Strong Democrats instead of Strong Republicans, policy would have looked much different. The flat trajectory of the thin black line, which reflects the quadratic fit between the predicted probability of policy adoption for Strong Democrats (if they received the same representation as Strong Republicans), reinforces this conclusion. This flat relationship means that as support for a policy among Strong Republicans increases, we have no evidence that the probability of policy adoption would also increase if policy reflected the preferences of Strong Democrats. Coincidental representation is minimal (at best) for strong partisans.
Given the polarized nature of the current political environment, strong partisans offer a most likely case for observing representational differences. Thus, even casual observers of politics may not be surprised by the patterns in figure 7. But this is precisely the point. Although scholars have increasingly focused on the lack of responsiveness to middle-income Americans, it may be that partisan divisions matter most for policy outcomes. If we want to know who gets represented—or at least who “feels” like they get represented—we need to bring partisanship into the analysis.
Conclusions and Implications
If “rich people rule,” it rarely appears to be at the expense of those in the middle. Coincidental representation appears to be the norm. It is also possible that some of what I have interpreted as coincidental representation reflects direct representation of those in the middle. Some direct representation is consistent with most theories of representation. And although it is difficult to identify who policymakers represent when preferences are so similar, recent research using population-level data has found evidence that those in the economic middle receive substantial representation. Footnote 40 Extensive aggregate-level research is also consistent with the possibility that policy reflects the preferences of those in the middle. Footnote 41 Although money certainly matters in U.S. politics, it may be too early to completely dismiss standard theories of representation.
It is equally important to not paint an overly sanguine portrait of contemporary America. Inequality is real and has negative consequences. Whether we look at health, education, employment, or social mobility in the United States, opportunities and outcomes are highly varied across the income distribution. But the current results suggest that we must look beyond theories of economic-elite domination to fully understand the unequal playing field that citizens face in the United States today. An important starting point is understanding why relative policy preferences are so similar across income groups. Some might interpret these similarities as good news. In the preface to Beyond Self-Interest, Jane Mansbridge writes of “individuals’ commitment to moral principles, concern for others, ‘we-feeling,’ and readiness to cooperate when cooperation does not serve self-interest narrowly conceived.” Footnote 42 The similar relative policy support across middle- and high-income groups could certainly be viewed as consistent with “concern for others” and “readiness to cooperate.” However, the previous results are also consistent with a much more grim picture of U.S. politics. It may be that political messages are so homogenous or that power structures are so engrained that those who would benefit most from government support do not consider their economic self-interest when expressing their policy preferences. Footnote 43 This view is consistent with evidence that despite rising inequality since the 1970s, support for redistribution among middle- and low-income Americans has largely paralleled the preferences of the wealthy. Footnote 44 When the distributional implications of policies are made clear, citizens can connect their economic self-interest to their policy preferences, but it may be that political debates typically do more to obfuscate, rather than clarify such implications. Footnote 45
Of course, we must also continue to study the extent to which other groups—such as racial groups, low-income individuals, or organized interests—see (or do not see) their preferences reflected in policy outcomes. The focus on middle- and high-income groups was advantageous because Gilens and Page view the median income respondent as a valid proxy for the average citizen. Footnote 46 Not only does the focus on the average citizen hold important normative implications but the median relates directly to most theories of representation. The focus on partisan groups, by contrast, offered a theoretically most-likely case of the absence of coincidental representation. Future research, however, should apply the current methods to identify when other important groups are more or less likely to receive coincidental representation. As this research proceeds, scholars should remember that preference gaps do not necessarily mean the absence of coincidental representation.
Future research should also keep in mind that I have focused on just one type of representation. The analysis followed recent research on unequal representation and analyzed the relationship between relative policy support (i.e., the degree of policy support) among different groups and the probability of policy adoption. Footnote 47 There are many other ways to conceptualize representation. Footnote 48 For example, in terms of descriptive representation, which refers to the extent to which elected officials reflect important descriptive characteristics of their constituents, such as occupation, race, or gender, the U.S. political system fares poorly. By contrast, the opportunity for unequal dynamic representation, which refers to whether policy responds to changes in the public's preferences, is minimal. Because different groups typically update their preferences in “parallel,” if politicians respond to the shifting preferences of one group, other groups will receive coincidental representation. Footnote 49 How we rate the quality of representative democracy in the United States depends heavily on the definitions of representation that we apply.
Supplemental Materials
Appendix 1. Correlated Measurement Error or Correlated Preferences?
Appendix 2. Predicted Probability of Policy Adoption Plotted against the Preferences of the 50th Income Percentile
Appendix 3. Only Analyzing Economic Policies
Appendix 4. Results Based on Gilens and Page’s (Reference Gilens and Page2014) Model
Appendix 5. The Relationship between Strong Partisan Preferences and the Probability of Policy Change
Replication Data
Replication Code
Explanatory File


 Open access