


We report here on the journal’s operations from July 1, 2014, to June 30, 2015, the third full year that the University of North Texas (UNT) team has been at the helm of the Review.
However, unlike past reports, we would like to begin our report with an announcement and a thank you. As you probably already know, we have decided not to continue to serve as editors of the Review once our four-year term expires, and will be passing the editorship on to the new editorial team in July 2016. We were offered the opportunity to continue our editorship until 2018 (i.e., a two-year extension which would be the maximum allowable term as editors) by the APSA leadership, but for some very personal reasons we decided to decline that offer. Although each of us had reasons, personally, for me (John Ishiyama), I chose not to continue because my daughters, who are now in high school, will graduate in 2018. I do not want to miss out on this very important time in their lives, so for me the choice to decline the offer was an easy one to make. Although we enjoy being editors, and are honored by the confidence the association has had in our leadership of the journal, we also believe that one full term at the helm is enough. We wish to express our great thanks to the APSA, former president Rodney Hero, president Jennifer Hochschild, president-elect David Lake, APSA executive director Steven Smith, the staff, the council, and the publications committee, as well as to Cambridge University Press for their support and guidance over the past four years. We will continue to serve our discipline and the association as editors of the APSR to the best of our abilities until the new editorial team takes over in July 1, 2016.
As always, we would also like to thank the members of our editorial board, who have helped us with their advice on more than a few submissions and have served as “guest editors” on UNT-connected submissions that might otherwise raise issues of conflict of interest. We also want to thank all of the authors who submitted their papers for consideration in the past year and the referees who reviewed them. In particular, without the talented work of authors and the referees’ commitment of time and effort in service of the profession, there simply would be no Review.
This report highlights our accomplishments over the past year. When we took on this job in 2012 we identified three primary goals in our manifesto: 1) to improve the efficiency of the Review’s editorial process; 2) to increase the number of submissions, as well as the diversity of submissions, which we anticipated would lead to a greater diversity of articles appearing in the Review; 3) to maintain the APSR’s position as the leading political science journal in the world. The following report highlights the progress we have made toward those goals. We are pleased to report that we continue to accomplish the goals that we first laid out in 2012.
SUBMISSIONS AND PROCESSING
Number of Submissions
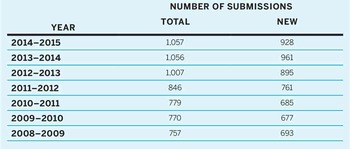
In terms of number of submissions, for 2014–2015, the UNT team reports the highest number of total submissions to the APSR on record (breaking the previous record established last year, see table 1). From July 1, 2014 to June 30, 2015 we received 928 new submissions, which is slightly down from the 961 from the previous year. However, when revisions are also factored in, 2014–2015 represents the highest total number of papers handled in any 12-month period on record for the APSR, from the previous year’s reported total submissions of 1,056 to 1,057. Despite this record number of submissions, we still maintained a turnaround time of 49.3 days from receipt to first decision, which is marginally higher than the previous year of 49.2 days, but significantly lower than previous years.
Table 1 Submissions per Year
From July 1, 2014, to June 30, 2015, we invited 4,320 reviewers—2,449 of whom accepted; 1,028 declined. The remaining reviewers were either withdrawn as reviewers, or a response to our request to review for papers currently under review is pending. Thus 70.4% of those who responded to our review request agreed to review, which is more than the 65.5% rate that we reported for 2013–2014.
It is notable that the editorial team has made an effort to understand the causes for reviewers declining to review. In an article that appeared in PS: Political Science & Politics 48:4, APSR editor Marijke Breuning and her coauthors analyzed the reasons given for declines to review, which has a great deal to do with the increasing overall workload faced by faculty members. This has impacted negatively on reviewer agreement rates.
It is important to note two things from the PS article. First, an underlying concern expressed at previous APSA Council and APSR editorial board meetings, was that reviewer declines were caused by “reviewer fatigue” (i.e., too many reviews were being requested of reviewers), and that this jeopardized the efficiency of the editorial process. The report by Breuning et al. indicates that the “fatigue” issue is much more complex than reviewers being asked to do too many reviews (2015). Generally, there are many other demands made on faculty time, which goes beyond being asked to review. Second, there appears to be no relationship between reviewer fatigue and efficiency of the editorial process, as demonstrated by our own success in maintaining fairly quick turnaround times, irrespective of “decline to review” rates.
Turnaround Times
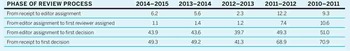
We have made great efforts to reduce the number of days it takes to process manuscripts from first receipt of a submission to first decision (table 2). As indicated in the table, despite the substantial uptick in submissions processed by the UNT team from 2013–2014, we have maintained a very low turnaround time of 49.3 days. Although slightly higher than our previous year, this is substantially lower than previous years. One of our primary goals was to shorten the editorial assistant vetting and coeditor reviewer assignment time. Our editorial assistants have been very diligent in processing manuscripts quickly, and we have endeavored to be as quick as possible in reviewer assignment times. We have also engaged in the practice of directly contacting late reviewers to expedite the review process, although our reviewers have been generally very prompt in completing their reviews, 34 days on average. Indeed, the lion’s share of the credit in reducing turnaround times lies with the efficiency of our editorial assistants and of our reviewers.
Table 2 Elapsed Time (Avg. No. of Days) in Review Process, 2010–2014
Mix of Submissions
In terms of mix of submissions (see tables 3a–4b) during the period 2014–2015 the distribution of submissions changed somewhat when compared to previous years. Categorized by disciplinary subfield, the papers we received from July 2014 to June 2015 are reported in table 3a. The largest proportion of manuscripts continues to be from the comparative politics field (36%). Overall, the proportion of submitted manuscripts from all fields has remained unchanged when compared to the previous year.
Table 3a Distribution of New Papers Submitted, 2014–2015 Compared with Previous Years (%)
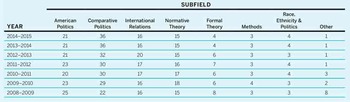
Table 3b Distribution of New Papers Submitted, 2014–2015 Compared with Previous Years (%)
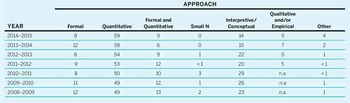
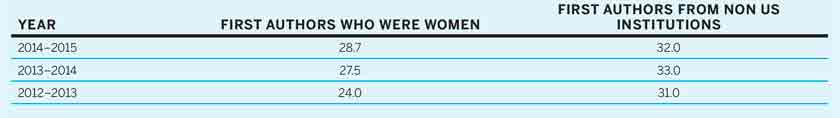
Table 4 Distribution of first authors of submitted papers by gender and international authorship (%)
During the period 2014–2015, in terms of the mix of submissions by approach, the patterns of submissions are also consistent with past patterns (table 3). The largest proportion continues to be quantitative (59.0%) with slight declines in purely formal approaches, but an increase in papers using both formal and quantitative approaches. Those classified as interpretive /conceptual and qualitative/ empirical have remained essentially the same since last year. Overall, in the past year, formal, quantitative, and formal and quantitative submissions constitute 75% of all submissions, in comparison to the 76% of all submissions from these approaches in 2013–2014. This proportion has remained the same for several years, although the mix has varied somewhat over time.
In addition to traditional indicators of the diversity of submissions that have appeared in past reports, we have also collected data on two other indicators of diversity during the period July 2014 to June 1 2015—gender of first author of the submission, and national location of first author of the submission (data that we first reported in last year’s annual report). These data were not collected by previous editorial teams.
Thus far, 71.3% of first authors during this period were men, and 28.7% were women (see table 4). Although we believe that this is progress (with the proportion of women first authors higher than our first year as editors), this is still lower than the estimated 32% of the APSA membership that is comprised of women (although progress is being made, albeit slowly). Further, approximately 32% of first authors of submitted manuscripts were based in non-US institutions, about the same as the previous year (33%). This is an encouraging sign as the APSR continues to strive to be the leading political science journal in the world. We are hopeful to improve the diversity of submissions on all dimensions, and will continue to monitor trends in terms of gender and international authorship.
OUTCOMES
Table 5 reports the outcome of the first round of the review process for the year 2014–2015 (as well as for previous years to provide comparative perspective). For the past year, the proportion of summary rejects and inappropriate submissions (both without review), the proportion of rejects after reviews, conditional accepts and accepts after first round, were very consistent with percentages reported in the previous years.
Table 5 Outcome of First Round of the Review Process (%)
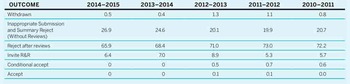
Continuing the practice of our predecessors we have made use of summary rejection to relieve “reviewer fatigue” and to remove from consideration submissions that would most surely not survive the usual review process. In comparison with previous year (2013–2014), in 2014–2015 summary rejects increased to nearly 27% of the total. Further, rejection after reviews remains about the same percentage in comparison to previous years (65.9%). The percentage invited to revise and resubmit is slightly lower than the previous year (6.4%).
Tables 6a and 6b report outcomes by accepted manuscripts by field and approach. Papers accepted by field showed that the largest proportion of manuscripts accepted were from comparative politics (35%) and normative theory (26%). The proportion of acceptances in international relations and American politics increased compared to the previous year. There has, however, been a decline in the proportion of accepted papers that were from formal theory (from 5% to 0%). However, three things should be remembered. First, authors categorize themselves in these fields. Authors of papers that essentially use formal approaches increasingly categorize these papers as belonging to one of the other subfields, particularly American politics or international relations. Second, as indicated in table 6b, the proportion of papers accepted that use formal approaches, or formal and quantitative approaches, stands at 12%, which has remained the same over the past three years. Finally, there is the increasing use of formal modeling approaches in many quantitative papers—this represents a fusion of formal theory and quantitative empirical approaches, which we take as progress in the field.
Table 6 Annual and 5-year Thomson-Reuters JCR impact factors for the APSR
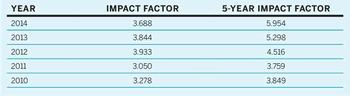
Table 6a Distribution of Papers Accepted by Field (%)
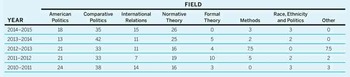
Table 6b Distribution of Papers Accepted by Approach (%)
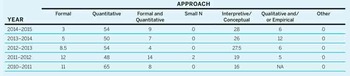
As indicated in table 6b, the percentage of formal and formal and quantitative acceptances continued to decline slightly, but, quantitative submissions increased. Collectively, the three categories account for 65% of all papers accepted during 2014–2015. This is a somewhat higher percentage than the 62% reported last year, but substantially lower than the 74% reported by our predecessors in 2011–2012 (and much lower than the 2009–2010 proportion of 84%). On the other hand, there has been a significant increase in the proportion of papers using qualitative, conceptual, and interpretive methods accepted by the Review over the past two years. In 2014–2015, 34% of the manuscripts accepted were in these categories, slightly down from 38% in 2013–2014, but up from 24% in 2011–2012. We take this as evidence that the Review continues to make progress in diversifying its content, particularly in terms of approach.
In addition to keeping track of the diversity of acceptances by field and approach, beginning this year we report on the diversity of acceptances and published articles in the APSR by gender and by whether the authors were based at non US institutions. This was requested in a previous APSR editorial board meeting, and we agree that such data provides greater insight on our team’s progress in diversifying the articles that the Review produces.
Tables 7a and 7b report two different types of data. In table 7a we report the breakdown of articles accepted for publication in terms of gender and non US institutional affiliation, for first authors, by year. In other words the data are similar to the breakdown of submissions reported in table 4, but in table 7a the data are only for accepted articles. The table only covers the years in which we were at the editorial helm (such data are not available for previous editorial teams). As indicated in table 7a, and consistent with the submission results above, the percentage of accepted pieces whose first listed author was a woman was steady at 26.4% of the total number of accepted pieces by year . This is only slightly below the 28.7% of submissions whose first author was a woman.
Table 7a Percent Women and International Scholars Who Were First Authors of Accepted Papers (through June 30, 2015)
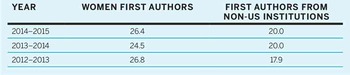
Table 7b Percent Women and International Scholars Who Were Authors of Pieces Published in APSR 2011–2015 (Years under UNT Editorial Direction Bolded)
The percent of articles accepted whose first author hailed from a non-US institution, is, however significantly lower that the percent of submissions from non US institution (20.0% vs 32% respectively). This suggests some disparity which may be due to the lack of familiarity with US style academic publishing, especially on the part of scholars from non-Western home institutions. We believe that this is an issue that the APSA will need to address as it seeks to become a more international organization and to reach out to scholars beyond North America, Europe, and Japan.
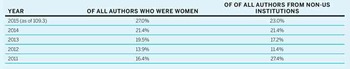
Table 7b reports the breakdown by gender and international authors, for all authors that appeared in the APSR, by year, from 2011 to the third issue of 2015. As indicated in the table, the APSR has made significant strides in publishing women scholars. Since 2013 (the first volume year for which the UNT team was responsible), the percentage of women authors has increased to approximately 27% of all authors published in the Review in 2015, which is significantly higher than when we took over the editorial reins of the APSR. We have made less significant, but steady progress in terms of publishing scholars from non-US institutions.
VISIBILITY
The American Political Science Review remains near the top ranked journal in political science with a Thompson-Reuters Impact Factor (IF) score in 2014 of 3.688 (slightly down from 3.844 in 2013). Unfortunately, we are ranked #2 in 2014, behind Political Analysis, which increased its IF score significantly this past year. However, and perhaps more importantly, the Review’s five-year impact factor score in 2014 has risen significantly to 5.954, up from 2013 (5.298), which is the highest level recorded to date for the APSR. Thus, the Review is in first place in the 5-year impact factor rankings, far ahead of most comparable journals.
In addition to maintaining top rankings for the Review in terms of IF scores, we have also worked closely with Cambridge University Press (particularly with Janise Lazarte at CUP) to more broadly publicize pieces that appear in the Review. This has included the use of press releases, email notifications, and other electronic media (such as Twitter) to “get the word out” about work that appears in the APSR. Further, we continue our relationship with the editors of the popular political blog, The Monkey Cage, to highlight important pieces that are scheduled to appear in the Review (using it as a way to publicize and preview pieces in much the same way as movie “trailers”). We believe that these efforts have greatly increased the public visibility of the Review.
Finally, it should be noted that the UNT editorial office delivers issues on time, and the physical production of APSR is generally on schedule, although there have been some delays recently, largely due to production issues.
CONCLUSION AND FUTURE PLANS
Based upon the preceding text, the Review has made great strides over the past three years in terms of significantly reducing the processing times of manuscripts to first decision, maintaining the diversity of types of submissions to the Review and increasing the diversity of types of articles accepted by the APSR for publication, while maintaining the APSR as the world’s leading journal in political science. It appears that not only have there been increases in submissions to the Review and increases in the diversity of what appears in the APSR, but also increases in citations to articles that have appeared in the Review. In short, we believe we have made good progress in realizing the goals that we laid out in our initial editors’ manifesto in 2012.
As we enter our final year as the editorial team and as mentioned in our last annual report, we as editors intend to move forward to implementing changes in the APSR submission guidelines to reflect the Data Access and Research Transparency (DART) principles. As you may know, we, as editors of the APSR, along with the editors of many other leading political science journals, have committed to implementing the principles recommended by the APSA Ad Hoc Committee on Data Access and Research Transparency (DART). The statement from the DART group can be found here http://www.dartstatement.org/. We are currently in the process of revising our submission guidelines to be consistent with these recommendations. However, we are very mindful of the diversity of research traditions in our discipline, and realize that “one size does not fit all”—so we wish to proceed with due care. Nonetheless, we believe that these are timely changes that need to be made to promote research transparency and trust in our scholarship, and hence are committed to implementing these changes in 2016. We discussed the proposed changes at the Annual Meeting in San Francisco at a special panel, and we will work closely with the new incoming editorial team in designing and implementing these changes.
Thank you very much for the opportunity to serve the association and our discipline. We remain grateful for the trust and support of our colleagues, and we welcome your comments and any suggestions as we proceed.


