


Long-term care problem
Seventy-six million baby boomers are aging and approaching a time in their lives that frequently requires expensive long-term care. By 2020, the population over age 65 will grow by more than 60%, to more than one in every six Americans (AoA 2005), and the number of seniors over age 85 will grow more than 80% (Sheppach Reference Sheppach2005). Right now, nationally, about 15% of citizens over 60 years old live with limitations that require some form of long-term care. The US Department of Health and Human Services (DHHS) expects more than 40% of people over 65 to spend some time in a nursing home (CMS 2005).
Most nursing home stays are short in duration, employed for surgery or illness recuperation and paid for by Medicare because they are medically necessary. However, a sizeable portion of nursing home stays are for long-term custodial care – and are increasingly paid for by Medicaid, the health coverage provider for the poor. Across the nation, 10% of seniors stay in nursing care for at least five years (CMS 2005). Current expenditures for long-term care services of all types amount to about $137 billion per year. Families and individuals cover about one-fourth of those costs out-of-pocket, but federal/state funded Medicaid programmes cover nearly half (Byers Reference Byers2003). A little more than 35% of Medicaid dollars nationally go to long-term care, and that percentage could explode in coming years, robbing other claimants of benefits or presenting states and the federal government with enormous revenue requirements.
Medicaid expenditures are skyrocketing, driven by a potent combination of increasing numbers of elderly, expansions in programme eligibility and rapidly inflating health care costs. The problem presents stark fiscal problems nationally and to state governments in particular. About one out of every four nursing home residents (by far the most expensive type of long-term careFootnote 1 ) are fully covered by Medicaid, and that proportion has been growing about 12% per year (Voudrie Reference Voudrie2006). More than two-thirds of nursing home residents receive at least some Medicaid funds (Merline Reference Merline1995). The federal government and the states have been trying, with limited success, to curtail the explosion of Medicaid costs.
Long-term care insurance
Many advocate a private market response to the long-term care problem in the form of inducements for employers and individuals to purchase long-term care insurance. The American Legislative Exchange Council asserts that “private long-term care coverage would provide consumers and the nation the most cost-effective method of providing long-term care services” (Herrera 2006). The American Health Care Association calculates that the percentage of nursing home residents relying on Medicaid could be cut by more than half over the next 25 years if about half of those over 55 could be induced to purchase long-term care insurance packages now (quoted in Herrera 2006). The policy question is: How much will the inducements cost the state, and will the expected reduction in Medicaid expenditures compensate for those costs?
For quite some time, the long-term care insurance sector has remained stunted – in part because such policies are considered too expensive by most consumers (Brown and Finkelstein Reference Brown and Finkelstein2007, Reference Brown2008; Brown et al. Reference Brown, Goda and McGarry2012). Figure 1 illustrates typical long-term care insurance costs. For example, a 40-year-old could expect to pay nearly $1,000 per year for a long-term care policy that features a relatively tight lifetime benefit cap.
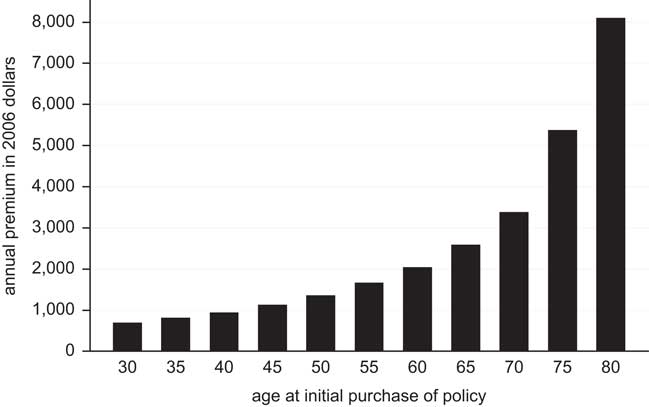
Figure 1 Annual premiums for a selected policy (based on the ‘150+’ Federal Long Term Care Insurance policy).
In addition to the cost of private long-term care insurance, Brown et al. (Reference Brown, Coe and Finkelstein2007) estimate that the availability of Medicaid generates a large crowd-out effect and hampers growth of the long-term care insurance market, even under very aggressive limits on eligibility. The National Center for Policy Analysis concluded that, “for every extra $1 spent on Medicaid, spending on private [long-term] insurance contracts by 50 to 75 cents” (Goodman and Herrick Reference Goodman and Herrick2005).
In 2009, the federal government sought to create a public form of long-term care insurance through the CLASS Act. However, the programme was voluntary and a prohibition in the Act against subsidising such policies meant that the programme would be no more successful than the stunted private marketplace; CLASS implementation was cancelled in 2011.
As an alternative solution to the Medicaid problem, others have advocated inducements for individuals to voluntarily give up their asset-shielding efforts and pay for care with long-term care insurance. Efforts in this direction have been supported by the Robert Wood Johnson Foundation, American Legislative Exchange Council, the National Center for Policy Analysis and the National Association of Health Underwriters, among others.
Insurance tax credits
At the federal level, long-term care insurance may be listed as an itemised deduction on one’s income tax return, but only if total medical expenses exceed a certain percentage of gross income – formerly 7.5% but increased to 10% in 2013. As noted by the American Health Insurance Plans, “because this threshold is so high under current law, fewer than 5 per cent of all tax returns report medical expenses as itemized deductions” (Ignagni Reference Ignagni2005). Even for those able to claim the federal deduction because of high medical costs, about 10% of long-term care insurance policies do not qualify under rules set by HIPAA, and the deduction is limited based on the taxpayer’s age (see Kassner Reference Kassner2004 or IRS Publication 502 for details on the limits). For younger people with lower out-of-pocket health costs, these limitations effectively eliminate the tax advantages provided by the federal government for long-term care insurance.Footnote 2
Many states adopted tax incentives in the 1990s for the purchase of long-term care insurance. Details of those policies are contained in Table 2. Of the 16 states with tax incentives available by 2002, 11 states allow premiums to be deducted from state individual income taxes, while five or six others provide a tax credit to individuals or employers. There is substantial variation in the levels of subsidies provided in these state plans (Weiner et al. Reference Weiner, Tilly and Goldenson2000). As Table 2 indicates, state subsidies for the individual purchase of long-term care insurance range from $30 to $250 per year on a $1,000 per year policy. The two state subsidies for the employer provision of long-term care insurance are pegged at $100 per employee per year. Since 2002, more states have enacted similar laws, such that 29 states provide tax incentives for the purchase of private long-term care insurance (Baer and O’Brien Reference Baer and O’Brien2009).
While state laws tend to provide modest incentives for the purchase of long-term care insurance, the cumulative effect is a substantial drain on state coffers. In 2005, the American Association of Retired Persons (AARP) estimated that New York’s long-term care insurance subsidy reduced state tax revenue by $47.3 million annually. Fifty million dollars is only 0.03% of New York State’s overall budget, but put in human or fiscal management terms, the opportunity costs are substantial. Fifty million dollars exceeds the state’s annual contribution to its rainy day fund for the past decade. The state only increased its social services funding by about $15 million in 2012. Fifty million dollars could provide a $4,500 payment to each of the nearly 11,000 families that experience homelessness in New York City. Systematic data is not available for every state, but Table 2 indicates the fiscal drain experienced by a number of states based on estimates provided by AARP (Baer and O’Brien Reference Baer and O’Brien2009).
Existing research on health insurance generally provides little indication that modest shifts in cost will induce significantly more people to purchase insurance. Health insurance in the United States, for example, exhibits low price elasticity of demand in both the individual and employer-provided market (Gruber and Washington Reference Gruber and Washington2005; Heim and Lurie Reference Heim and Lurie2009). Subsidies for individuals to purchase health insurance have been judged ineffective in Spain and Australia (López Nicolás and Vera-Hernández Reference López Nicolás and Vera-Hernández2008; Palangkaraya et al. Reference Palangkaraya, Yong, Webster and Dawkins2009).
When states have conducted their own fiscal planning for long-term care insurance tax subsidies, they have estimated a zero sum impact on demand. For example, the Ohio Legislative Budget Office generated sales forecasts for such insurance showing no change based on existing trends [Ohio Legislative Budget Office (OLBO) 1999]. When Hawaii considered enacting a tax credit in 2005, the Department of Taxation’s impact assessments similarly contained no projections for increased sales of long-term insurance, saying only that, “the revenue loss [resulting from tax credits] may increase as more taxpayers take advantage of the credit” (Kawafuchi Reference Kawafuchi2005). One would hope that long-term care insurance sales would grow in response to state tax incentives. Otherwise, the incentives are a waste of taxpayer dollars. Indeed, the total value to the state in terms of reduced Medicaid costs and to its residents in terms of additional insurance benefits needs to exceed the cost in tax subsidies in order for the programme to be fiscally sound.
There is reason to believe the purchase of long-term care insurance can be induced by tax incentives. For example, increases in available income have been shown to greatly increase the likelihood of long-term care insurance purchases by the least wealthy (Mellor Reference Mellor2000). Even though individual tax incentives cost the state in lost revenues, one study suggests that the eventual return in lower Medicaid expenditures creates a net, albeit slight, gain to the state (Cohen and Weinrobe Reference Cohen and Weinrobe2000). In two surveys conducted in 2000 and 1995, more than 80% of potential buyers reported a greater willingness to purchase long-term care insurance if their premiums were tax-deductible (DHHS 2004a). Based on an analysis of the Health and Retirement Survey, Goda (Reference Goda2011) documented a positive response in reported long-term care insurance purchases in reaction to state income tax deductions and credits for such policies.
Still, tax incentives have been viewed skeptically by many. One study has shown demand for long-term care insurance to be price inelastic, concluding that, “state initiatives that effectively subsidize premiums as a way of stimulating purchases are likely to meet with very limited success” (Cramer and Jensen Reference Cramer and Jensen2006). The National Conference of State Legislatures takes the position that, “tax incentives alone may have limited potential for significantly influencing the number of people covered by private policies” (Grooters Reference Grooters1999; see also Courtemanche and He Reference Courtemanche and He2009). Most analyses of the effectiveness of tax incentives focus on federal income tax deductibility, and conclude that there is little reason to expect deductibility expansions to increase sales of long-term care insurance (Johnson et al. Reference Johnson, Schaner, Toohey and Uccello2007; Brown and Finkelstein Reference Brown2008). Similarly, the Center on Budget and Policy Priorities (CBPP) espouses the view that long-term care premiums are so high and the tax advantages are so limited that the only people able to take advantage of the tax deductions or credits are those in high income brackets who already have purchased long-term care insurance. CBPP states that, “the primary beneficiaries of the proposed [federal] deduction [for long-term care insurance premiums] are likely to be higher income taxpayers who currently carry long-term care insurance” (Lav Reference Lav1999; see also Goda Reference Goda2011). The two most recent studies on the individual likelihood of purchasing private long-term care insurance project no Medicaid savings or a net revenue loss resulting from tax deductions or credits for such policies (Courtemanche and He Reference Courtemanche and He2009; Goda Reference Goda2011).
Theoretical design
Data collected by America’s Health Insurance Plans (AHIP, formerly the Health Insurance Association of America or HIAA) on long-term care insurance premium sales since the 1990s allows an examination of the link between state subsidies and the purchase of long-term care insurance. The Long-Term Care Insurance Market Survey conducted by AHIP/HIAA is the most comprehensive long-term care insurance data available. It covers 85% of the companies selling long-term care insurance in the United States, representing 90% of the long-term care insurance market, and was conducted in 1995, 1996, 1997, 1999, 2001 and 2002 (Coronel Reference Coronel2004). Based on state-level sales data in these research reports, it is possible to construct a measure of “market penetration” for long-term care insurance in each state (total policies in-force divided by total over-50 population). By regressing market penetration on a 0–1 indicator for whether the state provided a tax incentive in that year (each state with a substantial tax incentive is coded 1, while all other states are coded 0), it is possible to test whether there is a significant relationship between tax incentives and sales and get a very rough estimate of the magnitude of the relationship.
Of course, variation in state programmes is only part of the explanation for variation in long-term care insurance across the states. It should come as no surprise that income and assets have a substantial impact on insurance sales (DHHS 2006). In a 2005 policy brief, DHHS examined the characteristics of buyers in the new Federal Long-Term Care Insurance Programme. They found that almost 60%Footnote 3 of buyers had incomes greater than $75,000, while 54.4% had non-home assets greater than $100,000 (DHHS 2005). Income and assets vary considerably across the states and must be controlled for in a model of cross-state variation in long-term care insurance purchases. Therefore, a state’s median household income is included as a control.Footnote 4
In addition to purely pecuniary predictors, many studies have demonstrated that several key attitudes are important in predicting who will purchase long-term care insurance. For example, potential buyers are more likely to become actual buyers if they have heightened perceptions of their own risk for needing long-term care, adopt a long-term outlook on the rest of their financial planning, have personal experience with the financial and emotional hardships associated with long-term care and are less willing or able to rely on their children for long-term care (Brown et al. Reference Brown, Goda and McGarry2012).Footnote 5
It seems plausible to expect regional variation in some key determinants of long-term care insurance purchases. Even though one policy brief about the federal Long-Term Care Insurance Programme concludes that, “there are few geographic differences in the attitudes and opinions of buyers and non-buyers of the federal program regarding retirement planning and LTC” (DHHS 2004b), the brief notes that Washington, DC residents have greater experience with long-term caregiving and are more likely to have experienced financial hardship as a result of long-term care needs.
One factor that varies by region stands out as an important component of long-term care insurance: the availability and use of family support for long-term caregiving. Expectations about being cared for by one’s children have been shown to significantly predict individual long-term care insurance purchase decisions (Brown et al. Reference Brown, Goda and McGarry2012). The experiences across the states are strikingly different. In South Dakota, less than 3% of the elderly live with their relatives. But nearly 15% of Hawaii’s elderly live with their relatives. Therefore, a measure of the proportion of the elderly population living with relatives is included in the regression as a control for family support.
The expected need for long-term care is also controlled for. “Limitations on daily living” are the key criteria for Medicaid and long-term care insurance policies. Those who experience limitations on daily living probably require some form of long-term care. Again, there is significant variation across the states. In many southern states, about 40% of the over-65 population currently experiences a limitation on daily living, according to a recent National Health Interview Survey (CDC). But, only about 30% of Pennsylvanians are experiencing such limits. That factor is included in the regression as a predictor for the number of people willing to purchase long-term care insurance.
State Medicaid expenditures are matched by federal dollars in a way that plausibly induces some states to less aggressively encourage Medicaid alternatives, such as private long-term care insurance. The federal match rate (Federal Medical Assistance percentage, or FMAP) varies across states and time based on annual income estimates for states. The published rates over the time frame of this study ranged from 50% in some high-income states to more than 78% in some low-income states.Footnote 6 Those states with a higher FMAP may not take the additional steps alongside tax incentives to encourage private insurance, and this phenomenon may contaminate an estimate for the effect of tax subsidies. Consequently, there is a control for FMAP rates in each state.
Method
The dependent variable and the key independent variable take on an irregular panel structure, with one observation for each state for each of the six years 1995, 1996, 1997, 1999, 2001 and 2002. It is thus possible to conduct a simple linear regression for any of the cross-sections – one that features insurance sales as the dependent variable, tax incentives as the key independent variable and several important controls alongside. But, any one cross-sectional regression is plagued by the potential for heterogeneity/endogeneity in the sense that, if tax incentives emerge more frequently in low-sales states (which is plausible given that the tax subsidies are an inducement for a larger insurance market), then the cross-state variation will tend to indicate a negative or poor performance for tax incentives, even if the tax incentive succeeds in inducing more rapid growth in long-term care insurance sales in those states. For that matter, if the tax incentives are more likely to emerge in states with already higher than average insurance sales, any single cross-sectional regression of sales on tax subsidies will tend to overstate the impact of the subsidies, even if sales growth languishes in those states with tax incentives. This phenomenon could alternately be described as a heterogeneity or endogeneity problem.
In situations of potential heterogeneity or endogeneity, we might consider two approaches. First, any particular cross-sectional regression might be adjusted for endogeneity by identifying some instruments that cause the tax incentive to be enacted without also being related to long-term care insurance sales. Many policy studies have employed instrumental variables to address endogeneity to varying degrees of success. Besley and Case (Reference Besley and Case2000), for example, show that some generic political variables (partisanship in the state legislature, number of women in the legislature) help predict state mandates for employer payments to the workers compensation fund without being significantly related to unemployment levels in the state. But, when the state policy that requires an instrument is a small and targeted tax subsidy, and the dependent variable is a good proxy for the size of the political base demanding such a subsidy, it is difficult to imagine factors that effectively predict the enactment of the state subsidy independent from the proportion of the population eligible for the subsidy. An instrumental variables analysis is not pursued here.
When panel data are available, a second approach to addressing heterogeneity/endogeneity is available: an estimation of the regression with fixed effects for each cross-sectional unit. Such a strategy removes all but the longitudinal variation in the data, ensuring that the results are driven only by the average time series variation. This model is called the “within” regression for panel data, and is consistent in the presence of heterogeneity across the units of the type noted in the previous paragraph. It is often characterised as the adaptation of a “difference-in-differences” analysis for settings beyond a pure experimental setting with only two longitudinal waves and two cross sections.Footnote 7 In addition to inclusion of the cross-sectional fixed effects, Besley and Case (Reference Besley and Case2000) prescribe the inclusion of fixed effects for the longitudinal units in order to ensure that results are not affected by coincidental trends in the dependent and independent variables. The primary drawback to using a fixed effects panel model to eliminate endogeneity/heterogeneity concerns is that such a model requires extensive data, that is, each independent variable must vary both cross-sectionally and longitudinally or be dropped from the analysis. This second approach to estimating the effect of state tax subsidies on long-term care insurance sales is used.
Data
The research design specifies long-term care insurance sales data as a function of state tax incentives, health expectations, income and the availability of children as caregivers. In each state for the six waves of the panel, the dependent variable is the “market penetration” in the target demographic – the number of long-term care insurance policies in force at the close of the year divided by the state’s over-50 population.Footnote 8 The variable is ratio level, takes on a full panel structure and is scaled in percentage units. It is described in Table 1 and illustrated in Figure 2. Market penetration for long-term care insurance exhibits a trend of growth over the period that may be moderating, as well as very substantial variation across the states. In some states, such as Alaska, virtually no one purchases long-term care insurance for themselves. By contrast, more than 25% of the over-50 population in North Dakota has purchased such a policy.
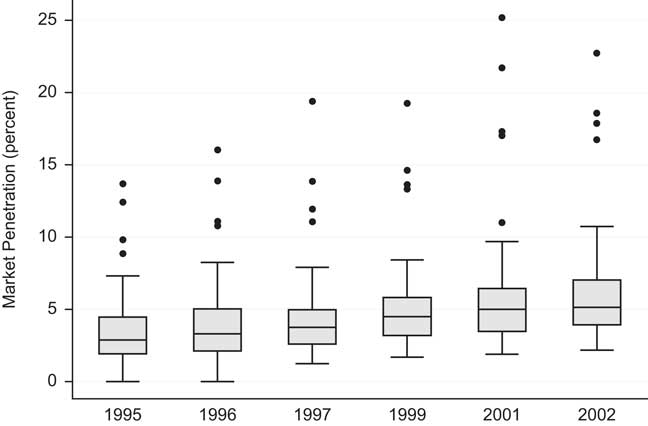
Figure 2 Longitudinal trend in LTC insurance markets.
Table 1 Descriptive statistics

Note: n=306 (51 states, 6 panel waves in 1995, 1996, 1997, 1999, 2001 and 2002)
The key independent variable (the existence of state tax incentives) is nominal and also takes on a panel structure. The basis for the state tax incentive data is contained in Table 2.Footnote 9 State tax subsidies for long-term care insurance have been erected throughout the 1990s, and this policy innovation continues to diffuse in the 2000s – five more states have established a comparable subsidy since 2002.Footnote 10
Table 2 State tax incentives for long-term care insurance, as of 2004
Note: In all cases, the value of the tax subsidy is based on an individual long-term care policy costing $1,000 per year. For all states with graduated income tax rates, the value of a tax deduction varies with income, and the figures reported here are for a person earning the median income in that state in 2006. Even some of the states with flat income tax rates or states that provide a tax credit have enacted an indexing scheme for the value of the long-term care insurance subsidy that varies with income. In those states, too, the figures reported here are for a person earning the median income in that state in 2006. Figures for lost state revenues (state fiscal cost), from Baer and O’Brien Reference Baer and O’Brien2009, are not available for every state.
The rest of the key independent variables are extremely difficult to measure in each wave of the panel. The Centers for Disease Control and Prevention provide a measure of limitations on the activities of daily living,Footnote 11 but the measure takes on only four regional values, and is publicly available only from the 2002 National Health Interview Survey (NHIS). NHIS surveys have been conducted annually since the early 1980s among more than 18,000 people, but state-level identifiers are redacted from the survey data for reasons of confidentiality.
Each of the control variables in the panel analysis is based on data from the detailed surveys of the 1990 and 2000 Census. In those surveys, it is possible to measure a state’s median household income, the percentage of a state’s elder population that has some kind of disability requiring long-term care and the percentage of a state’s elder population that lives with their children. For each of these measures, the longitudinal variation is minimal (taking on only two values for any given state – one from the 1990 Census for observations in 1995, 1996, 1997 and 1999, and one from the 2000 Census for observations in 2001 and 2002), but is sufficient for identification in the fixed effects design.
As a control for health expectations, a measure of the percentage of people over 65 in each state who experience a “self-care” limitation (e.g. to dress or bathe or get around inside the homeFootnote 12 ) is derived. For observations in the 1990s, the 1990 Census measure is applied; for observations from 2001 and 2002, the comparable 2000 Census measure is applied. A summary of the variable is described in Table 1. Between 6% and 16% of a state’s over-65 citizens has trouble caring for themselves, with low percentages experienced in the northern central Midwest (Dakotas, Wyoming) and high percentages experienced in the deep south (Alabama, Mississippi, Louisiana). The data is based on the non-institutionalised population, and is thus an underestimate of a person’s expected likelihood of needing long-term care.
The 1990 Census did not specifically track children who care for their elderly parents – what has come to be called “family caregiving”. While the 2000 Census does so, it does not distinguish family caregivers of elderly parents from family caregivers of other relatives, including disabled children. However, it is possible to identify in each state the percentage of people over 65 who live in a “family household” (i.e. with relatives) and who are neither householders nor spouses of the householder.Footnote 13 This is a plausible indicator for an elderly person’s availability of children as caregivers in each state, and it varies dramatically across the country, exhibiting very low percentages in rural states where the out-migration of children has been greatest. Those states with the largest Asian populations, such as California and Hawaii, exhibit the highest percentages of elderly living with relatives. As with self-care limitations, the 1990 Census measure of a state for all observations in the 1990s is applied, while the comparable 2000 Census measure is applied for observations from 2001 and 2002. A summary of the variable is described in Table 1.
Median household income is available in age-specific brackets only in the 2000 Census. And, even then, the available age brackets are not optimal for this dependent variable, so a generic measure of median household income is instead employed (available in both the 1990 and 2000 Census).Footnote 14 Though the fixed effects for time units obviate the need to adjust for inflation, the figures are adjusted to 2006 dollars to aid in interpretation.Footnote 15 Because the 2000 Census variable is a measure of median household income in the 1999 calendar year, the 1990 Census measure of a state for all observations in 1995, 1996 and 1997 is used. For observations from 1999, 2001 and 2002, the comparable 2000 Census measure is used. A summary of the variable is described in Table 1.
Federal Medicaid matching rates are set by DHHS each year based on an aggregate state income formula that rewards lower-income states with a higher matching rate. The floor for the federal match is set at 50%, while some states garner almost an 80% match for every Medicaid dollar spent. DHHS provides a small number of special matching rates for specific long-term care demonstration expenditures, but these exceptions are uncommon and perhaps impossible to consistently measure across all states. The official formula-based FMAP percentage is instead recorded.Footnote 16 A summary of the variable is described in Table 1.
Results
To illustrate the pitfalls of a cross-sectional analysis, consider the fairly clear evidence of endogeneity between long-term care insurance sales and state tax incentives, illustrated in Figure 3. Clearly, the states who were early to adopt tax incentives already had unusually high sales of long-term care insurance. As time wore on, the tax incentive policy diffused to states with relatively lower market penetration. As a result, there is no detectable positive trend in long-term care insurance sales among states with tax incentives, even while those states without incentives continued to enjoy a secular trend towards greater self-insurance.
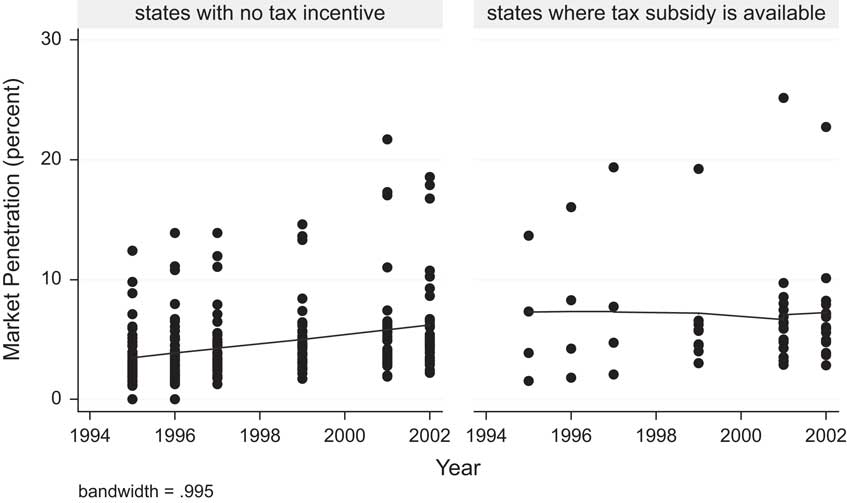
Figure 3 Evidence of endogeneity between insurance sales and state subsidies.
The strong endogeneity problem clearly contaminates cross-sectional analyses among the earlier waves of the panel. Table 3 presents the regression results for the 1995 wave. State tax credits are significantly and positively related to long-term care insurance sales, even after controlling for health expectations, income and the availability of children as caregivers.
Table 3 Cross-sectional OLS model of long-term care insurance market penetration
Note: The residuals of this regression do not exhibit significant heteroscedasticity, based on a White test (p=0.11), nor do they exhibit significant serial/spatial correlation, based on Moran’s I and employing a simple contiguity spatial weight matrix among the lower 48 states (p=0.36).
**p<.05, ***p<.01.
The results of any cross-sectional regression might be considered the “between” regression results – precisely the wrong results to consider for any given state thinking about enacting a policy. The “within” regression results appear in the full panel analysis of Table 4. Because the regression features fixed effects for cross-sections, the results for the tax incentive dummy are driven by the average increase or decrease in long-term care insurance sales between years when states enacted a tax subsidy.
Table 4 Panel OLS model of long-term care insurance market penetration
Note: Fifty fixed effects for units and five fixed effects for panels are estimated in the above regression, but not reported, for parsimony of presentation. The F-test for the homogeneity of cross-sectional effects is significant and therefore demonstrates the need to control for heterogeneity. The Hausman test for the distinction between fixed and random effects models is also significant (p=0.000***). This further demonstrates that longitudinal and cross-sectional effects are distinctive.
**p<.05, ***p<.01.
The results of Table 4 demonstrate that the impact of state tax incentives for the purchase of long-term care insurance appears negligible across the 50 “laboratories of democracy”. If tax incentives were significantly linked to sales and had a sizeable impact upon them, the tax incentive factor in the regression would appear positive, statistically significant and large. Instead, the factor is statistically insignificant and modest. It even has a negative estimated impact. Because the one-tailed p-value is about 0.08 for the negative result, an assertion can be made with 92% confidence that state tax incentives for long-term care insurance do not have a positive impact on policies sold.
These results are probably only applicable to tax incentives comparable to those already implemented in the states. As Table 2 illustrates, those incentives have been relatively modest – subsidies of no more that 25% of premiums in the most generous state, and declining to virtually nothing for the lowest income individuals in states with a tax deduction.
Replacing the variable indicating the existence of a state subsidy with one that measures the typical value of the subsidies does not alter any conclusions about the impact of tax incentives. In such a model (not shown), a state tax incentive predictor measured as the dollar value of the subsidy is not significantly related to long-term care insurance sales (p=0.89). Now, if tax incentives were beginning to have an appreciable impact on insurance sales near the upper range of generosity, there might be evidence for it in the form of a significantly positive coefficient when the squared value of the state tax incentive is included as an independent variable in the regression alongside the linear measure. The additional independent variable is not significant (p=0.82). Thus, not only is the existence of state tax incentives for long-term care insurance ineffective, there is not even any evidence for the effectiveness of the subsidies at the most generous end of the scale among the state incentives examined.
Direct estimates of the endogeneity between state tax incentives and long-term care insurance sales are not available, because a model of state enactment of long-term care insurance subsidies is beyond the scope of this project. But, the graphical evidence powerfully demonstrates that early enactors were those with the highest sales. Why do states enact subsidies? It is not too difficult to look at the evidence here and see echoes of Stigler’s (Reference Stigler1971) classic assertion that states protect or subsidise industries because the industries demand it. In this context, the demand for a subsidy probably derives from the end-users themselves. Those state populations with larger numbers of purchasers of long-term care insurance may have successfully demanded tax incentives from their state governments. The analysis does not directly estimate this phenomenon, but it does control for it in the form of cross-sectional fixed effects in the panel regression. Any cross-sectional regression necessarily ignores this endogeneity, and therefore overestimates the impact of state subsidies on long-term care insurance sales.
Sales of long-term care insurance policies are explicable across the United States, but they are not driven by state policies. Instead, factors related to financial, health and family structures drive the market. States with relatively more wealth experience significantly more long-term care insurance sales. Those states with a more limited availability of children for caregiving and in which the senior population is more likely to require long-term care experience a significantly larger market for long-term care insurance. Overall, in states where seniors are more likely to live with their children, sales of long-term care insurance are significantly lower.
Conclusion
To overcome the reluctance most individuals have to purchase long-term care insurance, more than 20 states have enacted tax-based subsidies for long-term care insurance, and several more are considering creating their own state tax incentives. These experiments have been rooted in the plausible but untested hypothesis that financial rewards and inducements would overcome market failures and help move the population toward financial self-reliance for long-term care. But, there was always a risk that the experiments would fail, because demand for long-term care insurance is price-inelastic for most consumers. Without encouragement, middle class people have proven reluctant to purchase long-term care insurance for themselves. In the absence of evidence that the programmes would work, many states took a leap of faith – faith in a simplified understanding of markets and the government’s ability to shift supply and demand at the margins.
Those tax incentives may have been well spent as a learning exercise, but they have accomplished little else. This study demonstrates in the aggregate, based on actual long-term care policy enrollment data, that tax incentives offered by states went to people who would have purchased long-term care insurance anyway. This conclusion buttresses similar conclusions in prior research based on the individual-level analysis of self-reported long-term care insurance coverage (Courtemanche and He Reference Courtemanche and He2009; Goda Reference Goda2011).
The federal government’s cancellation of the implementation of the CLASS Act in 2011 serves to illustrate the significant financial challenge of inducing individuals to purchase long-term care insurance. Because the federal government was precluded by statute from subsidising CLASS long-term care insurance policies, adverse selection meant that DHHS was unable to set a price on long-term care insurance low enough to induce sufficient enrollment to cover expected costs.
The conclusion of this paper is a micro-level assertion, and the data used in this analysis is, after all, only in the aggregate. But, it is difficult to concoct explanations for the aggregate results while still clinging to a faith in the effectiveness of these tax subsidies at the individual level. If state tax incentives are effective at the individual level, then where are all the expected insurance policies? The model in this article is able to predict the number of policies sold in any given state every bit as well, even when it completely ignores whether its residents get a subsidy.
Future research might proceed in three directions. First, scholars might turn their attention to other determinants of demand for long-term care insurance beyond costs. Existing research suggests that the limited demand for such insurance is a multifaceted problem (Brown et al. Reference Brown, Goda and McGarry2012), and it may be possible to explore whether some of those other facets are available to be addressed through public policy. Medicaid eligibility rules, insurance regulations, family and professional caregiving availability and basic consumer education have all been implicated as the components of demand for long-term care insurance that governments might seek to affect.
Second, scholars may want to investigate the methods of structuring tax incentives for long-term care insurance to make them more effective or more efficiently targeted at those less likely to purchase it. Means testing is one mechanism for doing so, but the state subsidies examined in this study are not means-tested. Indeed, almost all state subsidies for long-term care insurance are more valuable for higher income earners – precisely the kinds of people who purchase long-term care insurance even without a subsidy.
Third, researchers might examine in greater detail the value of the subsidies relative to the cost of long-term care insurance. The subsidies examined in the current study are very small relative to the total cost of insurance. But, it seems likely that, if subsidies covered a large portion of the cost, it would induce appreciable numbers of people to purchase long-term care insurance for themselves. There is no evidence so far about how generous that subsidy must be or whether such a scheme is fiscally feasible.
So far, as the evidence in this study makes clear, modest state subsidies for long-term care insurance have been a drain on state coffers and have also failed to accomplish the goal of protecting state Medicaid programmes by encouraging private self-insurance.


