


Prior to the 2010 Congressional elections, pundits and reporters at countless media outlets warned of a powerful anti-incumbent mood with the potential to send many representatives packing. In the end, however, 85% of the US House incumbents who sought reelection won—a rate only slightly lower than average.Footnote 1 Nevertheless, good media narratives die hard, and two years later reporters were still talking about an “anti-incumbent mood” persisting into 2012.Footnote 2 Some pundits even claimed a generalized preference among voters for challengers over incumbents; “undecideds usually break against the incumbent,” asserted one, without providing evidence.Footnote 3
Of course, existing political science research provides little reason to be surprised by high reelection rates. Rather, academic research shows that Congressional incumbents enjoy clear electoral advantages. But in explaining the origins of this advantage, scholars have focused almost exclusively on the structural advantages of incumbency without considering voter-level effects. That is, existing research has not typically asked whether individual voters actually like or dislike incumbents, other things being equal. Instead, existing research has (correctly) stressed that other things are not equal by showing how incumbents can use the perks of office to build their name recognition, deter strong challengers, and ultimately win more votes.
Several scholars have speculated over the years in their published work that voters might actually prefer incumbents over challengers (e.g., Ansolabehere et al. Reference Ansolabehere, Snyder and Stewart2000; Campbell and Miller Reference Campbell and Miller1957; Cover Reference Cover1977; Fatas et al. Reference Fatas, Neugebauer and Tamborero2007; Ferejohn Reference Ferejohn1977; Samuelson and Zeckhauser Reference Samuelson and Zeckhauser1988)—speculations at odds with the media narrative that voters generally oppose incumbency—but these speculations remain mostly untested. Since incumbents enjoy such great structural advantages, the best way to identify whether voters prefer (or oppose) incumbents qua incumbents is through randomized experimentation. The experimental results reported here suggest that voters react only minimally, if at all, to incumbency status.
THINKING ABOUT VOTERS AND INCUMBENTS
There is no question that Congressional incumbents enjoy profound electoral advantages. Only twice since 1976 have fewer than 90% of House incumbents who sought reelection won it.Footnote 4 Typically, incumbents win by large margins. Researchers seeking to explain these trends have generally pointed to structural factors, which can be grouped into four broad categories. First, incumbents can exploit the resources of office for electoral goals—activities that Mayhew (Reference Mayhew1974) called “advertising,” “credit claiming,” and “position taking.” These activities enable incumbents to cultivate an apolitical appeal, one that helps them remain personally popular within their respective districts even if their political party—or Congress itself—is less popular (Fenno Reference Fenno and Ornstein1975; Fiorina Reference Fiorina1977; Parker and Davidson Reference Parker and Davidson1979).
Second, incumbents enjoy a sizeable financial advantage (Cho and Gimpel Reference Cho and Gimpel2007; Jacobson Reference Jacobson2013, pp. 51–59), largely because many access-minded donors prefer to give to incumbents rather than to improbable challengers (Francia et al. Reference Francia, Green, Herrnson, Powell and Wilcox2003). Third, a “scare-off” effect enhances any other structural advantages of incumbency; the most capable challengers strategically choose not to waste their energy battling entrenched incumbents (Cox and Katz Reference Cox and Katz1996; Jacobson and Kernell Reference Jacobson and Kernell1983; Stone et al. Reference Stone, Maisel and Maestas2004). Fourth, it may simply be that incumbents are more skilled politicians than their challengers; after all, elections serve as filters that reward political competence, and one thing incumbents have in common is that they have made it through that filter at least once in the past (Ashworth and Bueno de Mesquita Reference Ashworth and Bueno de Mesquita2008; McCurly and Mondak Reference McCurly and Mondak1995; Mondak Reference Mondak1995a, Reference Mondak1995b; Zaller Reference Zaller and Geer1998).
As insightful as existing research has been, however, it has not asked what voters think about incumbents qua incumbents. Voters rarely have enough information to behave the way democratic theorists might like, but they compensate somewhat by relying on information shortcuts (Lupia and McCubbins Reference Lupia and McCubbins1998). Since partisanship and incumbency are often the only two shortcuts available on the ballot itself, we might expect voters to make use of both of these. Evidence dating back decades shows that voters use the partisanship shortcut (e.g., Campbell et al. Reference Campbell, Converse, Miller and Stokes1960), a finding that this study confirmsFootnote 5 ; the incumbency shortcut remains underexplored.
Those political scientists who have written on the topic have generally supposed that incumbency labels may work in favor of incumbents. Campbell and Miller (Reference Campbell and Miller1957, p. 305) long ago suggested that voters might prefer candidates merely because of “their designation as incumbents” on the ballot. In the midst of the Southern realignment, Ferejohn (Reference Ferejohn1977) and Cover (Reference Cover1977) supposed that declining party loyalty might render incumbency an increasingly important voting cue. Ansolabehere et al. (Reference Ansolabehere, Snyder and Stewart2000) echoed this logic, writing that “incumbency may simply act as a voting cue, a label which voters rely on because party has become less relevant.”
None of these scholars tested their suspicions, but experimental evidence from other fields lends support. For example, economists have uncovered evidence of a “status quo bias” in political decision-making generally: “People will only switch to a new policy if they strictly prefer it to the old one” (Fatas et al. Reference Fatas, Neugebauer and Tamborero2007). Faced with a choice between preserving the status quo and switching to an unknown alternative (cf. Ferejohn Reference Ferejohn1986), these experiments suggest that people will choose continuity. Similarly, Samuelson and Zeckhauser (Reference Samuelson and Zeckhauser1988, p. 8) extrapolated from their own experimental results to predict that this status quo bias could lead voters “to elect an incumbent to still another term in office.” Specifically, they conjectured that status quo bias alone could shift what might otherwise be a perfectly divided 50–50 vote into a 59–41 vote sending an incumbent back to Washington (Samuelson and Zeckhauser Reference Samuelson and Zeckhauser1988, p. 9).
Of course, incumbency might evoke a negative response from voters, especially in the case of long-term incumbents. The media narratives quoted above assume as much. Observational research has found some evidence of “incumbency fatigue” hurting the vote shares of long-time Congressional incumbents (Carson et al. Reference Carson, Jenkins, Rohde and Souva2001; Lin and Guillen Reference Lin and Guillen1999). Structural forces such as rising challenger quality contribute to this incumbency fatigue (Carson Reference Carson2005), but if media pundits are to be believed, there is also a voter-level fatigue effect.
Consider also the role of partisanship. When Gallup reported in June 2010 that only 32% of voters felt that “most members” of Congress deserved reelection, reporters quickly raised the specter of an anti-incumbent wave.Footnote 6 What they failed to note, however, was the partisan pattern among respondents. Among Republicans, only 16% felt “most members” deserved reelection; among Democrats, whose party controlled Congress, the rate rose to 53%. Apparently, voters were mentally changing the question from asking about “most members” to asking about “most majority (Democratic) members.” Surely, Gallup would have found an even wider partisan gap if it had asked separately whether “most Republican members” and “most Democratic members” deserve reelection. Because voters typically prefer candidates from their own party, regardless of incumbency status, we might expect the effects of incumbency on voter preferences to diminish when candidate partisanship is disclosed.
This discussion leads to the following three questions. We prefer the language of “questions” rather than “hypotheses” due to the relative weakness of our theoretical priors:
-
• Question 1: Do voters prefer incumbents over challengers (other things equal)?
-
• Question 2: Does lengthier incumbency render voters less supportive of incumbents?
-
• Question 3: Do any effects of incumbency diminish when each candidate's partisanship is known?
EXPERIMENTAL CONDITIONS
We already know from observational research that incumbents outperform challengers on election day.Footnote 7 Observational studies cannot disentangle the structural advantages of incumbency from voters' raw feelings about incumbency itself, but randomized experimentation can. The null hypothesis is simply that voters do not care about incumbency status, other things being equal. Whether the opposite is true has not been fully assessed. Kam and Zechmeister (Reference Kam and Zechmeister2013) recently published suggestive evidence that incumbency can serve as a shortcut, although they did not attempt to estimate its strength. A more direct test comes from Klein and Baum (Reference Klein and Baum2001), who randomly manipulated whether they informed survey respondents of candidates' partisanship and incumbency status prior to asking for their vote choice; since they worked in the context of a real election, however, it is possible that voters had this information even if the researchers did not provide it. The experiment reported here takes a different approach.
In November 2012, a nationally representative sample of 997 respondents to the online Cooperative Congressional Election Study (hereafter “CCES”) completed a simple survey experiment related to these questions. The questions were piloted three months earlier to 979 online respondents recruited from July 16–29, 2012, using Amazon's Mechanical Turk service (hereafter “MTurk”).Footnote 8 The question wording was the same in both waves. As with previous MTurk studies (Berinsky et al. Reference Berinsky, Huber and Lenz2012), the MTurk demographics differ markedly from the more representative CCES sample. (See Table A1 in the supplemental appendix.) Although neither sample is perfectly representative of American voters, they provide two large-N tests that ultimately produce the same general findings.
Respondents were presented with brief profiles of two fictional Congressional candidates, Steven Redden and Ray Kepler. The candidates were characterized as actual candidates running against each other in another state, who had purportedly had their names changed for purposes of the survey. To distract from the study's purpose, each profile contained static information about the candidate's family, career, residency, campaign, and endorsements. Respondents indicated their preferred candidate along a seven-point scale labeled “Definitely Steven Redden” at one end and “Definitely Ray Kepler” at the other. Figure 1 presents the question wording and formatting.

Figure 1 Question Wording
The candidate profiles varied randomly along two dimensions.Footnote 9 First, references to candidate partisanship varied. One group saw the partisan descriptions shown in Figure 1 (but without italics), another group saw the partisanship reversed, and the third group saw no mention of partisanship at all. Second, references to incumbency varied. Those in the control group saw no reference to incumbency. Those in the treatment groups saw a brief paragraph inserted into the middle of Kepler's profile—only Kepler's, never Redden's—characterizing him as an incumbent. To answer Question 1, the Incumbency: No length treatment read, “Kepler is the current Representative. He is seeking reelection to another term.” To answer Question 2, the Incumbency: 2 years and Incumbency: 22 years treatments read, “Kepler has served in Congress for the past (2 or 22) years. He is seeking reelection to another term.”
Respondents were randomly assigned into these three partisan conditions and four incumbency conditions, producing 12 groups. Table 1 shows the average vote choice (along the seven-point scale) and the number of respondents in each group.Footnote 10 Because assignment was random, it is unnecessary to include control variables or survey weights in the analysis that follows. Moreover, it appears the randomization “worked”; assignment to these conditions does not correlate meaningfully with respondent age, partisanship, education, or gender in either wave (see Tables A2 and A3 in the supplemental appendix).Footnote 11
Table 1 Means (and Respondents) by Treatment Group

Note: Figures shown are the mean vote choice score along the seven-point scale within each cell. Parentheses indicate the number of respondents per cell.
The difficulty with vignette experiments is that the treatment language can be so subtle that respondents fail to notice it (Mutz Reference Mutz2011, p. 84). To guard against this possibility, the MTurk pilot included a manipulation check. After indicating their preferred candidate, respondents were shown a new screen asking three factual questions about the candidates. The first question asked which candidate had spent more money on the race, the second one asked which candidate was the incumbent, and the third question asked which candidate was the Republican. Overall, 89% of respondents answered at least two of the three questions correctly, and 63% answered all three correctly. Accuracy rates were high across all experimental conditions,Footnote 12 even though respondents generally completed the survey very quickly.Footnote 13 The MTurk pilot shows that the experimental manipulations, although subtle, effectively attracted respondents' notice.
FINDINGS
The dependent variable is the respondent's preferred candidate, coded from 1 (firm support for Redden) through 7 (firm support for Kepler).Footnote 14 The incumbency treatments described above were applied only to Kepler. Thus, a positive coefficient on one of the incumbency treatment dummies indicates that respondents reacted favorably to incumbency status; a negative coefficient indicates that respondents reacted negatively to incumbency status. When assessing Question 3, we also include a dichotomous partisan condition variable indicating whether candidate partisanship was stated.
Tables 2 and 3 present four specifications, each of which is estimated three times: once on CCES, once on MTurk, and once on pooled respondents. Models 1a–1c in Table 2 provide the most direct answer to Question 1; with all incumbency treatments pooled into a single dichotomous indicator, we find no evidence that voters react to incumbency. Models 2a–2c assess Question 3 by interacting this incumbency dummy with partisan condition. Neither the incumbency dummies nor their interactions have meaningful effects.
Table 2 Effects of Incumbency on Vote Preference
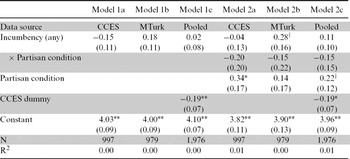
Notes: †p ≤ 0.10, *p ≤ 0.05, **p ≤ 0.01 (two-tailed).
The dependent variable is a seven-point vote choice indicator modeled using ordinary least squares. Robust standard errors are in parentheses.
Table 3 Effects of Incumbency Length on Vote Preference
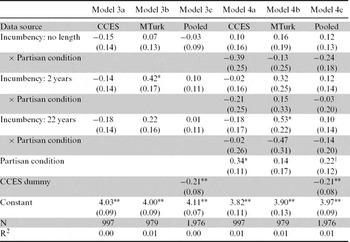
Notes: †p ≤ 0.10, *p ≤ 0.05, **p ≤ 0.01 (two-tailed).
The dependent variable is a seven-point vote choice indicator modeled using ordinary least squares. Robust standard errors are in parentheses.
Table 3 breaks out the incumbency treatments to assess Question 2. Although the 2 years treatment attains statistical significance in Model 3b, the lack of meaningful incumbency effects elsewhere in Models 3a–3c suggests this lone finding is a fluke. Moreover, the 2 years coefficient is statistically indistinguishable from the 22 years coefficient in all six models shown in Table 3, suggesting a negative answer to Question 2. Models 4a–4c add interactions with partisan condition. Again, neither the incumbency dummies nor their interactions have meaningful effects. An exception is the 22 years treatment in Model 4b, although a broader glance at Table 3 suggests that this too is a fluke.
In all 12 models, incumbency dummies (and their interactions with partisan condition) have substantively small coefficients that are usually indistinguishable from zero.Footnote 15 For perspective, consider the effect of partisanship. When Kepler is randomly assigned the respondent's partisanship, we expect the respondent's vote preference to move by 1.3 or 1.4 points along the seven-point scale (see Table A6 in the supplemental appendix). This large, unsurprising partisan effect reveals just how inconsequential are the estimated effects of incumbency.Footnote 16
Table 4 explores the data from one additional angle, considering each possible combination of respondent and candidate partisanship.Footnote 17 Each coefficient shown is the result of a separate difference-of-means test on the dependent variable; in each test, all three incumbency treatments are pooled into one treatment group and compared with the control group. This is perhaps the best overall way to identify a voter-level incumbency effect; if anything, we should see Republican respondents rewarding Republican incumbents for their longevity and despising Democratic incumbents for their resilience. Democratic respondents, of course, would do the reverse. Instead, we continue to see nothing. With 18 tests reported here, we should not be surprised that one produced a result significant at the 0.05 level. Taken as a whole, though, Table 4 offers little evidence that voters care about incumbency—not even when respondent and candidate partisanship are taken into account.
Table 4 Difference of Mean Tests By Partisan Subgroup

Notes: †p ≤ 0.10, *p ≤ 0.05, **p ≤ 0.01 (two-tailed).
Each cell reports the difference in the mean evaluation of the incumbent candidate between respondents who saw one candidate described as an incumbent (the treatment group) and respondents who did not (the control group). A positive value indicates that respondents reacted favorably to incumbency.
CONCLUSIONS
Researchers have conjectured that voters favor incumbents over challengers, even with the structural advantages of incumbency held constant (e.g., Ansolabehere et al. Reference Ansolabehere, Snyder and Stewart2000; Campbell and Miller Reference Campbell and Miller1957; Cover Reference Cover1977; Fatas et al. Reference Fatas, Neugebauer and Tamborero2007; Ferejohn Reference Ferejohn1977; Samuelson and Zeckhauser Reference Samuelson and Zeckhauser1988). Media narratives, on the other hand, often speak of incumbency as a liability, a position supported by observational evidence of “incumbency fatigue” (Carson Reference Carson2005; Carson et al. Reference Carson, Jenkins, Rohde and Souva2001; Lin and Guillen Reference Lin and Guillen1999).
The results presented here work against both propositions. Voters seem to care little whether a candidate is an incumbent, a challenger, or pursuing an open seat. No design is perfect, and this study has its limitations. It may be that 2012 was an unusual year, with a fleeting anti-incumbent mood offsetting a background pro-incumbent sentiment. It may also be that respondents behaved differently within the experimental context than they would in a real voting situation. Nevertheless, to the extent that incumbents enjoy electoral advantages, these results suggest we can credit structural factors rather than voter preferences as the source. Jacobson (Reference Jacobson2013, p. 147) was apparently correct: “Voters are not strongly attracted by incumbency per se.” Whether states choose to write the word “incumbent” on their ballot—and whether candidates choose to write “incumbent” on their yard signs—seems to have little effect on election results.
SUPPLEMENTARY MATERIAL
To view supplementary material for this paper, please visit http://dx.doi.org/10.1017/S2052263014000062.


