


Studies included in a recent review have shown that a diet rich in whole grains can reduce risk of heart disease, diabetes and weight gain( Reference Ye, Chacko and Chou 1 ). The 2010 Dietary Guidelines for Americans call for a reduction in the number of servings of refined grains and consumption of at least half of total grains as whole grains( 2 ). However, 2009–2010 National Health and Nutrition Examination Survey (NHANES) data show that only 2·9 % of children/adolescents (2–18 years) consume the recommended three daily whole grain ounce-equivalents, while 38·8 % consume no whole grains( Reference Reicks, Jonnalagadda and Albertson 3 ).
Pizza is a popular food commonly consumed by children and adolescents. On any given day, 22 % of US children aged 6–11 years and adolescents aged 12–19 years consume pizza according to NHANES data (2007–2010)( Reference Rhodes, Adler and Clemens 4 ). Pizza is offered in 36 % and 40 % of middle- and high-school menus, respectively, based on a specified target week among schools participating in the US National School Lunch Program( Reference Condon, Crepinsek and Fox 5 ). However, NHANES 2009–2010 data show that the food category of grain mixtures, which includes pizza crust, accounts for only 3 % of the total whole-grain intake among children and adolescents( Reference Reicks, Jonnalagadda and Albertson 3 ). Flour made from white whole wheat can replace refined or red whole-wheat flour in many applications. White whole wheat has the pale hue and mild flavour of refined grain because it lacks a gene for bran colour( 6 ). An earlier study among US elementary-school children showed that consumption of pizza with crust containing white whole-grain flour was the same as pizza with crust containing refined-grain flour( Reference Chan, Vickers and Marquart 7 ).
A large proportion of daily energy intake (33 %) is consumed away from home according to US NHANES 2005–2008 data, and foods consumed away from home are less likely to be whole grain compared with foods consumed at home (0·43 v. 0·09 ounces per 4186·8 kJ)( Reference Lin and Morrison 8 ). Although substituting whole-grain for refined-grain flour is a successful approach for several grain products in schools, including pizza( Reference Chan, Vickers and Marquart 7 , Reference Chu, Warren and Sceets 9 , Reference Toma, Omary and Marquart 10 ), to date no studies have determined if similar results can be achieved in a restaurant setting. Therefore, the purpose of the present study was to test whether plate waste and liking differed for pizza made with whole-grain compared with refined-grain crust among children in restaurant and school settings.
Experimental methods
Pizza crust formulations were developed by Executive Chefs at Green Mill (a Midwest US restaurant chain) and ConAgra Foods, Inc. The flour in the whole-grain crust was a blend of hard white winter, whole-wheat flour (55 %; Ultragrain; ConAgra Mills, Omaha, NE, USA) and hard red winter, refined-wheat flour (45 %). The flour in the refined-grain crust was hard red winter, refined wheat flour only (100 %). The pizza was the same serving size as an individual adult pizza served in this chain (approximately 10 inches in diameter and 350–400 g). The whole-grain and refined-grain crusts contained 6·7 g and 2·5 g of dietary fibre per serving, respectively, based on a nutritional analysis of similar products( 11 ). The same crust formulations were used in the restaurant and school settings.
Participants
Participants in the school setting included 3rd–5th graders from one elementary school in the Minneapolis, Minnesota metropolitan area who rated liking for the pizza products in April 2013. This age group (8–11 years) was asked to participate because older children have been more effective at differentiating between product samples( Reference Kroll 12 ). The school had 405 students in kindergarten–6th grade, of whom 45 % were white, 25 % were Asian and 30 % were African American, Hispanic and American Indian. Pizza plate waste data were collected in the restaurant setting from participants consuming pizza at one of five Green Mill restaurant locations in the Minneapolis/St. Paul metropolitan area between August 2012 and March 2013. The study was conducted according to the guidelines laid down in the Declaration of Helsinki and all procedures involving human subjects were approved by the University of Minnesota Institutional Review Board. In the school setting, parents provided written consent and children provided written assent. Consent and assent were not obtained in the restaurant setting, as this part of the study was exempted by the same Institutional Review Board as observations of public behaviour.
School procedures
Children (n 131) were asked to rate their liking of two samples of cheese pizza, one with whole-grain crust and one with refined-grain crust. Children rated their liking of each on a 5-point hedonic scale with descriptors ranging from 1=‘dislike a lot’ to 5=‘like a lot’( Reference Popper and Kroll 13 ). Samples and rating forms were randomized so that some children tasted the whole-grain crust first while others tasted the refined-grain crust first. Eleven forms were eliminated due to incomplete or illegible data, leaving 120 complete responses.
Restaurant procedures
Child restaurant patrons consuming pizza made with whole-grain or refined-grain crust were observed by one of six trained observers. Observers attempted to observe all children who appeared to be 3–13 years of age several evenings per week over an 8-month period in five restaurant locations. Children were accompanied by parents and/or other adults and were unaware they were being observed. No identifying data were collected, although observers recorded the child’s gender and approximate age.
Observers recorded the date, time, restaurant location, pizza crust type, number of children and adults at the table, number and type(s) of children’s pizza(s) ordered, other foods eaten by the child, whether the pizza was shared, the percentage of meal time the child was observed and the overall percentage of pizza crust not eaten by the child (percentage waste). An observation form was developed and tested in simulated and actual restaurant settings to record percentage waste (Fig. 1). To estimate percentage waste, observers shaded the portion of uneaten pizza remaining on children’s plates on a pizza-shaped diagram (Fig. 1). Intra- and inter-observer reliability was assessed in a simulated environment. Agreement was defined as the estimated percentage waste per pizza falling within 10 % for all observers. The number of pizzas with percentage waste agreement was divided by the total number of pizzas observed at each session. Mean inter-observer reliability for three sessions was 0·86. Intra-observer reliability was calculated similarly, with each person observing the same pizza twice within each session. Mean intra-observer reliability was 1·0. Observed estimates were highly correlated (r=0·88) with weighed plate waste.
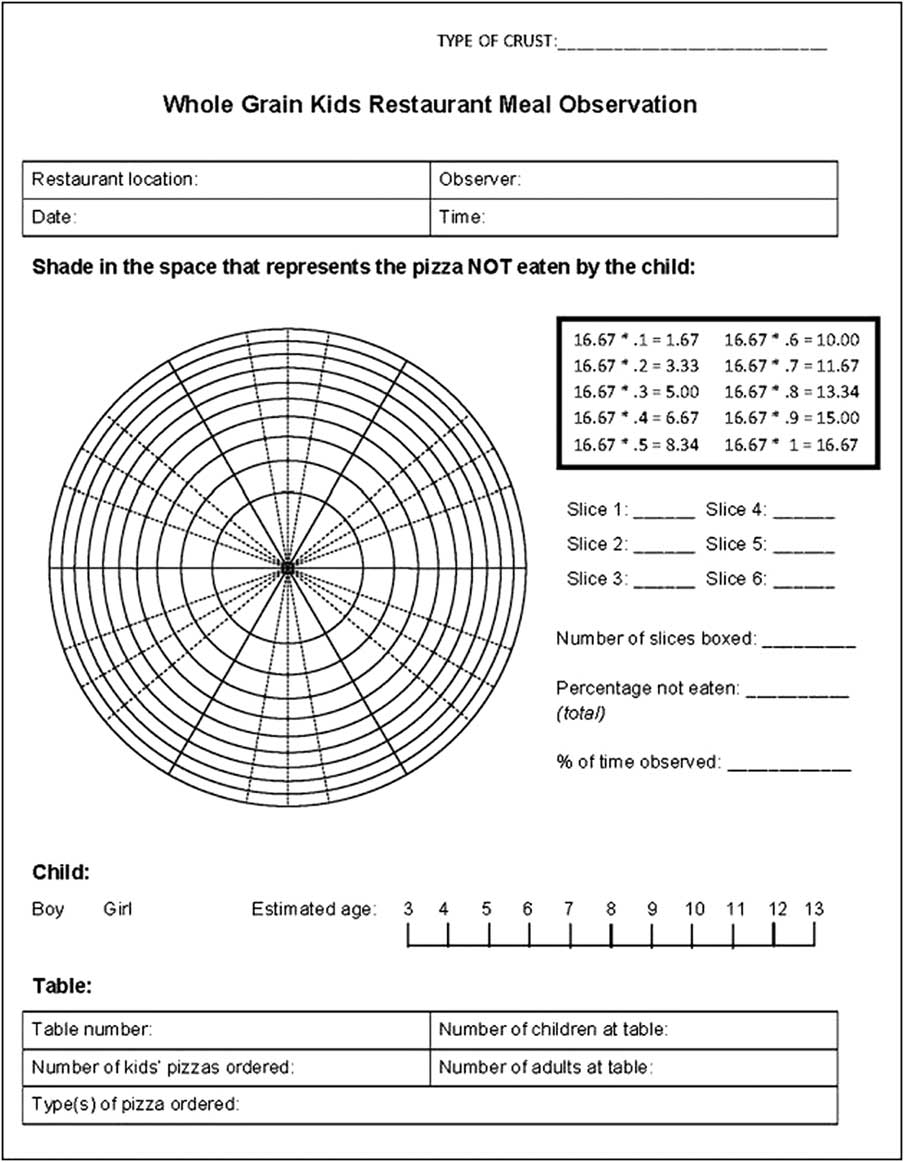
Fig. 1 The observation form developed to record percentage waste in restaurant settings
Statistical analyses
Data were analysed using the SAS statistical software package version 9·3, with comparisons made at α=0·05. For the taste test, liking ratings were compared across the two types of pizza crust using paired t tests and within grade, age and gender groups using ANOVA or t tests. For observation of pizza consumption, t tests were used for continuous variables and χ 2 tests for categorical variables. PROC GLM was used to assess differences in percentage waste (dependent variable) by crust type (independent variable). Because significant differences were observed in the number of children who consumed whole-grain and refined-grain pizza crust by gender, pizza toppings and ‘shared consumption’ (yes or no), these variables were also included in the model.
Results
In the school setting, 27·5 %, 34·2 % and 38·3 % were in the 3rd, 4th and 5th grades, respectively. Slightly less than half were girls (49·2 %). The mean liking ratings for pizza made with whole-grain and refined-grain crust were 4·5 (sd 0·9) and 4·6 (sd 0·8), respectively, and were not significantly different (P=0·47). No significant differences were observed in liking ratings when children were grouped by age, grade or gender.
In the restaurant setting (Table 1), 194 and 200 children were observed eating pizza with refined-grain and whole-grain crust, respectively, with a mean estimated age of 6·9 years and 7·0 years. No differences were observed in the mean number of children or adults at the table by crust type (2·2 v. 2·3 children and 2·5 v. 2.6 adults) or the mean number of children’s pizzas ordered (1·5 v. 1·7 pizzas). Most pizzas had cheese (n 209) or pepperoni (n 95) as the only topping. Observers watched tables during approximately 63 % or 67 % of the meal time for refined- and whole-grain crust type, respectively. This was dependent upon the location of the table within the restaurant and the number of other tables being observed.
Table 1 Observation data by pizza crust type among child restaurant patrons in five Green Mill restaurant (a Midwest US chain) locations in the Minneapolis/St. Paul metropolitan area, Minnesota over an 8-month period, August 2012–March 2013
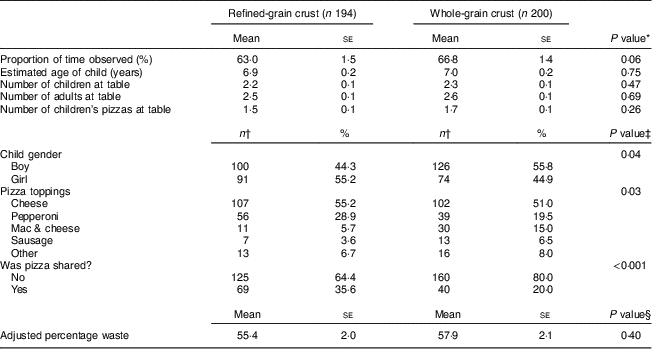
*P values are based on t tests (significance level: P<0·05).
†Where percentage does not sum to 100, data are missing.
‡P values are based on χ 2 tests (significance level: P<0·05).
§According to PROC GLM (significance level: P<0·05), adjusted for child gender, pizza type and whether the pizza was shared.
Child gender, type of pizza toppings and whether the pizza was shared were significantly different between the two groups (Table 1). More boys and fewer girls consumed the pizza made with whole-grain crust than the refined-grain crust. Pizzas with refined-grain crusts were more likely to be topped with pepperoni than pizzas with whole-grain crust. Children were less likely to share pizza made with whole-grain compared with the refined-grain crust. After adjusting for gender, whether the pizza was shared and differences in pizza toppings, the mean percentage waste did not differ significantly for children consuming the pizza made with refined-grain crust (55·4 %) v. the whole-grain crust (57·9 %). Children ate slightly less than half of the pizzas made with either type of crust. The adjusted model also showed that the type of topping affected the amount of waste, but only for sausage pizzas (P=0·02).
Discussion
Both liking and plate waste data showed that children consumed pizza made with refined-grain or whole-grain crust in equal amounts. These results support previous work in schools with pizza crust made with white whole-wheat flour( Reference Chan, Vickers and Marquart 7 ) and other whole-grain products made with white whole-wheat and barley flours( Reference Toma, Omary and Marquart 10 ). Similar findings were also observed by Chu et al. testing whole-grain tortillas and pancakes from the US Department of Agriculture Commodity Food Program in schools in two states( Reference Chu, Warren and Sceets 9 ). The foods other than pizza crust tested in these studies are also frequently served in restaurants to children and present opportunities for future research on acceptance.
Acceptance of the pizza crust made with whole-grain flour in restaurants in the current study and in schools in a previous study( Reference Chan, Vickers and Marquart 7 ) has implications for food-service personnel planning meals to meet school meal regulations for including whole-grain foods( 14 ). The new guidance for US schools requires that foods meeting the whole grain-rich criteria may contain a blend of whole-grain flour and enriched flour where at least 50 % is whole grain. Therefore the formulation of the whole-grain pizza crust tested in the current study conforms with the school meal regulations; however, the size was larger than recommended for use in schools. The pale colour and mild flavour of the white whole-wheat flour used in the current study may have contributed to the lack of difference in acceptance of the two types of pizza crust. Use of white whole-wheat flour represents a solution for food-service personnel concerned that the dark colour and bitter flavour of whole-grain foods will cause these foods to be rejected by students.
Introducing whole grains through a familiar and well-liked product was apparently successful in overcoming children’s barriers to consumption. However, the portion size of the children’s pizzas in the present study was extremely large (350–400 g) because the restaurant chain uses the same size dough ball for its children’s pizzas and individual adult pizzas. Although children consumed less than half of the pizza on average (44·5 %), the large serving size could have predisposed them to consume more of the pizza than they normally would have, as seen in a previous study( Reference Ramsay, Safaii and Croschere 15 ). Children in the current study would have consumed a full serving of whole grains and 3 g of dietary fibre by eating 44·5 % of the pizza with the whole-grain crust. The study should be repeated with a smaller serving size to verify that consumption of whole grains remains similar even if the serving size is reduced.
The strengths of the present study are in its novelty and potential application. Little information is available about restaurants as a potential site for increasing whole-grain intake among children. Further, the observations were conducted in a manner that preserved the integrity of the restaurant environment, ensuring authenticity in the eating behaviours observed. The tool developed in conjunction with the observation protocol was effective in allowing observers to quickly and easily record waste data. Limitations were related to conducting research in a restaurant environment. Observations were used to record plate waste v. actual weight of waste. However, observers were well-trained according to intra- and inter-observer reliability within a simulated setting. Observers were unable to observe children 100 % of the time and therefore may have occasionally missed or misreported pizza that was shared, dropped or discarded; however, observers were able to note that 36 % of refined-grain and 20 % of whole-grain pizzas were shared. Lastly, the study was conducted in the Midwestern USA within a chain of several sit-down pizza restaurants, which may limit its generalizability to other locations and other types of restaurant.
The outcomes of the present study could serve as the foundation for future work with large, national restaurant chains. Pizza is an ideal example of a food that benefits substantially from reformulation, but others exist. Hamburger buns, tortillas, pastas, rice and even breading on chicken tenders/nuggets could be redesigned in restaurants to include whole grains. These products are currently available for use in schools and could easily be adapted for use in restaurants. Future studies could focus on large organizations or small, independent businesses; each type of restaurant will present unique challenges and opportunities for intervention.
Acknowledgements
Acknowledgements: The authors would like to acknowledge Jon Schmig for his assistance in designing the observation tool used for data collection. Financial support: ConAgra Mills, Inc. assisted in the formulation of the pizza crust and provided the flour for the whole-grain crust, but had no role in the design, analysis or writing of this article. Conflict of interest: None. Authorship: All authors were involved in the conception and design, data collection and interpretation. A.T. and M.R. conducted the statistical analysis. A.T. drafted the manuscript. M.R. and L.M. provided critical revision of the manuscript. L.M. obtained funding and provided administrative and technical support. M.R. and L.M. provided supervision. Ethics of human subject participation: The study conducted in the school setting was approved by the University of Minnesota Institutional Review Board and the study conducted in restaurant settings was considered exempt from committee review by the same Institutional Review Board.


