The justification for studying faculty research productivity is that it affects individual advancement and reputation within academe, as well as departmental and institutional prestige (Creamer Reference Creamer1998, iii). Publication records are an important factor in faculty performance evaluations, research grant awards, and promotion and salary decisions. The phrase “publish or perish” encapsulates the importance of research productivity to academic careers. In addition, questions are sometimes raised about whether an individual's status as a minority within academia (e.g., being a member of an underrepresented ethnic or racial group or being female in a male-dominated profession) affects his or her ability to publish or likelihood of publishing (Cole and Zuckerman Reference Cole and Zuckerman1984; Bellas and Toutkoushian Reference Bellas and Toutkoushian1999). Finally, most previous work that tackles the productivity causality puzzle comes from disciplines other than political science.Footnote 1 Thus, one of the purposes of this report is to explore whether the existing findings about research productivity in other disciplines apply equally well to research productivity in political science.Footnote 2
The question that we wish to answer is: What factors contribute to higher or lower research output by political scientists? We base our answer on responses to a 2009 survey sponsored by the APSA. Respondents were drawn from a sample of all faculty employed in political science departments (including departments of government and public affairs) throughout the United States. (Appendix A provides a description of the survey methodology.)
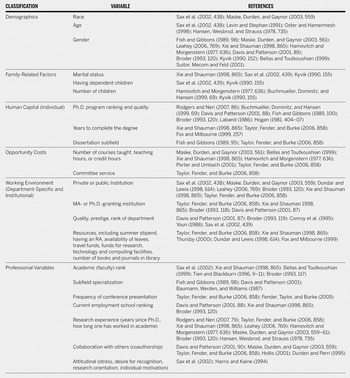
According to previous studies, several blocks of variables determine scholarly productivity. These variables include demographics and family-related factors, human capital, opportunity costs (teaching and service workload), working environment, and professional variables (table 1). Among the demographic variables listed in table 1, gender differences have received special attention. Numerous studies have revealed that women publish less than men (Fish and Gibbons Reference Fish and Gibbons1989; McDowell and Smith Reference McDowell and Smith1992; Broder Reference Broder1993, 123; Bellas and Toutkoushian Reference Bellas and Toutkoushian1999; Sax et al. Reference Sax, Hagedorn, Arredondo and Dicrisi2002; Maske, Durden, and Gaynor Reference Maske, Durden and Gaynor2003, 561; Taylor, Fender, and Burke Reference Taylor, Fender and Burke2006; Evans and Bucy Reference Evans and Bucy2010). This finding, however, remains controversial: Davis and Patterson (Reference Davis and Patterson2001, 89) argue that women do not publish significantly less than men when source of Ph.D., type of employer, and field of specialization are held constant.
Table 1 References for Explanatory Variables for Scholarly Productivity

The second category of variables found in table 1 concern “human capital.”Footnote 3 Human capital addresses any contextual or individual attributes that could potentially influence the quality of an individual's research skills or training. The professional reputation of an academic's Ph.D.-granting department is consistently tied to differences in research productivity (Hansen, Weisbrod, and Strauss Reference Hansen, Weisbrod and Strauss1978; Davis and Patterson Reference Davis and Patterson2001, 88; Broder Reference Broder1993; Buchmueller, Dominitz, and Hansen Reference Buchmueller, Dominitz and Hansen1999, 71). The assumption is that top-rated schools attract the best students and then provide them with training at the frontiers of the discipline and socialization into a culture that values high-quality research (Rodgers and Neri Reference Rodgers and Neri2007, 76).
“Opportunity cost” variables capture the time spent teaching or doing service. Given the limited amounts of time that faculty have, teaching or administrative requirements set by the employing institution may affect faculty research productivity (Fender, Taylor, and Burke Reference Fender, Taylor and Burke2005; Taylor, Fender, and Burke Reference Taylor, Fender and Burke2006; Maske, Durden, and Gaynor Reference Maske, Durden and Gaynor2003). Studies consistently reveal that a large teaching load significantly reduces published output (Graves, Marchand, and Thompson Reference Graves, Marchand and Thompson1982).Footnote 4
The category of “current working environment”—both its culture and its availability of resources—captures primarily departmental and institutional characteristics. Broader availability of resources and incentives for publishing should influence publication rates (see table 1).Footnote 5 “Culture” relates to shared attitudes about not only the value of research, but also collegiality and interpersonal encouragement. Each academic's own research productivity is affected by the productivity of his or her departmental colleagues through “collaboration, academic discourse, peer expectations [and] peer pressure” or through colleagues' other attributes, such as “ability, integrity [and] professionalism” (Rodgers and Neri Reference Rodgers and Neri2007, 85; see also Taylor, Fender, and Burke Reference Taylor, Fender and Burke2006).
As a category that is distinct from the working environment, we also consider “professional variables,” which include the achievements of an individual's academic career. For example, scholarly productivity has been associated with the ranking of the program with which an individual is affiliated (Davis and Patterson Reference Davis and Patterson2001, 88; Xie and Shauman Reference Xie and Shauman1998, 865; Garand and Graddy Reference Garand and Graddy1999; McCormick and Rice Reference McCormick and Rice2001; Youn Reference Youn, Breneman and Youn1988). It may be that higher ranked departments select better scientists, or perhaps these departments foster greater productivity (Broder Reference Broder1993, 116).Footnote 6 Arguably, faculty research productivity also varies according to the researcher's specific subject matter (Fish and Gibbons Reference Fish and Gibbons1989, 98).
Faculty rank (instructor/lecturer, assistant professor, associate professor, full professor) is considered a professional variable. Some researchers find rank to be a predictor of productivity (Blackburn, Behymer, and Hall Reference Blackburn, Behymer and Hall1978; Bellas and Toutkoushian Reference Bellas and Toutkoushian1999; Dundar and Lewis Reference Dundar and Lewis1998; Sax et al. Reference Sax, Hagedorn, Arredondo and Dicrisi2002; Xie and Shauman Reference Xie and Shauman1998, 865), while others have shown that rank has no influence on faculty research productivity when other relevant variables are taken into consideration (Over Reference Over1982; Wanner, Lewis, and Gregorio Reference Wanner, Lewis and Gregorio1981).Footnote 7 Also categorized under professional variables is coauthorship, which is thought to “increase article production through the division of labor made necessary by increased complexity in the subject matter and by the need to saturate markets to increase the probability of getting papers accepted for publication” (Maske, Durden, and Gaynor Reference Maske, Durden and Gaynor2003, 555, 561; see also Hollis Reference Hollis2001; Durden and Perri Reference Durden and Perri1995; Davis and Patterson Reference Davis and Patterson2001, 90; Taylor, Fender, and Burke Reference Taylor, Fender and Burke2006).
The theories behind the explanations for variation in research productivity are nearly as varied as the factors studied. Behavioral reinforcement theory views the “system of faculty ranks as a reward system as well as a schedule of reinforcement” (Tien and Blackburn Reference Tien and Blackburn1996, 5). A similar idea is proposed by the investment-motivated model of scientific productivity, which argues that “scientists engage in research because of the future financial rewards associated with the activity” (Levin and Stephan Reference Levin and Stephan1991, 115). Such a model implies a decline in research productivity over the course of an individual's career, given the finite time horizon (Diamond Reference Diamond1984). Rodgers and Neri (Reference Rodgers and Neri2007, 79) report that the most productive period is the first five years after the Ph.D. is conferred, and Davis and Patterson (Reference Davis and Patterson2001) report that productivity generally declines after tenure.
In contrast, a consumption-motivated model that stresses the “scientist's fascination with the research puzzle itself” (Levin and Stephan Reference Levin and Stephan1991, 115) does not predict a decline in research productivity over time. Likewise, selection theory (Finkelstein Reference Finkelstein1984) argues that only the most productive faculty members are promoted, eliminating low producers before they reach higher ranks and thus creating a situation in which higher ranking faculty produce more. Accumulative advantage theory emphasizes the importance of resource acquisition over time (Allison and Stewart Reference Allison and Stewart1974). Motivational theory draws an important distinction between intrinsic motivation (e.g., interest in research) and extrinsic motivation (e.g., desire for promotion). Intrinsic motivation may account for the continued productivity of full professors, who are no longer motivated by the possibility of promotion (Finkelstein Reference Finkelstein1984, 101).
Thus, theoretical approaches to the productivity question vary, as do the factors that predict faculty research productivity. The dependent variable (productivity, or research output) can also be evaluated in a variety of ways. In our analysis of scholarly productivity, we use as our dependent variable the respondent's best estimate of the total number of articles that he or she has published in refereed academic or professional journals over his or her entire career.Footnote 8 We also look at a summary measure that includes refereed journal articles, books, edited books, and book chapters. Finally, we create a model that uses books and book chapters published as controls when evaluating the total number of articles published. (See appendix A for a description of all variables included in the analyses.)
Descriptive Statistics
Before we embark on the multivariate analyses, we first provide descriptive statistics. Across the entire set of 1,399 respondents, the average number of articles published in refereed academic or professional journals during the respondent's entire career is 10.5. In table 2, we divide our sample into groups of men and women and compare their publication rates. On average, men publish significantly more articles than women do. We wish to note that this bivariate calculation does not control for age. The average age of women in the profession is lower than the average age for men in the profession. Thus, on average, men in the profession have more years of publishing time (based on age) than have women.Footnote 9
Table 2 Average Number of Articles Published by Subgroup

Notes. For all, p < .000.
a Percentages exclude one transgendered respondent.
b Percentages do not add to 100% because of the exclusion of respondents from Tier IV, unranked, and unknown departments.
c Percentages do not add to 100% because of the exclusion of respondents from departments within a two-year college and respondents without a program type specified.
d Percentages do not add to 100% because of the exclusion of instructors, lecturers, postdocs, fellows, and respondents without a rank specified.
Turning to human capital variables, table 2 shows that the average number of articles published during an individual's career is significantly higher among graduates from departments ranked among the top 25 (tier I schools) than among graduates from departments ranked 26–50 (tier II) and departments classified as tier III using the Schmidt and Chingos ranking (Reference Schmidt and Chingos2007).Footnote 10 Thus, the ranking of an academic's Ph.D.-granting department is bivariately tied to differences in research productivity.
Looking at the opportunity cost variables, we asked respondents to report their typical teaching load each year (for the past five years). Across all respondents, the average number of courses taught is 4.3 per year. For purposes of a simple descriptive picture, we divided respondents into three groups: faculty with low teaching loads (2.5 courses or less per year), medium teaching loads (3 to 5.5 courses per year), and high teaching loads (6 or more courses per year). On average, faculty members with the lowest teaching loads publish 14.5 articles, while individuals with heavy teaching loads publish 4.9 articles (see table 2). These numbers reveal a major difference in research output depending on how many courses a faculty member teaches.
The last two variables that we considered in table 2 are associated with working environment and professional achievement. Looking at the “current employment” rows, we can see that faculty who are employed by Ph.D.-granting departments publish dramatically more than faculty who are employed by MA-granting programs or departments in a four-year college. The numbers in table 2 also illustrate the effect of the professional achievement variables by highlighting the difference in the number of articles published by members of different professional ranks. On average, assistant professors have published 3.6 articles, while full professors have published 18.6 articles.
Analysis
In running OLS regressions in our multivariate analysis, we employed three different versions of the dependent variable. The first simply used the respondent's raw report of the total number of articles published in refereed academic or professional journals over his or her entire career. The second approach replaced missing responses to this question with the value of zero. The third approach followed a recommendation by Fox and Milbourne (Reference Fox and Milbourne1999, 256) that the number of articles published be transformed as the logarithm of one plus the original variable, with missing responses replaced with zero. This helps deal with a concentration of observations at zero and makes the distribution more closely approximate a normal distribution.Footnote 11 The tables that we publish here all use the logarithmic transformation of the number of articles produced as the dependent variable. Analyses using the other two versions of the dependent variable are consistent with the findings reported here and are available from the authors upon request.
Table 3 reports regression results using the logarithm of one plus the number of articles published (with missing responses replaced with zero) as the dependent variable. Model I of table 3 contains only demographic and family-related factors.Footnote 12 These factors explain 5% of the variation in the (log of the) number of articles produced. Two variables emerge as significant predictors: gender and number of children. According to this simple demographic model, women tend to publish less than men. Additionally, as the number of children that an individual has increases, so does the number of articles that he or she publishes.
Table 3 Log of Articles as Dependent Variable, Based on Original Responses, with Missing Responses to Predictor Variables Excluded

Note.
*** p < .001,
** p < .01,
* p < .05
Model II of table 3 incorporates the measures of human capital. Both Ph.D. program rank and number of years to complete the Ph.D. are significant. As the ranking of the program from which a faculty member received his or her Ph.D. improves, the number of articles this individual publishes increases.Footnote 13 As the number of years to complete the doctoral degree increases, the number of articles published decreases.
The problem that appears in table 3, however, concerns Model I's loss of a large number of respondents because they neglected to report their number of children. The introduction of additional variables in Model II results in a further loss of 225 other cases. This loss occurs in part because 141 respondents did not identify the institution from which they received their Ph.D.; this prevents us from using the 2007 Schmidt and Chingos ranking variable for these respondents. The more significant missing value problem arises with the question: “In what year did you obtain your Ph.D. degree?” Within our sample, 273 respondents either did not answer or made a mistake when typing in a year. Given this missing data problem, we decided to use the multiple-imputation Amelia II program for missing data (Honaker, King, and Blackwell Reference Honaker, King and Blackwell2010).Footnote 14 We used this program to impute estimates of the missing responses on each of the independent variables used in the analysis. The purpose of this approach was to increase the number of observations taken into consideration in the analysis.
Table 3.1 reports the testing of exactly the same models as are tested in table 3, but using the imputed data and holding the number of cases in the analysis at 1,399 for all models. As in table 3, both human capital variables are significant in Model II of table 3.1. When using the imputed data, it is noteworthy that the significant demographics include “married.” Thus, table 3.1 reveals that women tend to publish fewer articles than men, while married and partnered persons publish more than single, divorced, or widowed academics.
Table 3.1 Log of Articles as Dependent Variable (Regressions with Imputed Data)

Note.
*** p < .001,
** p < .01,
* p < .05
In Model III of table 3, we add in the controls that we label opportunity costs: teaching load, number of new courses prepared, number of committee memberships, number of committees chaired, and amount of student advising. In this model, we jump to 29% of the variance explained in table 3 (Model III) but lose another 108 cases. According to these results, heavy teaching loads do take their toll on article production. In addition, the larger the number of new courses prepared, the lower the number of articles published. We also find, rather unexpectedly, that the more committees an individual chairs and the more advisees he or she has, the more he or she publishes.
When all respondents are considered and missing values are replaced by imputed data, the strong relationship between a higher teaching load and lower article production is confirmed, as is the negative relationship between new course preparation and article production (Model III in table 3.1). The overall count of advisees is again positively related to the number of articles published. To explain the findings regarding committees and advising, it may be wise to interpret both as measures of professional involvement rather than opportunity costs. It appears that we misclassified advising and committee service as opportunity costs, given that when these variables are significant, they appear to support rather than detract from article production. We return to this finding in our discussion section.
Model IV includes the working environment variables: collegial climate; count of overall resources; and current employment in a Ph.D. program, MA program, or private institution. Model IV in table 3 reveals that more positive evaluations of a department's “climate” are related to fewer articles published. Faculty members who evaluate their environment as more friendly, respectful, collegial, collaborative, and cooperative publish less, on average, than faculty who evaluate their home department as more hostile, disrespectful, contentious, individualistic, and competitive. This relationship emerges even more powerfully in the imputed data (Model IV, table 3.1).Footnote 15 The negative association between departmental collegiality and research productivity is affirmed in the tables that follow. We must accept the finding that faculty members who operate in the more competitive, individualistic, and hostile departments publish more on average. The defining element of this scale is the collegial versus contentious contrast, with collegiality associated with lower total publications and contention associated with a higher number of publications.
We also see from the test of Model IV (in table 3 and table 3.1) that more resources are associated with an increase in the number of articles published. The dummy variable for employment in a Ph.D.-granting department is also significant. Table 3 and table 3.1 show contradictory results regarding whether faculty members in private institutions tend to publish more than faculty members in public institutions. Table 3.1's finding that faculty members employed in private rather than public institutions tend to publish more is consistent throughout the analyses using imputed values for missing responses (and therefore based on the largest possible number of respondents). Note that with Model IV, we can now explain 41% of the variance in the number of articles published (see table 3.1).Footnote 16
The last model that we report in tables 3 and 3.1 includes the following professional variables: current faculty rank, a series of dummy variables for current primary field of teaching and research, year the Ph.D. was granted, coauthorship, frequency of conference attendance, and the ranking of the department that currently employs the faculty member. This final model is extremely powerful; it explains 44% of the variance in the number of articles published.Footnote 17 Model V in tables 3 and 3.1 shows that as an individual moves up the academic ranks, the total number of articles published in his or her career also increases.Footnote 18 We do not find evidence that faculty members in any subfield publish significantly more than faculty members in another subfield.Footnote 19 We do find that as more time passes since the granting of the degree, the number of articles published increases.Footnote 20 Increased conference attendance is also positively related to greater article output (see tables 3 and 3.1).
We also tested Models III, IV, and V after adding the total number of books written or edited and book chapters published as a control. Our findings confirm the results of Maske, Durden, and Gaynor (Reference Maske, Durden and Gaynor2003, 561), who report a significant positive relationship between books published and articles published. Among our respondents, the bivariate correlation between the number of articles published and the total number of books, edited books, and book chapters is .640. The correlation between the number of articles published and the number of books published is .593. A higher number of books, edited books, and book chapters is positively associated with a higher number of articles published. Thus, the activities are clearly complementary and do not detract from each other; rather, they reinforce each other.
In a related vein, we thought it valuable to report on a different approach to measuring research output. As an alternate dependent variable, we evaluate the total number of publications. To create a total publications variable, we add together responses to four questions: (1) number of articles published in refereed academic or professional journals, (2) number of monographs (books) published, (3) number of books edited, and (4) number of book chapters published. For the results presented in table 4, missing responses to all questions are set to zero and the responses are summed (the value of one is added to the sum before the log is calculated). To save space, we do not present the results for Models I, III, and IV, and for Model II, we report only the results using the data file created by Amelia, with missing responses on the independent variables replaced with imputed values.
Table 4 Log of Total Productivity as Dependent Variable

Note.
*** p < .001,
** p < .01,
* p < .05
For Model V of Table 4, we report results using the imputed data files created by Amelia, as well as results using the log of total productivity (plus one) as the dependent variable and allowing missing cases to be deleted from the analysis. If we focus on Model V of Table 4, which controls for human capital, opportunity costs, and important characteristics such as faculty rank, we see that women on average report lower total publications than men. Being a minority and having children are significant when using the imputed data, but when missing values are dropped from the analysis, these characteristics are not significantly related to overall total output.
According to table 4, the longer the time an individual spends earning the Ph.D., the lower his or her number of total publications. When opportunity costs are considered, we see that the more courses that are taught, the lower a faculty member's total number of publications. The results using imputed values to replace missing responses also reveal a strong relationship between more advisees and more publications. Among the working environment variables, the total number of publications tends to be lower when the department's collegiality is high. The total number of publications is higher among those faculty members who report receiving more of the following resources: course release time, research assistance time, discretionary funds, travel funds, and summer salary. Consistently significant predictors of total productivity among the professional variables are higher faculty rank, year of degree (i.e., more time since finishing the doctoral degree), and conference attendance.
Since promotion to a higher rank and the total number of publications are inextricably combined in academia, we thought it important to divide our sample into subgroups based on academic rank and evaluate the factors that predict different levels of productivity within each rank. Acknowledging that full, associate, and assistant professor are each heterogeneous categories, in table 5, we test Model V within ranks to identify why some faculty members are more productive than others.Footnote 21 In table 5, we report the results of testing Model V among assistant professors only, associate professors only, and full professors only. Table 5 uses the log of one plus the number of articles published as the dependent variable. We report results based on the file created by the Amelia program, with missing responses replaced with imputed values, as well as results based on analyses with missing responses excluded from the calculations. The following findings focus only on those columns based on the data with missing responses replaced by imputed values, as we feel more confident in these results, given that they incorporate a larger number of respondents.
Table 5 Log of Articles as Dependent Variable in Subgroup Regressions

Note.
*** p < .001,
** p < .01,
* p < .05
Looking first at assistant professors only (table 5, Model VA), we find that a higher number articles published (with the logarithmic transformation and using imputed values for missing responses) is associated with being male rather than female, having more children, taking less time to complete the doctoral degree, teaching fewer undergraduate courses, having more resources, working in a private institution, and attending more conferences. Among associate professors only (table 5, Model VB), a higher number of articles published is associated with being male rather than female, graduating from a higher ranked department, teaching fewer undergraduate courses, working in a competitive rather than a collegial climate, having more resources, and being employed in a department with a Ph.D. program. Among full professors only (table 5, model VC), a higher number of articles published is associated with being male rather than female, having more children, having more advisees, working in a competitive versus a collegial department, having more resources, being employed in a Ph.D.-granting department, working at a private institution, having a specialty other than American politics, and more years since receipt of the Ph.D.
Thus, we can see both similarities and differences in the predictors of article publication rates across academic ranks. For example, the availability of more resources is related to more publication at all ranks. A large teaching load appears to have detrimental effects on publication rates for assistant and associate professors, although not for full professors. A larger advising load is associated with more productivity among full professors, but not among associate and assistant professors. As well, when we look within these subgroups (partially controlling for age), we find that working in a private institution is associated with higher publication rates among assistant and full professors but has no significant effect on the number of articles produced by associate professors. Being employed by a Ph.D.-granting department is positively related to article production among associate and full professors, but not among assistant professors.
Discussion
With regard to demographics, our results appear to reveal that women employed in political science departments in the United States publish less on average than their male counterparts. When we divide respondents by rank and conduct our analysis within these ranks, using imputed data, the relationship between articles published and gender is significant at all ranks. Several explanations for the existence of this gender difference have been offered: Xie and Shauman (Reference Xie and Shauman1998), for example, argue that female scientists are less likely to hold the positions and have access to the facilitating resources that are conducive to higher rates of publication performance. This finding may be relevant for political scientists at the associate professor level, at which women are less likely than men to be employed by a top-ranked department. At the assistant professor level, however, women are more likely than men to be employed by a top-ranked department. In addition, women and men on average report equal access overall to resources.Footnote 22
Another explanation that has been offered in the literature is that women spend more time “mentoring” than do male faculty. Collins (Reference Collins, Collins, Chrisler and Quina1998) finds that women are more likely than men to devote time to teaching and advising, serve in part-time positions, and teach in fields unlike the ones in which they were trained. Among our respondents, we do not see significant differences between men's and women's teaching loads, either for graduate or undergraduate courses, nor do we see significant differences in committee membership, committee chairing, or overall levels of advising. We note, however, that our questions count the number of these activities but do not ask respondents to report on the amount of time spent on these activities. Female political scientists are also no more likely than male political scientists to work in part-time positions and no more likely to teach or do research in a field that differs from their major field as a graduate student.
Another explanation is that women spend more time than their male colleagues on household and childcare responsibilities (Gmelch, Wilke, and Lovrich Reference Gmelch, Wilke and Lovrich1986; Suitor, Mecom, and Feld Reference Suitor, Mecom and Feld2001).Footnote 23 This explanation seems valid if traditional divisions of labor between men and women exist within the household. We did not, however, include a question in our survey about time devoted to domestic or child-rearing chores, so we cannot check this hypothesis. Looking at our sample of political science faculty members, we see that at the level of assistant professor, men are more likely than women to have children. At the associate and full professor levels, men and women are equally likely to have children.Footnote 24
It is also important to note that the men in our sample have, on average, been in the profession longer than the women in the sample. On average, female respondents received their doctoral degree in 1994, while male respondents received their degrees in 1990. However, we do control for year that a degree was awarded in Model V, and we still find in much of our analysis that women publish less than men.
The findings regarding whether members of a racial or ethnic minority publish more or less when opportunity costs, working environment, and professional characteristics are taken into consideration are inconsistent. We do not find any relationship between self-identification as a minority and number of article publications when the sample is divided by rank.Footnote 25 We note that among the political science faculty who responded to our survey, racial minorities are no more or less likely to be employed by a department that offers a doctoral or an MA degree. Political science faculty who are members of a racial or ethnic minority group are also no more or less likely to be married or have children, and they have, on average, the same number of children as do nonminorities. We find no differences on average in age or year that a degree was awarded when we compare minority group respondents with nonminorities. The average teaching load at the graduate level is the same for minorities and nonminorities, while at the undergraduate level, minorities have a slightly lower teaching load.
A finding that we think particularly important to a profession that places a great deal of emphasis on publications when evaluating faculty performance is the negative effect of a heavy teaching load on research output. The opportunity costs of teaching a large number of courses and preparing new courses are significant indeed. Thus, our findings correspond to the findings of many other scholars—that time spent teaching takes away from time spent doing research (Maske, Durden, and Gaynor Reference Maske, Durden and Gaynor2003, 561; Bellas and Toutkoushian Reference Bellas and Toutkoushian1999; Xie and Shauman Reference Xie and Shauman1998, 865; Hamovitch and Morgenstern Reference Hamovitch and Morgenstern1977, 636; Porter and Umbach Reference Porter and Umbach2001; Taylor, Fender, and Burke Reference Taylor, Fender and Burke2006, 858).
Our findings do diverge from previous findings regarding what is generally classified as “service.” A heavy teaching burden generally has a negative effect on publishing, but advising does not. We speculate that the positive relationship between student advising and higher article production is related to the constructive effects on intellectual activity (including the possibility of coauthorship) that are associated with frequent one-on-one interaction with advisees. We believe that advising represents a measure of professional involvement and should be considered a bonus rather than a cost. A particularly strong relationship exists between the number of Ph.D. students an individual advises and the total number of articles that he or she publishes in refereed academic or professional journals. Having a publishing research group and advising appear to go hand in hand.
Finally, we would like to highlight one more finding. The presence of a collegial climate within the department tends to be associated with less productivity. In other words, a degree of competiveness, even hostility, does not detract from productivity. Other attitudinal measures, such as one's evaluation of the research climate within the department, are positively associated with publications. We will address this evaluative dimension of the professional environment further in a follow-up report.
Appendix A: Survey Methodology
Questionnaire Design
In 2005, the APSA Committee on the Status of Women in the Profession (CSWP) proposed to the president of APSA that the association conduct research associated with the recommendations that emerged from the March 2004 Workshop on Women's Advancement in Political Science organized by Michael Brintnall and Linda Lopez (APSA), Susan Clarke (University of Colorado, Boulder), and Leonie Huddy (Stony Brook University). Once the research proposal was approved, the CSWP used questionnaires that had been employed in research published by Hesli and Burrell (Reference Hesli and Burrell1995); Hesli, Fink, and Duffy (Reference Hesli, Fink and Duffy2003); and Hesli et al. (Reference Hesli, DeLaat, Youde, Mendez and Lee2006) to develop a new survey instrument. Additional questions were added from questionnaires developed by the National Research Council and the University of Michigan's Fall 2001 Survey of Academic Climate and Activities, which was created for an NSF ADVANCE project. The following reports were also used to help generate questions:
• Blau, F. 2002. “Report of the Committee on the Status of Women in the Economics Profession.” American Economic Review 92: 516–20.
• Commission on Professionals in Science and Technology (CPST). 2000. Professional Women and Minorities: A Total Human Resource Data Compendium. 13th ed. Washington, DC: CPST.
• Creamer, Elizabeth. 1998. Assessing Faculty Publication Productivity: Issues of Equity. ASHE-ERIC Higher Education Report, Vol. 26, No. 2. Washington, DC: George Washington University.
• Fox, Mary Frank. 1995. “Women and Scientific Careers.” In Handbook of Science and Technology Studies, ed. S. Jasanoff, J. Markle, J. Petersen, and T. Pinch, 205–23. Newbury Park, CA: Sage.
• Fox, Mary Frank. 1998. “Women in Science and Engineering: Theory, Practice, and Policy in Programs.” Signs: Journal of Women in Culture and Society 24: 201–23.
• Sarkees, Meredith Reid, and Nancy E. McGlen. 1992. “Confronting Barriers: The Status of Women in Political Science.” Journal of Women, Politics & Policy 12 (4): 43–86.
A draft copy of the questionnaire was circulated to the members of the APSA status committees. The questionnaire was revised and expanded to address the concerns of the members of the status committees. The instrument was pilot-tested by distributing it to all political science faculty members at one research university and one private four-year college. The feedback from the pilot test was used to make further revisions to the questionnaire.
Sample Selection
We used as our target population the names contained within the APSA “faculty” file. We used this file of 11,559 names to create a sample population file of size 5,179 names. The original “faculty” file was stratified by department size. To ensure the adequate representation of faculty members from medium- and small-size schools, we oversampled from these groups. Names were selected randomly from the “faculty” file for the “sample” file.
Survey Procedure
Using e-mail addresses, all persons in the sample file were sent a letter of invitation to participate in the study from the executive director and the president of the APSA. Bad e-mail addresses (addresses that bounced back) were replaced with random selections from the “faculty” file. These persons were also mailed an invitation letter. The cleaned “survey” file was sent to the Survey Research Center at the Pennsylvania State University (SRC).
Individuals in the sample were sent an e-mail from SRC inviting them to participate in the survey. This invitation included a link to the web-based survey containing a unique identifier for each potential participant. Only one completed survey was allowed for each identifier. The initial invitation was e-mailed to respondents on August 27, 2009. Follow-up reminders were sent to nonresponders on September 10, 2009; September 24, 2009: October 8, 2009; and October 29, 2009. From among the 5,179 original addresses, 1,399 completed the survey (252 invalid addresses, 105 refusals, and 3,423 nonrespondents).
The distributions of the variables reported in table 2 provide an opportunity to compare the average characteristics of survey respondents to the population as whole (from which the sample was drawn). As indicated in table 2, among the total set of respondents, 68% are male and 32% are female. With regard to faculty rank, 30% are assistant professors, 27% are associate professors, 35% are full professors, and the remaining fall into smaller categories such as instructors or administrators. Among assistant professor respondents, 44% are female; among associate professors, 29% are female; and among full professors, 24% are female. With regard to department type, 34% of respondents work in a Ph.D.-granting program, 20% work in an MA-granting program, 41% work in a department within a four-year college, and the rest are employed in some other type of academic unit.
According to APSA data, the percentage of females in the population from which we drew the sample (all political science faculty members in the United States) was 28% in 2009. Breaking this down by rank and institution type, we get the following distributions:

Appendix B: Variables Included
Dependent Variables
Article Productivity
Survey question: For your entire career, please give your best estimate of the number you have produced or have been awarded for each of the following:
______ number of articles published in refereed academic or professional journals
In one version of this variable, all missing values were set to zero. In another version, we take the logarithmic transformation of the number of articles plus 1.
Total Productivity
Survey question: For your entire career, please give your best estimate of the number you have produced or have been awarded for each of the following:
______ number of articles published in refereed academic or professional journals
______ number of monographs (books) published
______ number of books edited
______ number of book chapters published
All missing values of articles, monographs, edited books, and book chapters were set to zero, and we then took a logarithmic transformation of the sum of these items plus one.
Independent Variables
Female
Survey question: What is your gender?
a. Male
b. Female
c. Transgender
The dummy variable equals 1 if the response is b.
Minority
Survey question: Do you identify yourself as a member of an ethnic and racial minority group?
a. Yes
b. No
c. Don't know
The dummy variable equals 1 if the response is a.
Married
Survey question: What is your personal status?
a. Never married
b. Married (first time)
c. Married (second or third time)
d. Member of an unmarried opposite or same-sex partnership
e. Separated/divorced
f. Widowed
The dummy variable equals 1 if the response is b, c, or d.
Number of Children
Survey question: Do you or a spouse/partner of yours have any children?
a. Yes (If yes, how many?)
b. No
An interaction variable between a dummy for having children (response a) and the number of children specified.
Number of Years to Complete Ph.D.
Survey questions:
(1) In what year did you begin work on your Ph.D.?
(2) In what year did you obtain your degree?
The reported variable is the year of getting the Ph.D. degree minus the year of beginning the degree program.
Ph.D. Program Rank
Survey question: From which university did you obtain your degree?
The program is ranked based on Schmidt and Chingos' (Reference Schmidt and Chingos2007) rankings, classifying 25 as tier 1, 26–50 as tier 2, 51–75 as tier 3, 76–86 as tier 4, and unranked as tier 5. Foreign degrees and degrees from majors other than political science were set as missing. The score is then reversed so that higher numbers represent higher ranked programs.
Teaching Load
Survey question: During the past five years, what is your typical teaching load each year? (If in your current position for less than five years, base this on the period since your appointment.)
Number of New Courses Prepared
Survey question: In the past 5 years, how many new courses (courses that you have not taught previously—do not include even major revisions of courses you have taught before) have you prepared for your department or college (if you have a joint appointment, refer to your primary unit)?
Number of Committee Memberships
Survey question: In a typical year during the past five years, on how many committees do you serve?
Number of Committees Chaired
Survey question: In a typical year during the past five years, how many committees do you chair?
Amount of Student Advising
Survey question: For how many of each of the following types of individuals do you currently serve as official advisor? Undergraduates, MA students, PhD students, postdocs
The variable was generated by following steps. First, dummy variables were created to represent higher-than-average advising for each student group. For example, the respondent would receive a “1” on undergraduate advising if his or her reported number of undergraduate students advised was higher than the overall mean for that question. The same coding rule was applied to other student groups such as MA students, doctoral students, and postdocs. Next, we counted the overall number of 1s from those four dummies.
Collegial Climate
Survey question: Please rate the climate of your unit(s)/department(s) on the following continuum by selecting the appropriate number (check the appropriate box). For example, in the first row, the value 1 indicates hostile, while the value 5 indicates friendly, and the numbers in between represent relative combinations of each.

A principal component analysis, with the Varimax rotation method revealed two separate components. The Collegial Climate Scale is composed of hostile–friendly, disrespectful–respectful, contentious–collegial, individualistic–collaborative and competitive–cooperative. We calculated the mean score for those five dimensions, with higher numbers indicating a collegial climate.
Count of Overall Resources
Survey question: Have you received any of the following resources as a result of your own negotiations, the terms of an award, or as part of an offer by the university, since your initial contract at your current position? If so, please check all that apply.

Using the count command, we added up the total number of checks for all rows and all columns.
Ph.D. Program
Survey question: What is the type of department where you are employed?
a. Ph.D.-granting program
b. MA-granting program
c. Department within a four-year college
d. Department within a two-year college
e. Other academic unit (specify)
The dummy variable equals 1 if the response is a.
MA Program
Same question as above, with the dummy variable equals to 1 if the response is b.
Private Institution
Survey question: Is this a public or a private institution?
a. Public
b. Private
The dummy variable equals to 1 if the response is b.
Faculty Rank
Survey question: What is the title of your primary current appointment?
We created an ordinal variable using the following coding: 1 (instructors, lecturers, postdocs and fellows), 2 (assistant professors), 3 (associate professors), and 4 (full professors, emeritus, and administrative positions)
Subfield Dummies
Survey question: Which of the following best describes your current primary field of teaching and research?
a. American
b. Comparative
c. International relations
d. Theory
e. Methods
f. Other (please specify)
American subfield equals 1 if the response is a. Comparative subfield equals 1 if the response is b. IR subfield equals 1 if the response is c. Theory subfield equals 1 if the response is d. Methods subfield equals 1 if the response is e.
Year of Degree
Survey question: In what year did you obtain your degree?
Coauthorship
Survey question: Which of following most accurately describes the majority of your publications?
a. Most are sole-authored
b. Most are coauthored with colleagues in my department
c. Most are coauthored with scholars from other departments in my institution
d. Most are coauthored with colleagues from outside my institution
e. Most are coauthored with students
The dummy variable equals 1 if the response is b, c, d, or e.
Frequency of Conference Attendance
Survey question: How often have you attended political science conferences in the past three years?
Current Program Ranking
A ranking of the department for which the respondent is currently working. Programs are ranked based on Schmidt and Chingos' (Reference Schmidt and Chingos2007) ranking, classifying top 25 as tier 1, 26–50 as tier 2, 51–75 as tier 3, 76–86 as tier 4, and unranked as tier 5. The score is then reversed so that higher numbers represent higher ranked departments.