The microbial community resident in the human colon is a highly complex consortium of many different bacterial species. The application of molecular tools targeting the 16S rRNA gene has revealed that the numerically dominant groups are low G+C % Gram-positive bacteria and Gram-negative Bacteroidetes; however, many phylotypes remain uncultured and consequently poorly characterised(Reference Flint, Louis, Scott, Duncan and Brogden1). The microbiota plays an important role in host health through various mechanisms, such as protection against pathogenic bacteria and provision of nutrients, and its composition can be modulated by dietary means, which can lead to either more health-promoting or more detrimental consequences for the host(Reference Flint, Louis, Scott, Duncan and Brogden1). One way of modulating the gut microbiota is through the consumption of prebiotics, non-digestible food ingredients that pass through the upper gut and are selectively fermented by colonic bacteria. This leads to specific changes in the composition and/or activity of the gut microbiota that confers benefits upon host well-being and health(Reference Gibson, Probert, Van Loo, Rastall and Roberfroid2, Reference Macfarlane, Macfarlane and Cummings3). The dietary fructan inulin and its breakdown product fructo-oligosaccharide are particularly well-studied prebiotics, and evidence supporting their health-promoting effects, mostly in animal models, is accumulating rapidly(Reference Macfarlane, Macfarlane and Cummings3, Reference Guarner4). A direct consequence of inulin ingestion is stimulation of lactic acid bacteria (lactobacilli and bifidobacteria) within the gut microbiota(Reference Gibson, Probert, Van Loo, Rastall and Roberfroid2). While the bifidogenic effect of inulin is well demonstrated, it is less clear whether this is a characteristic of the whole genus, or whether certain Bifidobacterium spp. are selectively stimulated. Several Bifidobacterium spp. are commonly found in the adult human colon(Reference Matsuki, Watanabe, Tanaka, Fukuda and Oyaizu5–Reference Mangin, Suau, Magne, Garrido, Gotteland, Neut and Pochart8). The degradation of fructo-oligosaccharides seems to be widespread among bifidobacterial strains in pure culture, while fewer strains are able to utilise inulin(Reference Rossi, Corradini, Amaretti, Nicolini, Pompei, Zanoni and Matteuzzi9). In vivo, however, cross-feeding of fructo-oligosaccharides and fructose from primary inulin degraders might lead to a stimulation of other bifidobacteria(Reference Rossi, Corradini, Amaretti, Nicolini, Pompei, Zanoni and Matteuzzi9).
Possible effects of inulin on other members of the gut microbiota are less well studied; however, it is increasingly recognised that prebiotics are likely to lead to further microbial changes other than bifidogenesis(10). For example, an increase in the concentration of butyrate (butyrogenic effect) has been found in animal models(Reference Gibson, Probert, Van Loo, Rastall and Roberfroid2); however, lactic acid bacteria do not produce butyrate as a fermentation product. This butyrogenic effect could be due to several mechanisms. Several butyrate-producing bacteria can utilise inulin in vitro (Reference Duncan, Hold, Harmsen, Stewart and Flint11, Reference Duncan, Aminov, Scott, Louis, Stanton and Flint12) and are therefore likely to be stimulated directly in the gut. Metabolic cross-feeding of the inulin breakdown product fructose and the fermentation product lactate from bifidobacteria to butyrate producers has been demonstrated in co-culture experiments(Reference Belenguer, Duncan, Calder, Holtrop, Louis, Lobley and Flint13, Reference Falony, Vlachou, Verbrugghe and De Vuyst14), and conversion of lactate into butyrate and propionate has been shown in fermentor studies(Reference Bourriaud, Robins, Martin, Kozlowski, Tenailleau, Cherbut and Michel15). A decrease in pH due to the increased formation of fermentation acids could also lead to changes in the microbiota, as demonstrated in vitro (Reference Walker, Duncan, McWilliam Leitch, Child and Flint16). It is likely that all these mechanisms contribute to the butyrogenic effect of inulin in vivo, and they may also influence each other, as was demonstrated for the interdependence of pH, lactate production and lactate utilisation in vitro (Reference Belenguer, Duncan, Holtrop, Anderson, Lobley and Flint17).
Despite the composition of the human gut microbiota being quite similar between healthy individuals on a broad scale, there are individual differences at a species and strain level(Reference Zoetendal, Collier, Koike, Mackie and Gaskins18). Consequently, metabolic capabilities of the microbiota might vary between people, as has been shown for the conversion of lactate to either butyrate or propionate in vitro (Reference Bourriaud, Robins, Martin, Kozlowski, Tenailleau, Cherbut and Michel15). The level of stimulation of bifidobacteria after ingestion of inulin as determined in faecal samples also shows a big variation between volunteers(Reference Gibson, Probert, Van Loo, Rastall and Roberfroid2, Reference Fuller, Louis, Mihajlovski, Rungapamestry, Ratcliffe and Duncan19), as do the baseline levels of this bacterial group. Numbers vary by several logs between individuals and in some people they are undetectable(Reference Fuller, Louis, Mihajlovski, Rungapamestry, Ratcliffe and Duncan19, Reference Gueimonde, Tölkkö, Korpimäki and Salminen20). Therefore, other bacterial groups might replace bifidobacteria as the main consumers of inulin in those individuals.
The aim of the present study was to investigate changes in the major groups of the human gut microbiota in response to the intake of 10 g/d inulin over a 16-d period to improve the understanding of the effects of inulin on the gut community as a whole. In addition, the composition of the genus Bifidobacterium was investigated to establish which species were stimulated by inulin in vivo.
Experimental methods
Study design
The present study was designed to assess the influence of cabbage-processing methods and prebiotic ingestion on glucosinolate breakdown in human volunteers and the full details, including volunteer designations (A–L), have been published previously(Reference Fuller, Louis, Mihajlovski, Rungapamestry, Ratcliffe and Duncan19). Briefly, twelve healthy adult volunteers were randomly split into two groups and either consumed 5 g inulin–oligofructose (Beneo™; DKSH/Orafti Great Britain Ltd, Kent, UK) twice daily for 21 d (inulin period) or did not consume a supplement for 21 d (control period) in a balanced crossover study design. Faecal samples were taken at the outset of the present study and at day 16 of both periods. DNA was extracted from the faecal samples as described before(Reference Fuller, Louis, Mihajlovski, Rungapamestry, Ratcliffe and Duncan19). The present study was approved by the NHS Trust Grampian Research Ethics Committee.
Faecal fermentation product and pH analysis
For fermentation product analysis, approximately 0·5 g of faeces were mixed with 1·5 ml of sterile demineralised water and centrifuged at 13 000 g for 10 min. One millilitre of the supernatant was analysed by GC following conversion to t-butyldimethylsilyl derivatives(Reference Richardson, Calder, Stewart and Smith21). The lower limit of reliable detection of each product was taken as 0·2 mm. For the determination of faecal pH, approximately 0·5 g of faeces was centrifuged for 10 min at 17 000 g and the pH was measured in the supernatant with a microelectrode.
Quantitative real-time PCR
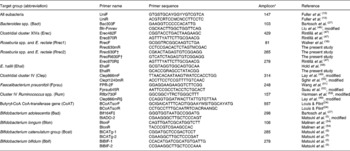
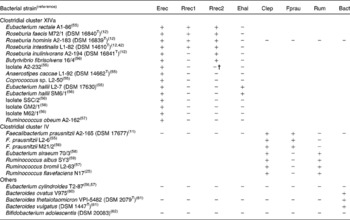
Primers for quantification of specific bacterial groups and the butyryl-CoA CoA-transferase gene are given in Table 1. Primers designed in the present study for Roseburia spp. and Eubacterium hallii were initially selected based on a sequence alignment of twenty-nine clostridial cluster XIVa (Erec) bacteria, two cluster IV and three cluster XVI strains. The specificity of the primers was checked with the Probe Match function of the Ribosome Database Project II(Reference Cole, Chai, Farris, Wang, Kulam-Syed-Mohideen, McGarrell, Bandela, Cardenas, Garrity and Tiedje22). Primer and probe sequences taken from the literature were checked with Probe Match and sequence alignments and modified accordingly. Group-specific primer sets were validated by testing their amplification of either genomic DNA or the amplified 16S rRNA gene of a panel of fifteen cluster XIVa, seven cluster IV, one cluster XVI, three Bacteroides strains and Bifidobacterium adolescentis as shown in Table 2, using the real-time PCR conditions described in the next paragraph. Primers for clostridial cluster XIVa, E. hallii (Ehal), clostridial cluster IV (Clep), Faecalibacterium prausnitzii (Fprau) and Bacteroides spp. (Bact) amplified all the strains in their target groups and none of the strains in other groups. Two different primer sets for Roseburia spp./Eubacterium rectale were used, as we could not identify any region of the 16S rRNA gene that was specific for all known species of the Roseburia/E. rectale cluster. Primer set Rrec1 targets the same species as fluorescent in situ hybridisation (FISH) probe Rrec584(Reference Aminov, Walker, Duncan, Harmsen, Welling and Flint23), and did not amplify Roseburia inulinivorans (Table 2), while primer set Rrec2 amplified all known Roseburia spp., E. rectale and Butyrivibrio fibrisolvens 16/4 and also led to low-level amplification of isolate A2-232 (Table 2). The primer set used for the amplification of cluster IV ruminococci (Rum) also amplified Eubacterium siraeum (Table 2). It should be noted that for primer sets Rrec2 and Rum, the group-specific primer was used together with a primer detecting a wider range of bacteria (i.e. clostridial cluster XIVa and IV, respectively); however, this did not seem to compromise the specificity or robustness of the assays. Bifidobacterium spp.-specific PCR conditions were validated with 16S rRNA gene amplicons of two strains of Bifidobacterium adolescentis (DSM 20 083T, L2-32(Reference Belenguer, Duncan, Calder, Holtrop, Louis, Lobley and Flint13)), two strains of Bifidobacterium longum (DSM 20 219T, DSM 20 088), Bifidobacterium pseudocatenulatum DSM 20 438T, Bifidobacterium bifidum DSM 20 456T, Bifidobacterium angulatum DSM 20 098T and Bifidobacterium breve DSM 20 213T. For B. adolescentis, one of the primers used was specific for all bifidobacteria, as clone library analysis revealed that some B. adolescentis clones would not be recognised by species-specific primer Bi-ADO-1(Reference Matsuki, Watanabe, Tanaka, Fukuda and Oyaizu5).
Table 1 Primers used in the present study for real-time PCR analysis

* Product size (bp) is based on Roseburia hominis A2-183 for universal primers and on the bacterial strains used as standards for specific primers.
† Primers Rrec630F and RrecRi630F are used together at 250 nm each.
‡ Primer is specific for cluster XIVa.
§ Primer is specific for cluster IV.
‖ Primer is specific for bifidobacteria.
Table 2 Validation of 16S rRNA primers for real-time PCR analysis of gut microbiota*

Bact, Bacteroides spp.; Clep, clostridial cluster IV; Ehal, Eubacterium hallii; Erec, clostridial cluster XIVa; Fprau Faecalibacterium prausnitzii; Rrec, Roseburia/E. rectale group; Rum, cluster IV Ruminococcus spp.
* +, Real-time PCR quantification using standard curves, as described by Fuller et al. (Reference Fuller, Louis, Mihajlovski, Rungapamestry, Ratcliffe and Duncan19) of 1·5 ng genomic DNA or 107 16S rRNA copies of the respective strain resulted in over 105 or 106 gene copies, respectively; − , real-time PCR quantification resulted in less than 102 or 103 gene copies, respectively.
† Amplification approximately 100-fold lower than that for positive strains.
Quantitative real-time PCR analysis of faecal DNA was performed as described previously(Reference Fuller, Louis, Mihajlovski, Rungapamestry, Ratcliffe and Duncan19) with the following modifications: all samples and standards were examined in duplicate per PCR run. The annealing temperature was 60°C for all primer sets apart from Erec (55°C) and CoAT (53°C). For primer sets leading to amplicons over 150 bp, a 30-s extension step at 72°C was included. For CoA-transferase primers, data acquisition was performed at this step as described previously(Reference Louis and Flint24). For B. bifidum-specific primers, data acquisition was also performed at 72°C, as baseline fluorescence was high at 60°C presumably due to hairpin formation. Amplified 16S rRNA genes from the following bacteria served as standard templates: Bacteroides thetaiotaomicron DSM 2079T for universal primers and Bacteroides spp. primers; Roseburia hominis A2-183 (DSM 16 839T) for universal, cluster XIVa and Roseburia spp. primers; E. hallii L2-7 (DSM 17 630) for E. hallii primers; F. prausnitzii A2-165 (DSM 17 677) for cluster IV and F. prausnitzii primers; Ruminococcus flavefaciens N17(Reference Flint, McPherson and Bisset25) for cluster IV Ruminococcus spp. primers and B. adolescentis DSM 20 083T, B. longum DSM 20 219T, B. pseudocatenulatum DSM 20 438T and B. bifidum DSM 20 456T for Bifidobacterium spp.-specific assays. The percentage of 16S rRNA gene copy number of a specific group or species relative to gene copy numbers obtained with the universal primers was determined using the efficiency-corrected ΔCt method(Reference Bookout, Cummins, Kramer, Pesola, Mangelsdorf, Ausubel, Brent, Kingston, Moore, Seidman, Smith and Struhl26). At least three independent standard curves were used to calculate the PCR efficiency E = 10( − 1/slope). Quantities for bacterial groups were calculated from mean Ct values of two independent PCR runs using the following formula: E − Ct. As the two independent PCR runs led to highly reproducible results (CV of 10 % or less), Bifidobacterium spp.-specific quantities were determined from single assays. The normalised value was obtained by dividing specific group quantities through universal quantities, which were multiplied by 100 to obtain the percentage of specific gene of universal gene copies. For E. hallii, CoA-transferase primers and Bifidobacterium spp., 5 ng per reaction was amplified, and for all other primer sets, 0·5 ng per reaction was amplified. Values for E. hallii, CoA-transferase and Bifidobacterium spp. were corrected to account for the different dilution of template DNA.
Clone library construction and phylogenetic analysis
For the investigation of which bifidobacterial species were present, four volunteers, the two with the highest increase in Bifidobacterium spp. upon inulin consumption (volunteers I and L, both from group 2, treatment order control, inulin) and two volunteers with an intermediate increase (volunteers A and H, one from each group) were selected for clone library analysis. Faecal DNA was amplified with primers Bif164F(Reference Bartosch, Fite, Macfarlane and McMurdo27) (GGGTGGTAATGCCGGATG) and g-Bifid-R(Reference Matsuki, Watanabe, Fujimoto, Miyamoto, Takada, Matsumoto, Oyaizu and Tanaka28) (GGTGTTCTTCCCGATATCTACA) using BioTaq DNA polymerase (Bioline Ltd, London, UK). The amplification conditions were as follows: initial denaturation at 94°C for 2 min, followed by twenty cycles of denaturation (30 s, 94°C), annealing (30 s, 55°C) and extension (30 s, 72°C) and a final extension at 72 °C for 10 min. PCR products were purified with a PCR clean-up kit (QIAquick; Qiagen Ltd, Crawley, UK or Wizard SV Gel and PCR Clean-Up System; Promega, Southampton, UK), cloned into vector pGEM®-T Easy (Promega) and transformed into XL1-Blue MRF′ Supercompetent cells (Stratagene, La Jolla, CA). Randomly chosen clones were amplified using vector primers and sequenced with primer g-Bifid-R on a capillary sequencer (CEQ8000 Genetic Analyser; Beckman Coulter, High Wycombe, UK).
Sequence analysis was performed on the in-house RRI/BioSS Beowulf cluster, running openMosix (http://bioinformatics.rri.sari.ac.uk). The sequences were base called with Phred(Reference Ewing and Green29, Reference Ewing, Hillier, Wendl and Green30), vector sequences trimmed off with Lucy(Reference Chou and Holmes31) and aligned with MUSCLE(Reference Edgar32) and two iterations of Clustal W(Reference Chenna, Sugawara, Koike, Lopez, Gibson, Higgins and Thompson33). Alignments were manually corrected using Jalview(Reference Clamp, Cuff, Searle and Barton34) and the sequences shorter than 400 nucleotides were deleted. A distance matrix was created with Phylip(Reference Felsenstein35) and operational taxonomic units at 99 % were obtained with Dotur(Reference Schloss and Handelsman36). Any operational taxonomic units with less than four sequences were manually inspected for alignment errors and removed from the analysis if they were chimeras or of low sequence quality. The operational taxonomic units were assigned to different Bifidobacterium spp. by basic local alignment search tool (BLAST) analysis(Reference Altschul, Gish, Miller, Myers and Lipman37). The sequences have been deposited in GenBank under accession numbers EU421962–EU422224 and EU422226–EU422945.
Statistical analysis
The percentage of bacteria and SCFA concentrations from twelve volunteers and the percentage of Bifidobacterium spp. from ten volunteers were analysed with ANOVA, with volunteer as random effect and treatment (baseline, control, inulin), group (whether inulin was given before or after the control period) and their interaction as treatment effects. The effect of inulin was assessed by means of contrasts where the baseline and the control period were compared against the inulin period. Two of the Bifidobacterium spp. were detected in only five of the ten volunteers, and in addition to the parametric ANOVA described earlier, these strains were analysed by Friedman's non-parametric ANOVA. Results were similar for both approaches; so for consistency the ANOVA results are presented for these strains. For four volunteers, clone library data were obtained. The clone count per species was expressed as a percentage of the total clone count. When a strain was present in all four volunteers, these percentage data were analysed by ANOVA as described earlier, except that group effects were not assessed. Relationships between SCFA and bacteria were investigated using linear regression where a volunteer-specific intercept was allowed for. Data are presented as mean (sem), where the latter is based on variation between volunteers. All analyses were performed with GenStat 10th Edition Release 10.1 (VSN International, Hemel Hempstead, Hertfordshire, UK).
Results
Changes in microbiota composition, fermentation acids and pH upon inulin ingestion
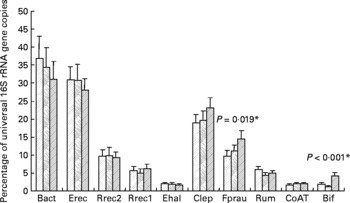
It was shown previously for the samples analysed here that the proportion of bifidobacteria was significantly (P < 0·001) increased after inulin consumption (see Fuller et al. (Reference Fuller, Louis, Mihajlovski, Rungapamestry, Ratcliffe and Duncan19) and Fig. 1); however, both the baseline abundance and the magnitude of the response to inulin were very different between individuals. We therefore investigated in the present study whether other bacterial groups were affected by ingestion of inulin. The real-time PCR primers for different phylogenetic groups of the faecal microbiota as well as primers against a gene involved in butyrate metabolism in the majority of known butyrate producers from the human gut(Reference Louis and Flint24) were used. Across all volunteers, a significant change upon inulin consumption was only found for F. prausnitzii (P = 0·019, Fig. 1); however, the response to inulin showed a tendency to be dependent on treatment order (P = 0·057). All the volunteers in group 2 (treatment order control, then inulin) showed an increase between the control and inulin periods, whereas in group 1, where inulin was given before the control period, F. prausnitzii had a tendency to remain high during the control period (data not shown).

Fig. 1 Microbiota composition of faecal samples from twelve human volunteers before, (![]() ; n 12) and after 16 d of control period (
; n 12) and after 16 d of control period (![]() ; n 12) or after 16 d of inulin supplementation (
; n 12) or after 16 d of inulin supplementation (![]() ; n 11) based on real-time PCR. Details on bacterial groups detected are given in Tables 1 and 2. The data for Bifidobacterium spp. (Bif) were taken from Fuller et al. (Reference Fuller, Louis, Mihajlovski, Rungapamestry, Ratcliffe and Duncan19). *P values reflect the effect of inulin, obtained from comparing baseline and control periods against the inulin period using contrasts, from ANOVA with volunteer as random effect and treatment, treatment order and their interaction as fixed effects. Absence of P value means not significant (P>0·10). Error bars reflect sem (based on variation between volunteers).
; n 11) based on real-time PCR. Details on bacterial groups detected are given in Tables 1 and 2. The data for Bifidobacterium spp. (Bif) were taken from Fuller et al. (Reference Fuller, Louis, Mihajlovski, Rungapamestry, Ratcliffe and Duncan19). *P values reflect the effect of inulin, obtained from comparing baseline and control periods against the inulin period using contrasts, from ANOVA with volunteer as random effect and treatment, treatment order and their interaction as fixed effects. Absence of P value means not significant (P>0·10). Error bars reflect sem (based on variation between volunteers).
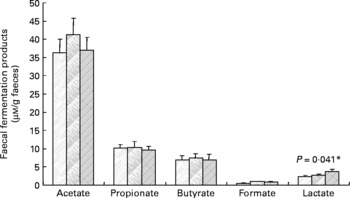
Faecal SCFA and lactate were also determined, but there were no statistically significant effects of inulin (Fig. 2), except in the case of lactate, which was slightly increased during the inulin supplementation (P = 0·041). Similarly, the faecal pH did not differ significantly between treatment periods (baseline 6·96 (sem 0·15), control 6·95 (sem 0·13), inulin 6·91 (sem 0·11)).

Fig. 2 Main bacterial fermentation products of faecal samples from twelve human volunteers before (![]() ; n 12) and after 16 d of control period (
; n 12) and after 16 d of control period (![]() ; n 12) or after 16 d of inulin supplementation (
; n 12) or after 16 d of inulin supplementation (![]() ; n 11). *P value reflects the effect of inulin, obtained from comparing baseline and control periods against the inulin period using contrasts, from ANOVA with volunteer as random effect and treatment, treatment order and their interaction as fixed effects. Absence of P value means not significant (P>0·10). Error bars reflect sem (based on variation between volunteers).
; n 11). *P value reflects the effect of inulin, obtained from comparing baseline and control periods against the inulin period using contrasts, from ANOVA with volunteer as random effect and treatment, treatment order and their interaction as fixed effects. Absence of P value means not significant (P>0·10). Error bars reflect sem (based on variation between volunteers).
The percentage of Roseburia/E. rectale spp. showed a significant positive correlation with butyrate concentration (P < 0·001, linear regression, with 64 % of the variance accounted), while the proportion of the F. prausnitzii group, which also produces butyrate, showed a trend towards a positive correlation with butyrate levels (P = 0·087, linear regression, with 44 % of the variance accounted). The levels of the butyryl-CoA CoA-transferase gene significantly correlated with cluster XIVa bacteria (Erec, P < 0·001, linear regression, with 70 % of the variance accounted; Rrec2, P < 0·001, linear regression, with 59 % of the variance accounted), while no significant correlation was found for the Roseburia/E. rectale group Rrec1, F. prausnitzii or butyrate. Butyrate concentration, however, was negatively correlated with pH (P = 0·001, linear regression with 60 % of the variance accounted).
Stimulation of Bifidobacterium spp. by inulin
Bifidobacterium spp. showed the strongest stimulation upon inulin ingestion in the present study. In order to identify the main species present, Bifidobacterium-specific clone library analysis was performed with faecal DNA of four donors. The effect of inulin on the bifidobacteria (as percentage of total bacteria) was significant in these four donors (P = 0·004(Reference Fuller, Louis, Mihajlovski, Rungapamestry, Ratcliffe and Duncan19)). This response was the strongest in donors I and L, with bifidobacteria in baseline and control samples forming less than 2 %, and in inulin samples over 8 % of all bacterial genes, while donors A and H showed a less dramatic inulin effect and had more variable levels of bifidobacteria between the baseline and control period (see Fuller et al. (Reference Fuller, Louis, Mihajlovski, Rungapamestry, Ratcliffe and Duncan19)). Between sixty-four and ninety-one clones were analysed per sample. B. adolescentis and B. longum were detected in all four volunteers, B. pseudocatenulatum and B. animalis were present in three, B. bifidum in two and B. dentium in one. Each volunteer harboured between three and five different species. Of the strains that were detected in all four volunteers, the percentage of clones belonging to B. adolescentis was doubled during the inulin period (36 % at baseline and 27 % for the control period v. 66 % for the inulin treatment, P = 0·028, based on ANOVA using contrasts). Clone numbers for B. dentium and B. animalis tended to be low (less than 10 % in all but one sample).
The most prevalent Bifidobacterium spp. based on the clone library results were quantified by the real-time PCR in all volunteers apart from volunteers E and J, who carried very low or undetectable levels of bifidobacteria(Reference Fuller, Louis, Mihajlovski, Rungapamestry, Ratcliffe and Duncan19).
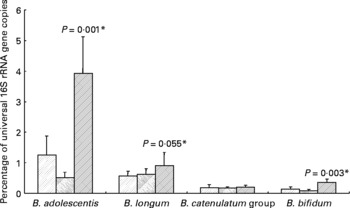
All ten volunteers carried B. longum and nine of these also B. adolescentis. The Bifidobacterium catenulatum group was found in six and B. bifidum in five of the ten volunteers. For seven volunteers, the same species were found in all three samples (background, inulin and control). Ingestion of inulin led to a significant stimulation of B. adolescentis relative to the whole microbiota (Fig. 3) with six of the volunteers showing a clear increase (data not shown). B. bifidum also showed an increase (0·22–0·63 % (P < 0·001) for the five volunteers for whom this species was present), while B. longum exhibited a tendency to increase on inulin (Fig. 3).

Fig. 3 Individual bifidobacterial species 16S rRNA genes as percentage of all bacterial 16S rRNA genes of faecal samples from ten human volunteers before (![]() ; n 12) and after 16 d of control period (
; n 12) and after 16 d of control period (![]() ; n 12) or after 16 d of inulin supplementation (
; n 12) or after 16 d of inulin supplementation (![]() ; n 11) based on real-time PCR. *P values reflect the effect of inulin, obtained from comparing baseline and control periods against the inulin period using contrasts, from ANOVA with volunteer as random effect and treatment, treatment order and their interaction as fixed effects. Absence of P value means not significant (P>0·10). Error bars reflect sem (based on variation between volunteers).
; n 11) based on real-time PCR. *P values reflect the effect of inulin, obtained from comparing baseline and control periods against the inulin period using contrasts, from ANOVA with volunteer as random effect and treatment, treatment order and their interaction as fixed effects. Absence of P value means not significant (P>0·10). Error bars reflect sem (based on variation between volunteers).
Discussion
The bifidogenic effect of the prebiotic inulin in man is well documented(Reference Gibson, Probert, Van Loo, Rastall and Roberfroid2, Reference Macfarlane, Macfarlane and Cummings3). In the present study, we used the real-time PCR to analyse the effect of inulin ingestion on a wider range of human faecal bacteria. The human gut microbiota is dominated by low G+C % Gram-positive bacteria mainly belonging to clostridial clusters XIVa and IV(Reference Collins, Lawson, Willems, Cordoba, Fernandez-Garayzabal, Garcia, Cai, Hippe and Farrow38) and Gram-negative bacteria related to Bacteroidetes, while other members such as lactic acid bacteria and proteobacteria are present in lower numbers(Reference Flint, Louis, Scott, Duncan and Brogden1). The real-time PCR primers used in the present study cover the three main bacterial groups as well as several subgroups within clostridial cluster XIVa and IV and a functional gene for butyrate synthesis that is shared between different groups(Reference Louis and Flint24). The data for all volunteers showed a significant increase for the cluster IV species F. prausnitzii. There was a tendency for a group effect, which may have been caused by a residual effect of inulin supplementation, although the faecal sample from the control period was collected 16 d after inulin supplementation was stopped. Furthermore, volunteers in group 2 consumed two cabbage test meals before the inulin treatment period(Reference Fuller, Louis, Mihajlovski, Rungapamestry, Ratcliffe and Duncan19). Samples for microbiota analysis were taken 17 d after the test meals, however, and it is therefore unlikely that they had a significant effect on the levels of F. prausnitzii. Finally, the observed group effect may have arisen by chance. Kleessen et al. (Reference Kleessen, Schwarz, Boehm, Fuhrmann, Richter, Henle and Krueger39) did not find a significant change in F. prausnitzii in human volunteers consuming bakery products containing inulin. Therefore, the effect seen in the present study will have to be confirmed in other human intervention studies to clarify whether the F. prausnitzii group is indeed stimulated by inulin; however, it is conceivable that this is the case, as several strains of F. prausnitzii have been shown to utilise inulin in pure culture(Reference Duncan, Hold, Harmsen, Stewart and Flint11). F. prausnitzii is a butyrate producer and inulin has been reported to be butyrogenic in animal models(Reference Gibson, Probert, Van Loo, Rastall and Roberfroid2). An increase in butyrate production upon inulin ingestion could not, however, be detected in the present study. This was also true for other studies with similar levels of daily ingestion of inulin, and it must be recognised that SCFA changes in the upper colon may not be detected in the faeces as the majority of fermentation acids formed is taken up by the colon(Reference Nyman40). Positive correlation between F. prausnitzii and butyrate levels was weak, whereas the levels of Roseburia/E. rectale bacteria showed a significant positive correlation with butyrate, as also observed in a recent study with obese volunteers(Reference Duncan, Belenguer, Holtrop, Johnstone, Flint and Lobley41). While this group did not increase upon inulin ingestion as a mean of all volunteers, two volunteers showed a strong increase (data not shown). This could have been caused by a fluctuation in the microbiota unrelated to inulin. It is possible, however, that only a subgroup of people reacts to inulin intake by an increase in Roseburia/E. rectale levels, possibly based on which strain/species of the Roseburia/E. rectale group are present. In pure culture, Roseburia inulinivorans has been shown to degrade inulin, whereas other Roseburia/E. rectale strains either show no or weaker inulin utilisation(Reference Duncan, Aminov, Scott, Louis, Stanton and Flint12, Reference Duncan, Hold, Barcenilla, Stewart and Flint42). Two primer sets were used for the Roseburia/E. rectale group that either exclude (Rrec1) or include R. inulinivorans (Rrec2). The high levels of this group after inulin intake in two volunteers seen with primer set Rrec1 were less pronounced with primer set Rrec2 (data not shown), indicating that R. inulinivorans is not the main species stimulated by inulin. Either other species within this group are directly stimulated by inulin, or this increase may be due to a cross-feeding effect from primary inulin degraders, as has been shown in vitro for Roseburia intestinalis and R. hominis (Reference Belenguer, Duncan, Calder, Holtrop, Louis, Lobley and Flint13, Reference Falony, Vlachou, Verbrugghe and De Vuyst14).
A significant decrease in cluster XIVa (Erec) bacteria upon inulin ingestion was found in other studies(Reference Kleessen, Schwarz, Boehm, Fuhrmann, Richter, Henle and Krueger39, Reference Harmsen, Raangs, Franks, Wildeboer-Veloo and Welling43) by fluorescent in situ hybridisation, but individual members of this group, such as Roseburia/E. rectale spp., were not investigated. We did not find a significant change in cluster XIVa bacteria in the present study. Interestingly, the butyryl-CoA CoA-transferase gene levels correlated significantly with cluster XIVa bacteria, but not with either the Roseburia/E. rectale group (Rrec1), F. prausnitzii or butyrate levels. This indicates that cluster XIVa contains many bacteria outside the Roseburia/E. rectale cluster carrying this pathway for butyrate formation that may be less metabolically active and thus may not contribute much to butyrate production in the colon.
It was observed that the spread within volunteers was similar to that between volunteers. This was about 1·8 % (as percentage of total bacteria) for the bifidobacteria, 3·3 % for Rrec1, 5·1 % for F. prausnitzii and up to 13·4 % for Bacteroidetes.
Bifidobacterium-specific clone libraries were constructed from the faecal samples of four volunteers to identify the main species present. Between three and five different Bifidobacterium spp. were found in each of the volunteers, similar to other studies based on multiplex PCR and PCR temperature gradient gel electrophoresis which found that a carriage of three to four species was most common in adults(Reference Matsuki, Watanabe, Tanaka, Fukuda and Oyaizu5, Reference Mangin, Suau, Magne, Garrido, Gotteland, Neut and Pochart8). The real-time PCR detection led to similar results, with the majority of volunteers carrying at least three of the four species analysed (data not shown). The bifidobacterial composition, examined by PCR-denaturing gradient gel electrophoresis, was found to be stable over a 4-week period(Reference Satokari, Vaughan, Akkermans, Saarela and de Vos6). We also found that most species detected were present in each of the three samples for each volunteer with both the methodological approaches used here. Volunteer L carried five different Bifidobacterium species that were still detected even after a drastic increase in B. adolescentis after inulin consumption (data not shown). Volunteer H, on the other hand, had a less stable species composition, and the stability of the microbiota might therefore differ between individuals.
B. adolescentis and B. longum were the most prevalent species in the present study, followed by B. pseudocatenulatum and B. bifidum. These species were also found to be common in other studies utilising PCR-based methods(Reference Matsuki, Watanabe, Tanaka, Fukuda and Oyaizu5, Reference Mullié, Odou, Singer, Romond and Izard7, Reference Mangin, Suau, Magne, Garrido, Gotteland, Neut and Pochart8). B. dentium, detected in only one of the four volunteers using the clone library approach, was also found to be less prevalent in other investigations(Reference Matsuki, Watanabe, Tanaka, Fukuda and Oyaizu5, Reference Mullié, Odou, Singer, Romond and Izard7, Reference Mangin, Suau, Magne, Garrido, Gotteland, Neut and Pochart8). B. animalis, found here in three of the four volunteers, albeit at low numbers, is commonly used as a probiotic(Reference Masco, Huys, De Brandt, Temmerman and Swings44) and may therefore originate from the consumption of probiotic food products. Alternatively, it may form part of the indigenous microbiota as recently demonstrated in elderly subjects(Reference Ouwehand, Bergsma, Parhiala, Lahtinen, Gueimonde, Finne-Soveri, Strandberg, Pitkäla and Salminen45). Overall, the prevalence and species composition of bifidobacteria found in the present study are in good agreement with those from previous studies.
The ability of Bifidobacterium strains to grow on fructooligosaccharides and inulin has been investigated in vitro (Reference Rossi, Corradini, Amaretti, Nicolini, Pompei, Zanoni and Matteuzzi9). Of the fifty-five strains tested, all could grow on fructo-oligosaccharides but only eight on inulin. The study did not include all the species found here, but for B. adolescentis and B. bifidum both inulin degraders and non-degraders were found. Therefore, this trait does not seem to be unique to certain Bifidobacterium spp. and rather a strain-dependent characteristic. However, as growth on fructo-oligosaccharides was demonstrated in vitro for all strains tested, cross-feeding of oligosaccharides from the primary inulin degraders to other bifidobacteria is likely(Reference Rossi, Corradini, Amaretti, Nicolini, Pompei, Zanoni and Matteuzzi9). The present results indicate that B. adolescentis competes best for inulin in vivo, be it directly or by cross-feeding. This is particularly evident in volunteer L, who carried very low levels of five different Bifidobacterium spp. both in the baseline and control sample (data not shown), but showed a major boost of B. adolescentis after the inulin period. B. pseudocatenulatum has also been reported to be prevalent in man(Reference Matsuki, Watanabe, Tanaka, Fukuda and Oyaizu5, Reference Mullié, Odou, Singer, Romond and Izard7). We did detect it in six volunteers, but it did not show an increase upon inulin ingestion.
In conclusion, the present study indicates that B. adolescentis plays a major role in the response to inulin in vivo. Furthermore, a significant stimulation was found for F. prausnitzii, confirming that ingestion of prebiotics is likely to lead to microbiota changes beyond the lactic acid bacteria(10). Since inter-individual variation may have a major influence, studies involving larger numbers of volunteers together with more detailed analysis of the microbiota will be necessary to further define those bacteria that respond to inulin.
Acknowledgements
The Rowett Research Institute and Biomathematics & Statistics Scotland received support from the Scottish Government Rural and Environment Research and Analysis Directorate. Samples analysed originated from the Foods Standards Agency project Influence of Cooking and Processing of Brassica Vegetables on the Release of Beneficial and Harmful Metabolites of Glucosinolates in the Digestive Tract (project code T01027). We would like to thank Pauline Young for DNA sequencing, Tony Travis and John Thomson for their valuable help on bioinformatics, Terry Whitehead for strain B. ovatus V975 and Harry Flint for critical reading of the manuscript. There are no conflicts of interest. C. R. contributed to performing the clone library analysis and interpretation of the data. K. S. analysed the faecal pH and SCFA concentration and contributed to optimising the real-time PCR quantification. Z. F. and A. D. designed the present study. G. H. performed the statistical analysis and contributed to the preparation of the manuscript. P. L. designed the present study and performed the real-time PCR quantification and clone library analysis and prepared the manuscript.