


Obesity is a progressive and relapsing chronic disorder that is associated with increased risk of morbidity and mortality including the development of insulin resistance, type 2 diabetes, hypertension, dyslipidaemia(Reference Fruhbeck1) and cholesterol abnormalities(2). It is also associated with low-grade systemic inflammation through the expression of proinflammatory mediators such as TNF-α, IL-6(Reference Weisberg, McCann and Desai3), C-reactive protein (CRP)(Reference Blake and Ridker4) and leptin(Reference Lau, Dhillon and Yan5), all of which have been linked to increased risk of CVD(Reference Blake and Ridker6). Adipose tissue also secretes the anti-inflammatory mediator, adiponectin, which has direct positive effects on vascular function(Reference Nesto7).
Intentional weight loss with a reduction of adipose tissue improves many of these medical complications with a decrease in circulating levels of proinflammatory biomarkers(Reference Jellema, Plat and Mensink8, Reference Krebs, Browning and McLean9) and a reduction of metabolic abnormalities(Reference Williamson10). Dietary supplementation with long-chain n-3 PUFA (LCn-3PUFA) is also known to suppress the production of proinflammatory cytokines(Reference Calder11) and increase the levels of HDL-cholesterol (HDL-C)(Reference Harris12, Reference Belalcazar, Reboussin and Haffner13). LCn-3PUFA also lower TAG levels(Reference Belalcazar, Reboussin and Haffner13, Reference Gunnarsdottir, Tomasson and Kiely14) and to a considerably lower level than weight loss does(Reference Harris15). Animal studies have shown that supplementing the diet with LCn-3PUFA can reduce body weight and fat mass (FM) in mice(Reference Nakatani, Kim and Kaburagi16, Reference Ruzickova, Rossmeisl and Prazak17) and it is possible that, in humans, LCn-3PUFA might also reduce body fat(Reference Buckley and Howe18) and could have a similar effect on body weight.
There is a dose-dependent relationship with weight loss and improvements to health; and it has been suggested that a modest weight loss of 5–10 % of initial body weight can make a difference(Reference Blackburn19, Reference Klein20). There is a possibility that LCn-3PUFA could facilitate this by increasing weight loss when taken in combination with a weight loss programme. The aim of this study was to investigate the effect of LCn-3PUFA on weight loss and short-term weight loss maintenance in obese adults by comparing two groups who followed the same very-low-energy diet (VLED) using meal replacements (MR), with one group consuming fish oil capsules. We hypothesised that (i) LCn-3PUFA of marine origin may facilitate weight loss in combination with a weight loss programme using a VLED, and that (ii) continued supplementation with LCn-3PUFA may inhibit weight regain during a period of weight maintenance. Furthermore, the combination of weight loss and LCn-3PUFA supplementation may have a concomitant positive effect on cardiovascular health determinants.
Methods
This was a randomised, double-blind, placebo-controlled intervention with two parallel groups. This study was conducted according to the guidelines laid down in the Declaration of Helsinki and all procedures were approved by the Human Research Ethics Committee of the University of Newcastle, Australia. Written informed consent was obtained from all participants before commencement of the study. The trial was registered with the Australian New Zealand Clinical Trials Registry (ACTRN12609000204246).
Participants
Both male and female participants, aged 18–60 years and with a BMI of between 30 and 40 kg/m2, were recruited from the university campus and the general public in Newcastle, Australia to take part in a weight loss study. People with diagnosed diabetes mellitus, a chronic inflammatory condition, already following an energy-restricted diet, allergic to fish, taking fish oil capsules or consuming two or more oily fish meals per week were excluded from the study, as were women who were pregnant or lactating.
A power calculation estimated that sixteen participants per group would allow a detection of approximately 2 % difference in weight loss between the two diet groups at the 0·05 level of significance, with a statistical power of 80 % and assuming a standard deviation of 2 %. Allowing for a 20 % dropout rate, it was estimated that twenty participants per group would be required.
Study design
Simple randomisation using computer-generated random numbers allocated participants to one of two parallel groups. Supplement containers were labelled with a code by an independent researcher before the trial commenced so that neither the principal researcher nor the participants could identify the contents of the supplements, and supplements contained peppermint to disguise identifiable flavours. For 4 weeks, one group consumed 6 × 1 g capsules of placebo per day (placebo group, PB), containing Sunola oil (monounsaturated oil), and the other group consumed 6 × 1 g capsules of fish oil per day (fish oil group, FO). Each fish oil capsule contained tuna oil comprising 360 mg LCn-3 PUFA with 70 mg EPA and 270 mg DHA (ratio, 1:3·9). Both the tuna oil and the Sunola oil contained the antioxidant Coviox®T-70, 3000 parts per million in the tuna oil and 600 parts per million in the Sunola oil. Two capsules were consumed with each meal (breakfast, lunch and dinner), providing 1·62 g DHA and 0·42 g EPA/d.
For the 4 weeks, participants followed a VLED of 3000 kJ/d. To encourage dietary compliance and to reduce differences between participants in the foods that they consumed, for the first 2 weeks participants received Optifast® bars and shakes to replace meals, according to the Intensive Phase of the Optifast Very Low Calorie Diet Program (Novartis, Australia), supplemented daily with raw and cooked vegetables and 2 litres of drinking-water. This 3000 kJ/d diet is composed of 40 % protein, 16 % fat and 40 % carbohydrate plus vitamins and minerals. At the same time, participants were given individual nutrition education and counselling, with the sessions focusing on the energy density of foods, understanding and using of food labels, appropriate portion sizes and the number of portions to be consumed daily from the different food groups. This information was used to build a healthy diet using the guidelines from the Australian Guide to Healthy Eating(Reference Kellet, Smith and Schmerlaib21), and applied during weeks 3 and 4, when the MR were gradually phased out and healthy energy-controlled meals were phased in. All participants attended weekly so that weight loss progress could be monitored and to receive the next supply of MR and capsules.
To address the potential for weight loss rebound after the weight loss phase, participants progressed to a weight stabilisation/maintenance phase. For 10 weeks, they continued to take the fish oil or placebo supplements as allocated in the weight loss phase, and continued to consume healthy meals with food choices and portion sizes as recommended by the Australian Guide to Healthy Eating. Participants now attended fortnightly to obtain their capsules, monitor their weight and discuss diet-related issues. An accredited practising dietitian was part of the research team to advise on healthcare.
Dietary assessment
Before commencing the weight loss programme, dietary intake was assessed with a 3 d food diary (two weekdays and one weekend day) to determine everyday nutrient and energy intake. Participants used the weights given on food products and handy measures of cups and spoons to record food intake which was analysed using the dietary software program, Foodworks® Professional 2009, version 6 (Xyris Software (Australia) Private Limited), and the mean values were calculated. In the final week of weight maintenance, participants again completed a 3 d food diary to measure changes in dietary intake.
Anthropometric assessment
On the first day of the weight loss trial, anthropometric measurements were taken in the morning after a 10 h overnight fast and no alcohol consumption, with participants dressed in light clothing and without shoes. Standing height was measured to the nearest 0·1 cm using a stadiometer. Body weight was measured to the nearest 0·1 kg using a calibrated balance beam scale (PCS Measurement). BMI was calculated in kg/m2 from weight and height. Waist circumference (WC) was measured at the mid-point between the lowest rib and the top of the hipbone; the hip measurement was taken at the fullest point of the hip, as viewed from the side. The waist:hip ratio was calculated as waist girth (cm) divided by the hip girth (cm). FM, fat-free mass (FFM) and muscle mass were measured using single-frequency bioelectrical impedance (Maltron International) and (InBody 230; Biospace Company, Limited). Under identical conditions, these anthropometric measurements were repeated at the end of the weight loss and weight maintenance phases.
Biochemical analyses
Blood sample collection
Fasting blood samples were collected into tubes, EDTA, lithium heparin and sodium fluoride, by venepuncture at baseline, at the end of the weight loss phase and again at the end of weight maintenance. The samples were prepared by centrifuging (Heraeus Biofuge Stratos) for 10 min at 3000 g at 4°C. Plasma samples from the EDTA tubes were collected and stored at − 80°C until further analysis. Plasma from the lithium heparin and sodium fluoride tubes was analysed for blood lipids and blood glucose, respectively, by Hunter Area Pathology Services.
Plasma fatty acid analysis
The plasma lipids were analysed for fatty acid composition using an acetyl chloride methylation procedure, a modification of the method of Lepage & Roy(Reference Lepage and Roy22). Fatty acid methyl esters were quantified using a GC (Hewlett Packard 6890; Hewlett Packard) and identified by comparing peak retention times with the retention times of synthetic standards of known fatty acid composition (Nu Check Prep).
Analysis of inflammatory markers
ELISA kits (R&D Systems) were used to analyse inflammatory markers. The assays used to determine plasma leptin and adiponectin levels employed the quantitative sandwich enzyme immunoassay technique with a detection limit of 15·6 pg/ml and 3·9 ng/ml, respectively, and inter- and intra-assay CV of less than 5·5 and 7 %, respectively. High-sensitivity ELISA kits were used to determine levels of TNF-α (high-sensitivity TNF-α) and IL-6 (high-sensitivity IL-6). Minimal detectable concentration of these kits was 0·106 and 0·039 pg/ml, respectively, with intra- and inter-assay CV of < 9 %. Analysis of high-sensitivity CRP was performed using an immunoturbidimetric method (Hunter Area Pathology Services) with a minimal detection level of 0·15 mg/l.
Statistical analyses
ANOVA was used to test group mean differences; and within-group changes from baseline were determined using paired-samples t tests. Pearson product-normal correlations (r) were used to show relationships. Data are presented as mean values and standard deviations, with P ≤0·05 indicating significance. All statistical analyses were carried out using SPSS software (version 17.0; SPSS, Inc.).
Results
A total of forty participants commenced the present study (twenty per group), but eight did not complete the study; two reacted to the supplements, one participant relocated to another city, one withdrew for personal reasons, one withdrew because of a broken ankle and three participants did not keep appointments for final measurements and blood collection. Hence, thirty-two participants completed the weight loss phase, eighteen in the FO group (fifteen females and three males) and fourteen in the PB group (eleven females and three males). Extreme outliers were identified for high-sensitivity CRP (n 2 FO and n 2 PB) and were excluded from the analysis of this biomarker. The thirty-two participants continued to the weight stabilisation/maintenance phase, but only twenty-nine completed this phase; as three participants did not keep their appointments for final measurements and blood collection (one female FO, and one male and one female PB). In the weight maintenance phase, other extreme outliers were identified and excluded (n 1 PB for glucose and n 2 FO for adiponectin).
Diet
Mean energy intake of the participants before commencing the study was 8273 (sd 1669) kJ/d for FO and 7846 (sd 2399) kJ/d for PB; the differences were not significant. During weight loss, all participants followed a very similar 3000 kJ/d MR diet for 4 weeks. The 3 d food diaries completed towards the end of the maintenance phase showed a mean energy intake of 5080 (sd 1294) kJ/d for FO and 6007 (sd 1758) kJ/d for PB. Again, the differences between the two groups were not significant.
The percentage fatty acid composition of plasma lipids at baseline showed no significant difference between the two groups. Supplementation with LCn-3 PUFA in FO significantly increased EPA (C20 : 5n-3) (P < 0·001) and DHA (C22 : 6n-3) (P < 0·001) (Table 1), and these increased levels were significantly higher than those levels found in PB at the end of weight loss (P < 0·001 for both). Levels of EPA and DHA remained significantly higher for FO than for PB at the end of weight maintenance (P < 0·001 for both).
Table 1 Baseline values and changes for long-chain n-3 PUFA (LCn3-PUFA) (Mean values and standard deviations)
FO, fish oil group; PB, placebo group.
* n 18.
† n 14.
Anthropometric measurements
Weight loss phase
At the commencement of the study, the baseline measurements for weight, BMI, FM, FFM, waist and hip were not significantly different between PB and FO (Table 2). At the end of 4 weeks of weight loss, there was a significant reduction in weight − 7·7 % ( − 6·87 kg), FM − 15 % ( − 5·47 kg) and FFM − 2·6 % ( − 1·36 kg) in FO, (P < 0·001 for all). In PB, there were also significant reductions in weight − 6·9 % ( − 6·54 kg) and FM − 13·9 % ( − 5·53 kg) (P < 0·001 for both), and in FFM − 1·8 % ( − 1·0 kg) (P < 0·02). For both FO and PB, there was a significant reduction in WC − 6·4 % ( − 6·53 cm) and − 4·8 % ( − 4·96 cm), respectively; and also in hip measurement − 3·7 % ( − 4·44 cm) and − 3·5 % ( − 4·23 cm) for FO and PB, respectively (P < 0·001 for all) (Table 2). There was no significant difference in the changes between the two groups. Controlling for BMI using two-stage multiple regression confirmed this result. Correlations between changes in anthropometric measurements, weight loss and LCn-3PUFA were computed. There were positive, significant correlations between weight loss and reductions to BMI and FM (P < 0·001 for FO and PB), and between weight loss and reductions to FFM (P < 0·05 FO and P < 0·001 PB). There was also a positive, significant correlation between increased levels of EPA and a reduction in FM (P < 0·02) in FO.
Table 2 Baseline values and changes for anthropometric measurements (Mean values and standard deviations)

BL, baseline; FM, fat mass; FFM, fat-free mass; WC, waist circumference.
Mean values were significantly different within groups: *P < 0·05; **P < 0·01; ***P < 0·001.
Weight maintenance phase
The number of participants completing this phase reduced by two in PB to n 12, and by one in FO to n 17. Table 2 shows the reductions in anthropometric measurements during the weight maintenance phase (week 14). For FO, there were significant reductions in weight − 1·9 % ( − 1·69 kg), BMI − 1·8 % ( − 0·6 kg/m2) (P = 0·01 for both), FM − 5 % ( − 1·62 kg, P = 0·03), WC − 2·4 % ( − 2·29 cm, P = 0·003) and hip circumference − 2·1 % ( − 2·38 cm, P ≤ 0·001). For PB, the changes from weight loss to weight maintenance were not significant. A comparison of changes between FO and PB showed no significant differences. For FO, there was a positive, significant correlation between DHA and weight loss (P = 0·02) and loss of FM (P = 0·025).
Blood biomarkers
Weight loss phase
The changes in blood lipids from baseline to the end of weight loss (week 4) are summarised in Table 3. For both FO and PB, there were significant reductions in total cholesterol (TC) (P < 0·001 and P ≤ 0·002, respectively), and LDL-cholesterol (LDL-C) (P < 0·05 for both), with small, non-significant differences between the two groups. There were positive, significant correlations between weight loss and TC for FO (P < 0·05) and PB (P ≤ 0·001), and also between weight loss and LDL-C for FO (P < 0·05) and PB (P ≤ 0·001). For FO, there were significant reductions in TAG (P < 0·001) but not for PB. For both FO and PB, there were significant reductions in HDL-C (P < 0·01 for both). There was a significant reduction in glucose for FO (P < 0·05) but not for PB. The only significant reduction observed in the inflammatory biomarkers was for leptin (P < 0·001 for FO and PB) and high-sensitivity IL-6 (P < 0·05) for PB (Table 3).
Table 3 Baseline values and changes for blood biomarkers (Mean values and standard deviations)
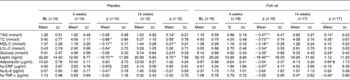
BL, baseline; TC, total cholesterol; HDL-C, HDL-cholesterol; LDL-C, LDL-cholesterol; hs-CRP, high-sensitivity C-reactive protein; hs-IL-6, high-sensitivity IL-6; hs-TNF-α, high-sensitivity TNF-α.
Mean values were significantly different within groups: *P < 0·05; **P < 0·01; ***P < 0·001.
† n 11.
‡ n 15.
§ n 12.
‖ n 16.
Weight maintenance phase
At the end of 10 weeks of weight maintenance (week 14 in the study), there were more changes in blood lipids for both FO and PB, as shown in Table 3. An increase in TAG and TC was significant for FO and PB (P < 0·05 for both) and in HDL-C for PB only (P < 0·01) (Table 3). HDL-C did increase for FO, but the difference was not significant. There was a significant decrease in levels of high-sensitivity TNF-α and a significant increase in adiponectin levels for FO (P ≤0·05 for both) (Table 3). Other changes in inflammatory biomarkers were non-significant apart from leptin which increased in PB (P < 0·01) (Table 3). The differences between the two groups were not significant.
Discussion
The main purpose of the present study was to investigate whether LCn-3PUFA would assist weight loss when administered as a supplement during a weight loss diet. To this end, it was essential that the diet was controlled and participant energy intake was as similar as possible to enable the measurement of the effect of the LCn-3PUFA. By using MR, participants were able to follow a VLED of 3000 kJ/d for 4 weeks. Dietary compliance is more favourable with MR than with a conventional reduced energy diet because the prescribed meal content is set; that is, portion sizes are predetermined, food choice is largely removed and so too are the temptations presented when preparing food. MR are also satiating, with the effect lasting for between 3 and 5 h after consumption(Reference Rothacker and Watemberg23), thus further facilitating dietary compliance.
Significant reductions in weight, FM, FFM, WC and hip measurements for both groups in this study highlight the efficacy of the VLED, but fail to show a significant weight loss difference from supplementation with LCn-3PUFA, despite the significant increase in plasma concentrations of EPA and DHA. There is conflicting evidence on the effect of LCn-3PUFA on weight loss. Some animal studies have shown that supplementation with LCn-3PUFA is effective in reducing weight and FM in mice(Reference Ruzickova, Rossmeisl and Prazak17) while others have shown no significant effect(Reference Raclot, Groscolas and Langin24, Reference Minami, Ishimura and Sakamoto25). Studies involving human subjects have also reported conflicting results. A small number of severely obese women following a VLED reported a significant weight loss in the group that also consumed LCn-3PUFA (2·8 g/d n-3; EPA:DHA = 2:1) compared to the control(Reference Kunesova, Braunerova and Hlavaty26). A significantly greater weight loss was observed in males but not in females consuming an energy-restricted diet including lean fish (0·27 g/d n-3; 0·05 g/d EPA+0·21 g/d DHA, in the ratio 1:4), or fatty fish (3·0 g/d n-3; 0·77 g/d EPA+1·37 g/d DHA, in the ratio 1:1·8) or LCn-3PUFA (1·42 g/d n-3; 0·63 g/d EPA+0·43 g/d DHA, in the ratio 1·5:1), compared to the control(Reference Gunnarsdottir, Tomasson and Kiely14, Reference Thorsdottir, Tomasson and Gunnarsdottir27). However, no significant differences were observed when participants were given LCn-3 PUFA supplements (1·3 g/d EPA and 2·9 g/d DHA, in the ratio 1:2·2) in combination with a VLED(Reference Krebs, Browning and McLean9), or with an energy-controlled diet plus exercise (3 g/d EPA+DHA, in the ratio 5:1)(Reference DeFina, Marcoux and Devers28), or with energy-controlled but not -restricted diets (1·1 g/d EPA and 0·7 g/d DHA, in the ratio 1·6:1)(Reference Couet, Delarue and Ritz29), (1·8 g/d n-3; 1·08 g/d EPA and 0·72 g/d DHA, in the ratio 1·5:1)(Reference Kabir, Skurnik and Naour30), although there was a significantly greater decrease in FM in the treatment groups compared to the control for these last two studies. A significant weight gain has also been observed in some studies when the diet of cancer patients was supplemented with LCn-3PUFA(Reference Colomer, Moreno-Nogueira and Garcia-Luna31).
To explain the reason for these conflicting results is difficult. It is possible that the energy level of the diet that accompanies supplementation could be a factor. However, in two studies that used a VLED with LCn-3 PUFA supplementation, one study reported a significant weight loss compared to the control(Reference Kunesova, Braunerova and Hlavaty26), while the other study reported no significant differences(Reference Krebs, Browning and McLean9). It is also possible that the amount of LCn-3PUFA consumed, or the proportion of EPA to DHA could be a contributing factor. Studies with mice have reported that body weight and FM decrease relative to the amount of LCn-3PUFA in the diet(Reference Nakatani, Kim and Kaburagi16), and it has also been shown that LCn-3PUFA prevent weight gain(Reference Nakatani, Kim and Kaburagi16, Reference Ruzickova, Rossmeisl and Prazak17). Similar findings have been reported in human subjects, with significantly lower levels of LCn-3PUFA found in obese females and/or males compared to healthy-weight individuals(Reference Klein-Platat, Drai and Oujaa32–Reference Micallef, Munro and Phang34). It would appear that the accumulation of LCn-3PUFA in the body could be an important factor for weight management; so we investigated this possibility in the 10-week weight maintenance phase.
It is a commonly held belief that slow weight loss is better preserved in the long term(Reference Astrup and Rossner35) and that large amounts of initial weight loss lead to more weight regain(Reference McGuire, Wing and Klem36). However, it has also been reported that a greater initial weight loss is associated with a more significantly sustained weight loss maintenance(Reference Astrup and Rossner35, Reference Anderson, Konz and Frederich37). The potential is there for a weight loss rebound after a VLED unless new manageable and effective dietary habits are established. In this study, the VLED was supported with a 10-week transition period of weight maintenance using the Australian Guide to Healthy Eating to establish healthy eating habits while participants continued to consume the supplements they had been allocated during the weight loss phase. The significant decreases in weight, BMI, FM, WC and hip measurements for FO but not for PB during this phase would appear to support the suggestion that the accumulation of LCn-3PUFA in the body might contribute to weight management. This was further supported by the significant correlations between the level of DHA and reduction in weight, BMI and FM (P = 0·021, 0·024 and 0·025, respectively) for FO during this phase.
As anticipated, weight loss had a positive influence on blood lipids, which is highlighted by the significant relationships with weight loss and reductions in TC and LDL-C in both the FO and the PB groups. The reduction in HDL-C levels was similar for both groups. Reductions in levels of TC and LDL-C are associated with clinical benefits, but a reduction in HDL-C is undesirable because of its recognised cardioprotective effects(Reference Boden38). There are conflicting reports on the effect of weight loss on HDL-C, with studies either showing small increases or small decreases or no change at all(Reference Poobalan, Aucott and Smith39). Overall, it would appear that HDL-C levels decrease with active weight loss and then increase when a stabilised reduced weight is reached(Reference Dattilo and Kris-Etherton40, Reference Ditschuneit, Flechtner-Mors and Johnson41). It has been suggested that the reduction in HDL-C occurs because lipoprotein lipase is reduced during active weight loss, subsequently reducing TAG-rich lipoprotein synthesis which impairs VLDL-C catabolism and the transfer of lipids to HDL-C, thereby reducing HDL-C concentrations. With the stabilisation of weight at the reduced level, lipoprotein lipase increases as does hydrolysis of VLDL-C and the transfer of lipids to HDL-C resumes(Reference Dattilo and Kris-Etherton40). After the 10 weeks of weight maintenance in our study, HDL-C levels did increase for both groups, but significantly only for the PB group, reaching a level higher than that at baseline. Levels of TAG, TC and LDL-C also increased, probably as a consequence of resuming the consumption of normal meals with a different fat content. However, they remained lower than the baseline levels.
It has been reported that LCn-3PUFA have no effect on TC levels(Reference Harris12, Reference Balk, Lichtenstein and Chung42), although there are differences of opinion on whether LCn-3PUFA increase levels of LDL-C(Reference Balk, Lichtenstein and Chung42) or have no effect(Reference Harris12). Recent studies(Reference Micallef and Garg43, Reference Micallef and Garg44) have shown that LCn-3PUFA supplementation results in a small increase in LDL-C; however, it is accompanied by an increase in the size of these particles which are less atherogenic(Reference Connor45). It is well known that LCn-3PUFA are effective in lowering TAG levels(Reference Harris and Bulchandani46), which supports our findings of a significant reduction in TAG in FO only. During weight loss, there were no significant correlations between blood lipids and EPA or DHA, though there was for glucose which reduced significantly and was positively and significantly correlated with EPA (P ≤ 0·05).
It would appear that weight loss and LCn-3PUFA, either independently or combined, influenced positive changes in the inflammatory markers. While the changes were modest, some of the changes within the groups were significant but, between the groups, they were not. Overall, the study was not adequately powered to determine significance between the groups with such small changes.
Leptin is important for the regulation of food intake, energy expenditure and adiposity(Reference Anubhuti and Arora47); and decreasing leptin levels are associated with dietary energy restriction(Reference Boden, Chen and Mozzoli48) and weight loss(Reference Maffei, Halaas and Ravussin49), while a return to a regular food intake is associated with increased leptin levels(Reference Kolaczynski, Considine and Ohannesian50). Accordingly, in our study, there was a significant decrease in plasma leptin within both groups with dietary energy restriction and weight loss. A return to regular food intake during maintenance saw a significant increase in leptin for PB only, with a very modest increase in leptin for FO, the difference between the two groups almost reaching significance (P = 0·052), suggesting a possible influence of LCn-3PUFA on leptin levels in the FO group. A study by Mori et al. (Reference Mori, Burke and Puddey51) reported that a significant reduction in serum leptin was influenced by an interaction between LCn-3PUFA and energy restrictions, but there were no significant effects from LCn-3PUFA or weight loss alone. However, the evidence on the effect of fish oil on plasma leptin levels, in association with changes in adiposity or independent of adipose tissue mass, shows very conflicting results(Reference Puglisi, Hasty and Saraswathi52).
Reduced levels of CRP, a surrogate marker of CVD risk, are directly related to a reduction in weight loss(Reference Selvin, Paynter and Erlinger53). However, in our study, there was a 2-fold greater decrease in CRP levels for FO during the weight loss phase compared to PB, and CRP continued to decrease during the maintenance phase for FO while it increased for PB. This would suggest that the greater decrease in CRP for FO could be attributed to LCn-3PUFA. Studies investigating the effect of LCn-3PUFA on CRP have reported conflicting results, with one study finding that LCn-3PUFA intake but not weight loss was associated with a significant reduction in CRP(Reference Tsitouras, Gucciardo and Salbe54), and the other reporting that LCn-3PUFA had no effect on serum concentrations of CRP(Reference Madsen, Christensen and Blom55). Differences in the size and age of the two groups studied and the length of the intervention could account for the conflicting results. It has also been suggested that such contradictory findings could be attributed to other components in the diet, which might positively affect plasma CRP(Reference Puglisi and Fernandez56).
Weight loss but not the composition of the diet is reported to be the influence in the reduction of IL-6 and TNF-α(Reference Jellema, Plat and Mensink8). However, a study involving twenty-eight healthy subjects reported that dietary supplementation with fish oil can suppress the production of TNF-α(Reference Caughey, Mantzioris and Gibson57). Our present study did not show any positive additional effects of LCn-3PUFA on changes to IL-6 or TNF-α, which agrees with the findings of a study involving healthy, moderately hypertriacylglycerolaemic subjects where supplementation with 0·85 g EPA/d and 3·4 g DHA/d over 8 weeks had no effect on the levels of IL-6 and TNF-α(Reference Skulas-Ray, Kris-Etherton and Harris58). It has been suggested that, as IL-6 is secreted by adipose tissue, loss of FM with weight loss could contribute to the reduction of IL-6(Reference Jellema, Plat and Mensink8). Adiponectin has been reported to increase in response to diet-induced weight loss(Reference Madsen, Rissanen and Bruun59), and LCn-3PUFA(Reference Tsitouras, Gucciardo and Salbe54), although the change in the latter was not significant, possibly because of the small sample size. In our study, weight loss resulted in an increase in adiponectin for PB but decreased for FO, with both not being significant. There was, however, a significant increase in adiponectin levels for FO during maintenance, indicating a possible delayed influence from LCn-3PUFA. It has been suggested that a weight loss >10 % is needed for a significant increase in adiponectin levels to occur(Reference Madsen, Rissanen and Bruun59).
The ratio of plasma 18 : 1/18 : 0 is used as a measure of stearoyl-coenzyme A desaturase activity in humans(Reference Attie, Krauss and Gray-Keller60) that has been in turn been implicated in weight gain and TAG synthesis. In the present study, the change in the 18:1/18:0 ratio was significantly lower in FO compared to the PB group (P < 0·05) (Table 1). The reduction in the 18:1/18:0 ratio in the FO group correlated negatively with change in plasma TAG levels but not with change in BMI or body weight. Considering that TAG levels in plasma correlate with adipose tissue(Reference Attie, Krauss and Gray-Keller60), future studies may examine the longer-term effects of fish oil supplementation on body weight and FM.
In summary, it appears that short-term supplementation with LCn-3PUFA did improve the metabolic profile of the participants for the duration of the study, but it did not have any influence on weight loss. There was a significant decrease in FM for the FO group during the maintenance phase but, compared to the PB group, the difference was modest. While it is possible that this difference in FM could be attributed to supplementation with LCn-3PUFA, a larger cohort of subjects would be required to determine the significance with such modest changes. Also, the present study does not rule out the possibility that a deficiency of n-3 fatty acids may cause rapid weight gain. The role of n-3 fatty acids in weight gain has not been previously examined and is worthy of further examination. The potential benefits of loading the body cells/membranes with n-3 fatty acids before implementation of the weight loss programme merits further examination.
Study limitation
A limitation of this study is the small sample size from the reduced completion rate. More studies with a larger sample size and possibly a longer weight stabilisation/maintenance phase are needed to further investigate these findings.
Acknowledgements
NuMega Ingredients Pty Limited, Australia, supplied the fish oil and Sunola oil capsules. Nestlé Nutrition, Australia, supplied the Optifast® bars and shakes for the MR. Miss Melinda Phang (Nutraceuticals Research Group) provided assistance with the analysis of plasma fatty acids. This research received no specific grant from any funding agency in the public, commercial or not-for-profit sectors. Both authors contributed to the design of the research project. I. A. M. conducted the research, performed the statistical analysis and drafted the manuscript. M. L. G. provided essential materials and contributed to critical review. Both authors read and approved the final manuscript. The authors have no conflicts of interest to declare.


