1. Introduction
Single nucleotide polymorphism (SNP) genotyping chips have enabled an era of genomic selection, in which dense SNP genotypes covering the genome are used to predict the genetic merit of candidate individuals or lines for breeding purposes (Meuwissen et al., Reference Meuwissen, Hayes and Goddard2001; Heslot et al., Reference Heslot, Yang, Sorrells and Jannink2012). In cattle, for example, genomic estimated breeding values (GEBVs) can be predicted with a considerably good accuracy (Saatchi et al., Reference Saatchi, McClure, McKay, Rolf, Kim, Decker, Taxis, Chapple, Ramey, Northcutt, Bauck, Woodward, Dekkers, Fernando, Schnabel, Garrick and Taylor2011). However, commercial moderate density SNP arrays, such as the Ilumina BovineSNP50 Beadchip (Matukumalli et al., Reference Matukumalli, Lawley, Schnabel, Taylor, Allan, Heaton, O'Connell, Moore, Smith, Sonstegard and Van Tassell2009), are costly, which have limited their applications to males and elite females. Although high predictive accuracy has been documented, e.g. by Weigel et al. (Reference Weigel, de los Campos, Gonzalez-Recio, Naya, Wu, Long, Rosa and Gianola2009), using low-density assays with 300–2000 selected SNPs, validity of each of these low-density genotyping panels is usually intrinsic to a specific trait and a given breed. As a cost-effective alternative solution to generating moderate density genotypes, various imputation strategies have been sought. The idea is to genotype candidate animals with a low-density platform comprising equally spaced SNPs, and then to impute moderate-density genotypes via appropriate statistical models (e.g. Habier et al., Reference Habier, Fernando and Dekkers2009; Weigel et al., Reference Weigel, de los Campos, Gonzalez-Recio, Naya, Wu, Long, Rosa and Gianola2009; Zhang & Druet, Reference Zhang and Druet2010).
Several software packages have been developed for genotype imputation in humans or livestock. Based on the sources of information used to infer missing genotypes, imputation methods can be divided into family-based or population-based, or those that make use of both sources. The family-based approach makes use of linkage and Mendelian segregation rules, and is most accurate for animals having genotyped relatives. The population-based approach utilizes linkage disequilibrium (LD) information between missing SNPs and the observed flanking SNPs, and is well suited for a set of unrelated individuals or for animals whose close ancestors have not been genotyped. In practice, however, choosing an appropriate method is not always an easy decision. One may wish to choose a method that yields the greatest imputation accuracy, but such information is not available before the data at hand are actually analysed. In addition, none of the current methods provide perfect imputation, and imputed genotypes may be inconsistent among programs. Solving such inconsistencies poses another challenge in imputation. From the viewpoint of machine learning, genotype imputation can be considered as a classification problem, and each imputation method can be viewed as an independent classifier. Ensemble learning algorithms (e.g. Polikar, Reference Polikar2006) can be helpful for combining predictions from alternative models, and can yield final classification results that are more robust than those from individual classifiers.
Ensemble learning is a machine learning paradigm where multiple learners are trained to solve the same problem. Unlike ordinary machine learning approaches, which learn about a sole hypothesis from training data, an ensemble method constructs a set of hypotheses and combines them in the final decision. Dasarathy & Sheela (Reference Dasarathy and Sheela1978) discussed the problem of partitioning the feature space using two or more classifiers, and this was one of the earliest studies on ensemble systems. A wave of research on ensemble learning started in the 1990s. Hansen & Salamon (Reference Hansen and Salamon1990) showed that the generalization performance of a neural network can be improved by using an ensemble of similarly configured neural networks; Schapire (Reference Schapire1990) proved that a strong classifier (i.e. approximately correct) can be generated by combining weak classifiers through boosting, which was the predecessor of AdaBoost algorithms. Thereafter, research in ensemble systems has expanded rapidly, leading to many methods (Polikar, Reference Polikar2006). Within these, AdaBoost (Freund & Schapire, Reference Freund and Schapire1996) became one of the most widely used ensemble methods, since it can improve generalization performance relative to individual methods or classifiers (Sewell, Reference Sewell2011). The basic principle of AdaBoost is to combine multiple base classifiers to produce a committee, whose performance is better than that of any of the base classifiers. The latter are trained in sequence using a weighted form of the dataset in which the weights associated with each data point depend on the performance of the previous classifiers. Points that are misclassified by one of the base classifiers are given greater weight when used to train the next classifier in the sequence. Once all classifiers have been trained, their predictions are combined through a weighted majority voting scheme (Bishop, Reference Bishop2006). At present, no reports are available on the application of Adaboost to genotype imputation in animal genetics and breeding.
The objective of this study was to investigate the performance of an ensemble approach to imputing moderate-density SNP genotypes. This approach was used to impute 50K genotypes from 5K genotypes in a registered Angus cattle population.
2. Materials and methods
(i) Data
Data were from Merial Limited and consisted of 3078 Angus animals, each genotyped using the Illumina BovineSNP50 BeadChip. Quality control and data editing were carried out by Merial Limited, and we further deleted the individuals and markers that had more than 10% missing genotypes. The final dataset has 3059 animals and 51 911 SNPs across the whole genome. All animals are sires with known parents, and a pedigree file including 10 163 individuals was created by tracing ancestors. Since all genotyped animals were male, we traced their sire, paternal-grandsire and maternal-grandsire among all genotyped animals, and found that there were 2919 individuals with more than one genotyped relative, and 140 individuals did not have any genotyped relatives.
To assess imputation accuracy, cross-validation was used, with the dataset randomly divided into three approximately equal portions. Two of the portions were used for training the imputation models, and the remaining portion was used for testing imputation accuracy. To compare imputation accuracy among methods, we focused on three representative chromosomes: 1 (longest), 16 (moderate size) and 28 (one of the shortest). After data editing and quality control, there were 3348 SNPs on chromosome 1, 1628 SNPs on chromosome 16 and 944 SNPs on chromosome 28 in the training sets. In the testing sets, there were 357, 192 and 103 SNPs with known genotypes on these three chromosomes, respectively, which corresponded to subsets of 5K (now known as the Illumina BovineLD 7K assay; Boichard et al., Reference Boichard, Chung, Dassonneville, David, Eggen, Fritz, Gietzen, Hayes, Lawley, Sonstegard, Van Tassell, Vanraden, Viaud-Martinez and Wiggans2012) genotypes. All of the remaining genotypes for animals in the testing set were treated as ‘missing’ and were subsequently imputed (Table 1).
Table 1. Number of animals and number of SNP markers with known genotypes in the training and testing sets

(ii) Imputation programs
The six imputation software packages used to impute ‘missing’ genotypes in the testing set were Beagle3.3 (Browning & Browning, Reference Browning and Browning2009), IMPUTE2.0 (Howie et al., Reference Howie, Donnelly and Marchini2009), fastPHASE1.4 (Scheet & Stephens, Reference Scheet and Stephens2006), findhap version 2 (VanRaden et al., Reference VanRaden, O'Connell, Wiggans and Weigel2011), AlphaImpute (Hickey et al., Reference Hickey, Kinghorn, Tier, Wilson, Dunstan and van der Werf2011) and Fimpute version 2 (Sargolzaei et al., Reference Sargolzaei, Chesnais and Schenkel2011).
The first three packages use population-based approaches. fastPHASE (version1.4) package (fPH) is based on the idea that haplotypes in a population tend to cluster into groups of similar haplotypes over short regions. This package allows membership in haplotype clusters to change as the analysis moves along the chromosome, using a hidden Markov model (HMM) to describe each observed haplotype as a mosaic of a small number of common haplotypes. Beagle3.3 (Bgl) is based on a graphical model that constructs a tree of haplotypes that are present in the reference population, and then summarizes it in a direct acyclic graph (DAG) by joining nodes of the tree based on haplotype similarity. When imputing biallelic markers with alleles A and B in unrelated individuals, for example, posterior genotype probabilities are calculated by summing the probabilities of the HMM states that correspond to each of the AA, AB and BB genotypes. The probability of a missing genotype is computed by averaging posterior genotype probabilities over multiple iterations (Browning & Browning, Reference Browning and Browning2009). This method is attractive because it can adapt to the local haplotype diversity that occurs in the data, similar to fastPHASE, but with a variable number of clusters across a region (Marchini & Howie, Reference Marchini and Howie2010). Most HMM-based imputation methods simultaneously estimate missing genotypes and analytically integrate over the unknown phase of SNPs typed in both the study sample and the reference panel. However, IMPUTE2.0 (Imp) proposes to alternately estimate haplotypes at SNPs which are typed in both the study and the reference samples and imputes alleles at SNPs which are not typed in the study sample, but are typed in the reference panel. Separating the phasing and imputation steps allows Imp to place more computational effort on phasing, and the extra computation used in this step is largely balanced by the quick haploid imputation in the step that follows.
In the second group of imputation packages, AlphaImpute (Alp) calculates allele probabilities using segregation analysis based on long-range phasing (Kong et al., Reference Kong, Masson, Frigge, Gylfason, Zusmanovich, Thorleifsson, Olason, Ingason, Steinberg, Rafnar, Sulem, Mouy, Jonsson, Thorsteinsdottir, Gudbjartsson, Stefansson and Stefansson2008) and haplotype library imputation. Alp uses information from multiple surrogate parents and a more robust definition of surrogacy using the concepts of cores and tails (Hickey et al., Reference Hickey, Kinghorn, Tier, Wilson, Dunstan and van der Werf2011). Missing alleles are imputed by matching the allelic probabilities from the segregation analysis to the haplotypes from the phasing step. Hence, Alp is viewed primarily as a family-based imputation package, though it can use information from unrelated animals as well. The findhap version 2 package (fhap) accounts for both population-based and family-based haplotypes in two steps. In the first (population-based) step, it divides chromosomes into blocks of ‘x’ SNPs and generates a library of haplotype blocks, which are sorted by frequency. Haplotypes from low density panels are searched in the library until a match is found. Unknown alleles are replaced by alleles from the matched haplotype. The animal's second haplotype is obtained by removing its first haplotype from its genotype and matching the second haplotype with haplotypes in the library. In the following step, both pedigree and population methods are used to locate matching haplotypes. Fimpute version 2 (Fimp) reconstructs haplotypes using family information, and uses information from parents, ancestors, progeny and sibs to perform family imputation. Next, it performs population imputation using a haplotype search based on a sliding window approach (i.e. walking along each chromosome using different window sizes).
(iii) AdaBoost-like ensemble algorithm
An AdaBoost-like algorithm was designed to combine imputed results from the aforementioned software packages. A wrapper program was used to coordinate individual packages and to implement computations for the proposed ensemble method. Let X be a set of imputed genotypes, and y be a vector of observed (‘true’) genotypes at a given SNP locus. Define T=6 to be the number of independent classifiers (i.e. the imputation software). Given a training set of N individuals, we have S=[(x 1, y 1), … ,(xi , yi ), … ,(xN , yN )], where xi ∊X=(xi 1, xi 2, xi 3|i=1, 2, … , N), yi ∊y=(g 1, g 2, g 3), and g 1, g 2 and g 3 are the three genotypes at the SNP, in question, for individual i in the training sample.
Initialize: each individual was assigned with an equal weight, W 1(i)=1/N, for i=1, … , N.
Training: For t=1, 2 , …, T classifiers
-
1. Call classifier t, which in turn generates hypothesis ht (i.e. inferred haplotypes and genotypes in the training set).
-
2. Calculate the error of ht :
where I(ht (xi )≠yi ) is an indicator function that is equal to 1 when ht (xi )≠yi and 0 otherwise.
Looping is aborted if ∊ t >1/2.
-
3. Set
-
4. Update the weight distribution Wt (i) for next classifier as
Testing: In the testing set, each ‘unknown’ genotype is classified via the so-called ‘weighted majority voting’. Briefly, the wrapper program:
-
1. Computes the total vote received by each genotype (class)
where I′(ht (xi )=gj ) is an indicator function that is equal to 1 when ht (xi )=g j and 0 otherwise. -
2. Assigns the genotype (class) that received the largest total vote as the final (‘putative’) genotype.
Above, the algorithm maintains a weighted distribution Wt
(i) of training samples xi
, for i=1, …, N, from which a sequence of training data subsets St
is chosen for each consecutive classifier (package) t. Initially, the distribution of weights is uniform, meaning that all samples contribute equally to the error rate. Next, the logit β
t
of the rate of correctly classified samples is calculated for classifier t. A higher β
t
is an indicator of better performance; for instance, when ∊
t
=0.5, β
t
takes the value 0, and increases as ∊
t
→0. Then, the distribution update rule is as follows: the weights of samples that are classified correctly by the current method are unchanged, whereas the weights of the misclassified instances are increased by a factor of ![]() . Hence, by iterating classifiers, the algorithm tends to focus on increasingly difficult samples. At the end, a weighted majority voting is used, and the class (genotype) that receives the largest total vote from all classifiers is the ensemble decision. This voting scheme is like that used in AdaBoosting.
. Hence, by iterating classifiers, the algorithm tends to focus on increasingly difficult samples. At the end, a weighted majority voting is used, and the class (genotype) that receives the largest total vote from all classifiers is the ensemble decision. This voting scheme is like that used in AdaBoosting.
(iv) Bootstrap sampling and parallel computing
Bootstrapping was used to generate empirical confidence intervals of imputation accuracy for the six packages and for the ensemble systems as well. For each method, 50 replicates were created by drawing random samples with replacement from the original testing set, each conducted on the genotype data for one of the three chromosomes, and the size of each bootstrap sample equalled the size of the original testing set. Finally, summary statistics were computed from the 50 bootstrap samples. Note that the distribution is conditional on the training set.
Given six independent packages, there were 6!=720 combinations, each defining a unique ensemble system. The computing task was formidable. For example, given this design, there were a total of (720+6)×50×3=1 08 900 independent jobs. Hence, distributed high-throughput computing solutions were utilized, and these jobs were submitted to run on the University of Wisconsin Condor Systems and Open Science Grid (Wu et al., Reference Wu, Hayrettin, Duan, Bessinger, Bauck, Woodward, Rosa, Weigel, de Leon, Taylor and Gianola2012).
(v) Evaluation of imputation accuracy
Genotype error was scored as 0 when the imputed and observed marker types were identical or 1 for otherwise. In other words, only when the two imputed alleles were the same as the observed two alleles was regarded as correct. Here, the genotypes ‘A/B’ and ‘B/A’ were considered to be the same. Error counting only considered markers/animals where observed marker types were not missing in the original non-imputed dataset. The error rate was calculated as the total number of errors divided by the number of imputed loci. This gives the number of falsely predicted genotypes. The imputation accuracy is one minus the error rate. Zhang & Druet (Reference Zhang and Druet2010) and Dassonneville et al. (Reference Dassonneville, Brøndum, Druet, Fritz, Guillaume, Guldbrandtsen, Lund, Ducrocq and Su2011) reported other ways of measuring error rate.
3. Results and discussion
(i) Comparing imputation accuracy among software packages
The six packages varied in imputation accuracy when evaluated on Angus chromosomes 1, 16 and 28 (Table 2). Bgl had the greatest imputation accuracy on all three chromosomes, followed by Fimp and fhap. On chromosome 1, for example, mean imputation accuracy obtained with Bgl was 0·9858 and that obtained with each of the remaining five packages ranged from 0·9084 (Alp) to 0·9788 (Fimp). Similar patterns were observed on the other two chromosomes: imputation accuracy varied from 0·9092 (Alp) to 0·9837 (Bgl) on chromosome 16, and from 0·8677 (fPh) to 0·9712 (Bgl) on chromosome 28.
Table 2. Summary statistics of the bootstrap distribution of imputation accuracy obtained using each of the six software packages on chromosomes 1, 16 and 28Footnote * Footnote † Footnote ‡

* Bgl, Beagle3.3; Imp, IMPUTE2.0; fPh, fastPHASE1.4; fhap, findhap version 2; Alp, AlphaImpute; Fimp, Fimpute version 2.
† Min, minimum value; Max, maximum value; sd, standard deviation.
‡ Accuracy obtained from 50 boostrap replicates for each imputation package.
Bgl, Imp and fPh, which impute missing SNP genotypes using LD information, were primarily developed for humans (Li et al., Reference Li, Willer, Sanna and Abecasis2009; Marchini & Howie, Reference Marchini and Howie2010), but have been applied to animals as well (Weigel et al., Reference Weigel, Van Tassell, O'Connell, VanRaden and Wiggans2010; Calus et al., Reference Calus, Veerkamp and Mulder2011; Hayes et al., Reference Hayes, Bowman, Daetwyler, Kijas and van der Werf2011; Johnston & Kistemaker, Reference Johnston and Kistemaker2011; Saatchi et al., Reference Saatchi, McClure, McKay, Rolf, Kim, Decker, Taxis, Chapple, Ramey, Northcutt, Bauck, Woodward, Dekkers, Fernando, Schnabel, Garrick and Taylor2011). Within the three population-based packages, we found that Bgl consistently yielded the best imputation accuracy on all three chromosomes. In the present study, Bgl was used with the assumption that all animals were unrelated, although this package could handle parent–offspring trios and parent–offspring pairs. The latter option, however, was not used because making use of such information would consume a high amount of memory with our data size. Nevertheless, imputation accuracy was high even when relationship information was ignored. This is in agreement with observations by Browning & Browning (Reference Browning and Browning2009) .
Alp, Fimp and fhap can utilize both pedigree and LD information in imputation. Within these, imputation accuracy was the greatest with Fimp and the poorest with Alp. Overall, these three packages did not show any obvious improvement in imputation accuracy over the population-based packages. Although Fimp and fhap yielded better imputation accuracy than two of the population-based packages, Imp and fPH, none outperformed Bgl, which had the greatest imputation accuracy overall. Our results imply that simple, sequential utilization of population and family information, as we did with Fimp and fhap, does not necessarily produce better imputation accuracy than population-based methods. An explanation may be the existence of a considerable amount of LD in this Angus population; Bgl can capture familial information using long identical haplotypes (from close relatives) and is efficient with both close and distant relatives. Hence, well-designed population-based algorithms could predict the missing genotypes fairly well.
We observed that imputation accuracy was positively associated with chromosome size. Chromosome 1 is the longest, chromosome 16 has moderate size and chromosome 28 is the shortest of the chromosomes studied, and imputation accuracy was greatest for chromosome 1, intermediate for chromosome 16 and poorest for chromosome 28. This association with size may be due to the fact that longer chromosomes harbour more markers, and hence provide more information for inferring unknown haplotypes and imputing missing genotypes. Another reason, possibly related, is that imputation accuracy suffers at the beginning and end of the chromosomes. In longer chromosomes, these two problem regions are relatively less important than in shorter chromosomes, leading to higher accuracy. Although the 7K has been specifically designed to overcome this issue by having more low density markers at the ends, the issue seems to remain. Weigel et al. (Reference Weigel, Van Tassell, O'Connell, VanRaden and Wiggans2010) reported mean imputation accuracy from 80 to 95% when animals were genotyped with a medium-density panel comprising 2000–4000 SNPs; less than 80% when animals were genotyped for 1000 SNPs or less, and greater than 95% when animals were genotyped for more than 8000 SNPs. However, their study was performed with a single chromosome.
Computational requirements are also one important issue in imputation. Bgl, Imp, fPH and Alp run on a per chromosome base, whereas fhap and Fimp are both parallel programs that can impute all chromosomes simultaneously. In this study, all jobs were submitted to run in parallel in the University of Wisconsin Condor Systems and the Open Science Grid (OSG). Each chromosome could be imputed by a different CPU, so we did not record the specific computing time for each of the jobs. In general, Fimp and fhap consume the least computing time due to their parallel nature. Alp is faster than Bgl and fPH, and fPH is the slowest software. Take chromosome 1 as the example, the imputation took around 1 week with fPh, one day or so with Bgle, and not more than 1 h with Fimp and fhap. Memory consumption also varied dramatically with these software packages. Imp needs to break chromosomes into pieces of more manageable size, hence it does not pose computing time and memory problems for parallelized running. In contrast, Bgl had a memory problem – it required more than 6G memory for chromosome 1 in this study.
(ii) Comparing imputation accuracy between ensemble methods and individual packages
As none of the software packages provides perfect imputation, combining results from two or more packages may bring an improvement in accuracy. As previously noted, while many animals have moderate-density genotypes for both parents, the proportion of correctly imputed genotypes could increase with more relatedness between genotyped ancestors and target animals (Weigel et al., Reference Weigel, Van Tassell, O'Connell, VanRaden and Wiggans2010; Johnston & Kistemaker, Reference Johnston and Kistemaker2011). For this reason, a two-step approach has been proposed, in which animals with genotyped parents (or other close ancestors) are processed first using a family-based method, and animals lacking such information are processed subsequently using a population-based algorithm (Druet & Georges, Reference Druet and Georges2010). However, as indicated by our results, simply utilizing family- and population-based information sequentially will not necessarily give the best predictions. Further, Weigel et al. (Reference Weigel, Van Tassell, O'Connell, VanRaden and Wiggans2010) suggested that such an approach could be considered as a form of ‘boosting’, in which two or more complementary models, each of which treats a significant percentage of the data optimally, are implemented jointly to solve the imputation problem.
AdaBoost, which is a more general version of the original boosting algorithm (Freund & Schapire, Reference Freund and Schapire1996), is flexible and can ensemble results from various weak classifiers, resulting in an improved accuracy. The ensemble method proposed here resembled AdaBoost, yet it had some slight differences. Like AdaBoost, our ensemble method computed weights sequentially for all the individual imputation packages, and combined results through weighted majority voting of the genotype classes predicted by individual packages. The results indicated that the proposed ensemble method was better than each of the individual imputation methods (Fig. 1). The extent of improvement, however, was small, possibly because all six packages imputed ‘missing’ genotypes with high accuracy, so there was not much space for further improvement.
Fig. 1. Box plots of imputation accuracy on (a) chromosome 1, (b) chromosome 16 and (c) chromosome 28, obtained using six imputation software packages and five ensemble methods. Results are obtained from 50 bootstrap replicates. For x-axis labels, 1 = ‘Beagle3.3’; 2 = ‘IMPUTE2.0’; 3 = ‘fastPHASE1.4’; 4 = ‘findhap version 2’; 5 = ‘AlphaImpute’; 6 = ‘Fimpute version 2’; 7 - 11 = five ensemble systems.
Within the 720 unique ensemble systems, imputation accuracies of the top five ensemble systems, evaluated on each of the three chromosomes, were compared with those of each of the individual packages (Fig. 1). These ensemble systems performed similarly to each other, and all were at least as good as each of the six individual imputation packages. Their performance over the 50 bootstrap samples is shown in Fig. 2. We observed that imputation accuracy varied with the order of the software packages in the ensemble system. For each of the three chromosomes, all top 120 ensemble systems with the highest accuracy of imputation had Bgl as the first classifier (Appendix Tables A1–A3). The ranks of the top 120 ensemble systems, however, differed by chromosome. For example, ensemble system 67 (Bgl-Alp-Fimp-Imp-fPH-fhap, Appendix Table A4) ranked second with data from chromosomes 1 and 28, but it ranked first with data on chromosome 16. This consistency was also true with ensemble system 61 (Bgl-Alp-fhap-Imp-fPH-Fimp): it ranked fifth on chromosome 1, fourth on chromosome 16 and first on chromosome 28. Nevertheless, there were also ensemble systems that showed relatively large changes in rank between chromosomes. For example, ensemble system 109 (Bgl-Fimp-Alp-Imp-fPH-fhap) ranked fourth on chromosome 1 and third on chromosome 16, but it was 38th on chromosome 28. Ensemble systems with Fimp and Bgl as the first two classifiers also had high imputation accuracy (data not presented). The lowest imputation accuracy was observed with fPH and Imp appearing as the first two classifiers (data not presented). Similarly, Johnston & Kistemaker (Reference Johnston and Kistemaker2011) reported varied imputation accuracy arising from different sequences of imputation packages in their two-step approach. They first conducted imputation using Fimp, and then exported results to either fhap or Bgl for a second-step imputation. They found that Fimp plus Bgl could provide more accurate imputation than the team represented by Fimp and fhap.
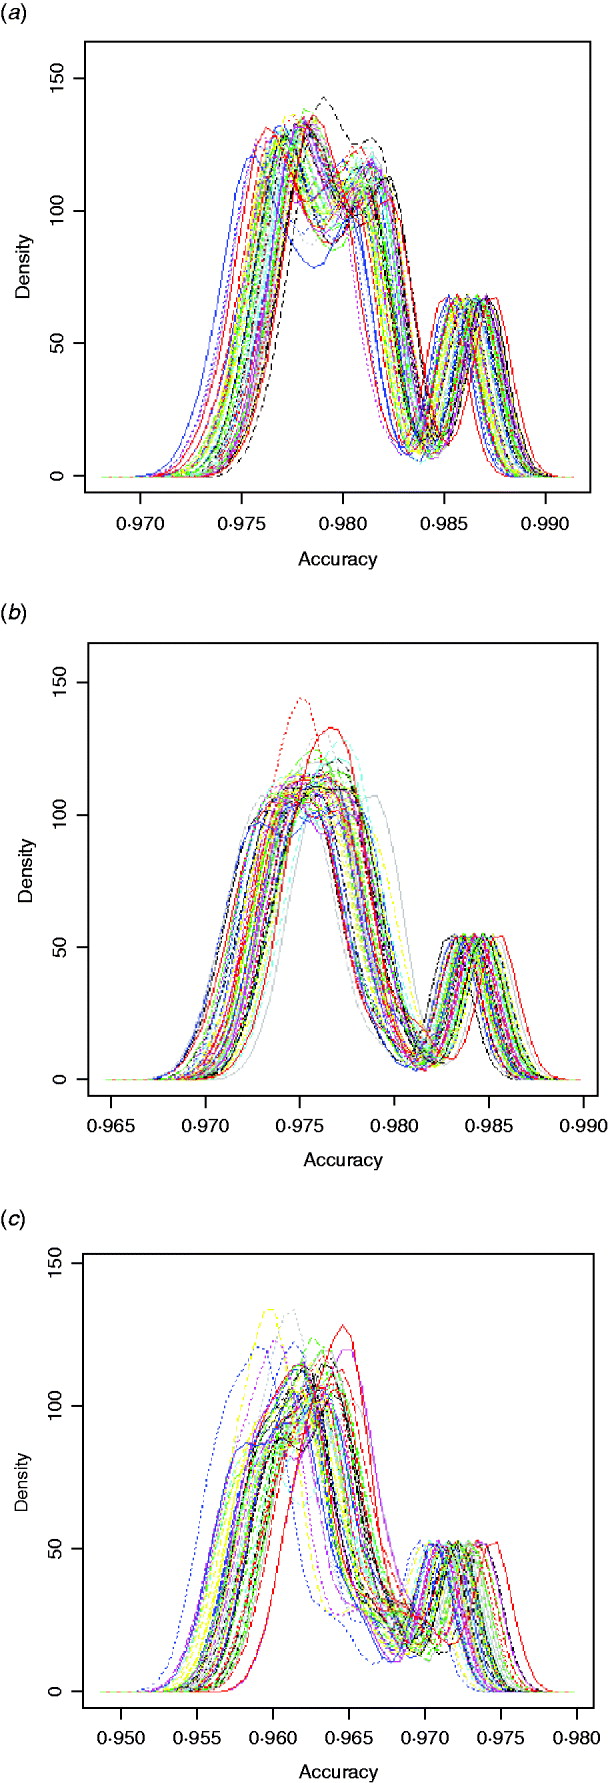
Fig. 2. Kernel density plots of imputation accuracy for 720 ensemble methods obtained on (a) chromosome 1, (b) chromosome 16 and (c) chromosome 28.
Our results indicate that an ensemble method starting with the best individual classifier (i.e. Bgl) could have the best overall performance. Also, alternating population-based and family-based approaches could enhance imputation as well. Therefore, optimal ensemble systems, as supported by the present data, turned out to be those starting with Bgl, followed by one or two of the packages that can use pedigree information for imputation (e.g. fhap, Fimp and Alp). For examples, ensemble systems 67 and 61 satisfied the above-mentioned feature, and ranked within the top five when evaluated with genotype data on the three chromosomes.
We proposed an ensemble-based imputation method that involves using several imputation software packages jointly. Alternatives would include either developing a single method that combines all sources of information in some optimal manner, or perhaps using a pair of existing methods that exploit complementarity between sources. We did not explore the latter approach because our study focused on testing whether ensemble methods behave as expected from theory, in comparison with some commonly used imputation software packages. Boosting algorithms have been developed for enhancing weak learners, so when the extant methods are strong classifiers, there is little room for improvement. This was confirmed in our study, the first of its kind in the context of genotype imputation. We conjecture that the same situation would hold if the comparison involved a method that can utilize all sources of information. Our study showed that the proposed ensemble method can perform as well as, if not better, than any of the individual imputation methods. At the same time, the ensemble method provides a solution to solving inconsistencies among different imputation methods. In order to decrease computational cost, it is not necessary to include all the six imputation software packages in practice. The paper recommended some general conclusions on how to combine different independent imputation packages in ensemble-based methods.
(iii) An application: imputation of moderate-density genotypes in Angus cattle
Based on a 5K-genotype panel, moderate-density (50K) genotypes on 29 chromosomes were imputed for 3078 animals using the aforementioned six imputation packages and five ensemble systems. All five selected ensemble systems had Bgl and Alp as the first two classifiers, and were as follows: (1) Bgl-Alp-fhap-Imp-fPH-Fimp, (2) Bgl-Alp-Fimp-Imp-fPH-fhap, (3) Bgl-Alp-Fimp-fPH-Imp-fhap, (4) Bgl-Alp-Imp-fhap-fPH-Fimp and (5) Bgl-Alp-Imp-Fimp-fPH-fhap. Imputing accuracies using the six packages and the five ensemble systems are illustrated in Fig. 3. The five ensemble systems gave similar imputation results, and were consistently better than each of the six imputation packages. Among the 29 autosomes, imputation accuracy ranged from 0·9715 (chromosome 28) to 0·9855 (chromosome 1) with the five ensemble systems, and it varied from 0·8869 (Alp, chromosome 10) to 0·9853 (Bgl, chromosome 1) with the six independent packages.
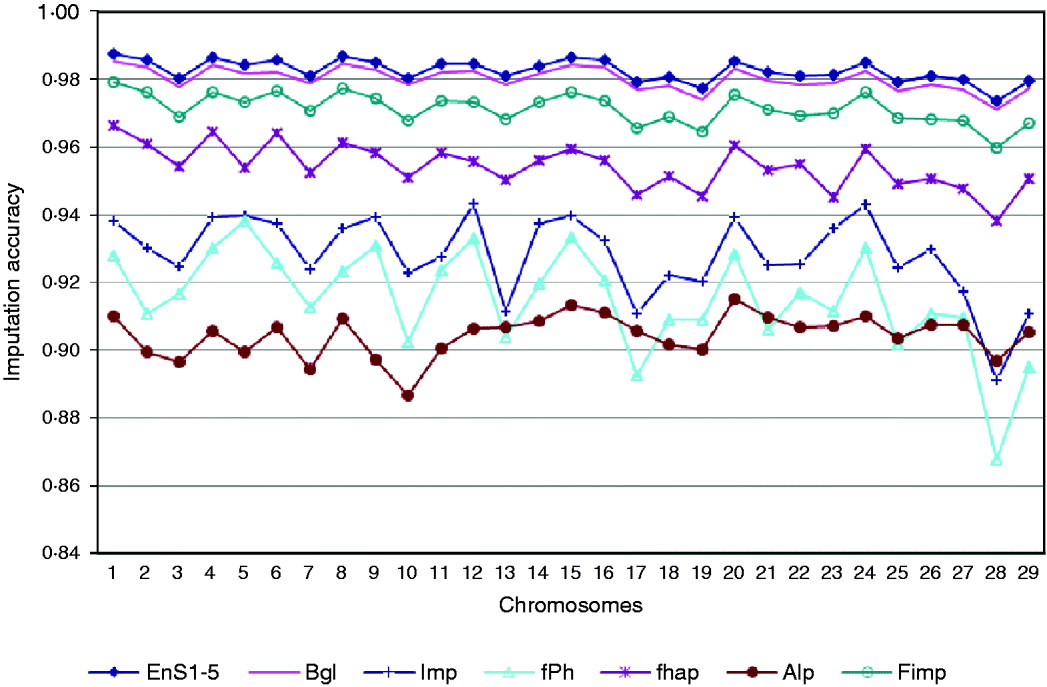
Fig. 3. Comparison of imputation accuracy evaluated on 29 autosomes in registered Angus cattle using 6 independent imputation packages and 5 ensemble systems. For EnS1-5, the figure gives the average accuracy of the 5 ensembles.
We did not observe a 100% imputation success rate in any of the 29 chromosomes. This could be due to, for example, small training sample size, density of markers, or degree of genetic similarity between the training and testing samples. Genotyping error rate may also be a crucial factor that affects imputation accuracy. As there are genotype errors in the reference populations, using these genotypes in training would cause errors in imputation results. Genotyping errors might also be present in the testing set.
It would seem that attaining 100% imputation accuracy may not be possible in practice with current genotyping technologies and imputation methods. Zhang & Druet (Reference Zhang and Druet2010) reported error rates of 3–4% using DAGPHASE (Druet & Georges, Reference Druet and Georges2010). Daetwyler et al. (Reference Daetwyler, Wiggans, Hayes, Woolliams and Goddard2011) reported slightly higher error rates with their implementation of the long-range phasing algorithm, possibly because they used a smaller reference population. Other factors that may be crucial for enhancing imputation accuracy are as follows. First, it is important that there is a strong genetic similarity between the training and testing populations, since imputation accuracy is likely to depend on the genetic distance of target individuals from the reference population (Zhang & Druet, Reference Zhang and Druet2010). If an individual does not have parents or relatives in the training sample, and if there is no intervening recombination, the chance of observing a haplotype of this individual in the training set would be small. Next, given considerable genetic similarity between training and testing populations, the training set should be large enough to capture all of the haplotypes in the testing set. If a target haplotype is encountered which has not been previously observed in the training sample, the imputation of missing genotypes is unlikely to be accurate. Using a large training sample is also important to ensure that rare alleles are captured and accurately imputed into target individuals. Finally, a sufficient number of markers is essential for accurate imputation using population-based methods, to assure that there is substantial linkage disequilibrium between markers. Otherwise, population-based algorithms such as those implemented in Bgl, Imp and fPH will perform poorly.
Again, we observed a slight decrease in imputation accuracy for the shorter chromosomes, but this trend was not as evident as in the previous applications involving chromosomes 1, 16 and 28 only. These results were obtained as the averages of 50 replicates for each chromosome, but the results in this section were obtained from a single analysis. This could partially explain the difference. As no replication was performed, chance could contribute non-trivially to imputation results, leading to random fluctuation in accuracy. It is possible that the trend could become more evident if the results were obtained as averages across a large number of bootstrap replicates.
4. Conclusions
Genotype imputation can be viewed as a classification problem. Several imputation methods (i.e. software packages) are available, but results may be inconsistent among them. Ensemble methods can be used to solve such inconsistencies, and thus further improve imputation accuracy. This was corroborated in our study. The proposed ensemble method resembles AdaBoost, in that weights for each of the classifiers are computed sequentially and imputed genotypes are decided by weighted majority voting. The idea is intuitive: classifiers that have a good performance during training are rewarded with higher voting weights than the others. Our ensemble systems combined results from six imputation packages: Bgl, Imp, fPH, Alp, fhap and Fimp. In this set, Bgl and Fimp had the highest imputation accuracy. The proposed ensemble systems improved imputation accuracy in our data, but the degree of improvement depended on the order of these classifiers in the ensemble systems. The best ensemble systems were those with Bgl as the first classifier, followed by one or two software packages that used pedigree information during imputation. Rotating different types of imputation packages in the ensemble systems is desirable, because training by consecutive classifiers may be better geared towards increasingly hard-to-classify instances (Polikar, Reference Polikar2006).
Further improvements through adjustment of the proposed ensemble method may be possible. First, one may form a committee of classifiers with higher diversity, each focusing on a different scenario guiding imputation. This is an essential idea of AdaBoost, which works well provided that each classifier can produce an imputation that is slightly better than a random guess. We have included two types of imputation packages, i.e. family-based and population-based. Some more options include imputation based on population frequencies only (a weak classifier) and imputation based on posterior probabilities of unknown genotypes given observed phenotypes and prior information about the genotypes (also a weak classifier). The latter two options, however, were not investigated, because the six packages we used provided relatively accurate imputation, and including these two weak classifiers would have made little difference in imputation accuracy. Also, individual packages can be modified so that a set of classifiers can be trained more efficiently and adaptively, but this may not always be possible due to the lack of availability of source code. Nevertheless, there are some ensemble methods that do not require modification of each independent imputation package, such as stacked generalization (Wolpert, Reference Wolpert1992; Polikar, Reference Polikar2006) or mixture of experts (Jacobs et al., Reference Jacobs, Jordan, Nowlan and Hinton1991; Jordan & Jacobs, Reference Jordan and Jacobs1994). These two ensemble methods can use the outputs of a set of individual classifiers as inputs to a second level meta-classifier, which then learns the mapping between the ensemble outputs and the correct classes. These methods may be worth investigating in future studies.
Finally, while AdaBoost is well known for its capacity to boost the classification performance of a set of weak classifiers, we proposed an AdaBoost-like ensemble algorithm for combining results from variable imputation methods (packages), each of which may not necessarily be weak classifiers. Given the fact that some of the current methods, if not all, produce highly accurate imputation results, the scope for improving imputation accuracy may be limited for ensemble-based systems. On the other hand, because no independent method can make a perfect imputation, the proposed ensemble provides a more-robust system for solving inconsistencies among existing imputation methods.
This research was supported by the Wisconsin Agriculture Experiment Station, and a Genomic Selection Grant by Merial Ltd. JFT was supported by National Research Initiative grants number 2008-35205-04687, 2008-35205-18864 and 2009-35205-05099 from the USDA Cooperative State Research, Education and Extension Service, and grant number 2009-65205-05635 from the USDA Agriculture and Food Research Initiative.
Appendix A. Summary statistics of imputation accuracy for 720 ensemble systems
Table A1. Evaluated on bovine chromosome 1 (BTA1)
Table A2. Evaluated on bovine chromosome 16 (BTA16)
Table A3. Evaluated on chromosome 28 (BTA28)
Table A4. List of the top 120 ensemble systems and combinations