


Vitamin D has attracted a lot of interest as new knowledge regarding its non-hormonal, intracrine, paracrine and immunological actions has been revealed. This indicates that suboptimal levels of vitamin D may have an impact on health beyond bone homeostasis( Reference Hewison 1 – Reference Chun, Adams and Hewison 3 ) and may possibly play a role in the onset of diseases such as type 1 diabetes( Reference Papandreou, Karabouta and Rousso 4 , Reference Hyppönen, Läärä and Reunanen 5 ). Current studies from various countries have documented a high prevalence of suboptimal status of vitamin D among children, adolescents and young adults( Reference Rockell, Green and Skeaff 6 – Reference Kumar, Muntner and Kaskel 8 ). The main sources of vitamin D come from exposure of the skin to sunlight( Reference Misra, Pacaud and Petryk 9 ) as well as vitamin D-containing foods( Reference Van Horn, Bausermann and Affenito 10 ) such as fish-liver oil( Reference Thorgeirsdottir, Valgeirsdottir and Gunnarsdottir 11 , Reference Gunnarsdottir, Helgadottir and Thorisdottir 12 ).
Few studies have explored the correlation between vitamin D intake and serum vitamin D concentrations in children. The majority of studies are carried out in adolescents and adults. However, a recent study on pre-school children in northern Sweden (63°N) showed that 40 % of children had suboptimal vitamin D status (defined as serum 25-hydroxyvitamin D (s-25(OH)D) <50 nmol/l) during winter, despite intake of vitamin D in accordance with the Nordic and Swedish nutrition recommendations (7·5 μg/d)( Reference Ohlund, Silfverdal and Hernell 13 ). Season, ethnicity, fortified foods, BMI and physical activity levels have been shown to be independent predictors of vitamin D insufficiency in adolescents( Reference Gordon, DePeter and Feldman 14 ).
Populations at high latitudes appear to be at high risk of low vitamin D status, especially during winter( Reference Holick 15 , Reference Dalgård, Petersen and Schmedes 16 ). The recommended dietary intake (RDI) of vitamin D for Icelandic children and adults up to 60 years of age is 10 μg/d, equivalent to 5 ml of cod-liver oil daily( 17 ), which has been the main dietary source of vitamin D in the country for decades, but there is no tradition for vitamin D fortification of foods. Recently food habits among adults have changed at the cost of both fish and fish-liver oil intake( Reference Thorgeirsdottir, Valgeirsdottir and Gunnarsdottir 11 ). Fish-liver oil intake used to be mandatory for children in Iceland and was given in schools until about 1970( Reference Styrkársdóttir 18 ). Fish-liver oil is still given in kindergartens with breakfast, but given the recent changes in dietary intake among adults it could be questioned if the vitamin D status of Icelandic schoolchildren is sufficient.
The variability in the concentration of vitamin D in the blood is only partly explained by vitamin D consumption( Reference Sigurdsson, Franzson and Thorgeirsdottir 19 ). It has been stated that s-25(OH)D levels are up to 24 % lower during winter compared with summer and they are inversely correlated with parathyroid hormone (PTH) levels in 14-year-old children, but the association between s-25(OH)D and PTH seems to be dependent on age, increasing with increasing age( Reference Gordon, DePeter and Feldman 14 ). Higher s-25(OH)D concentrations have been reported in boys compared with girls both during childhood and adolescence (1–21 years), although the reason is unclear( Reference Rockell, Green and Skeaff 6 – Reference Kumar, Muntner and Kaskel 8 ). The influence of physical activity or fitness as a predictor of vitamin D status in children is virtually unknown. In children sedentary behaviour seems to be a risk factor for low vitamin D status, due to lower outdoor activities and sunlight exposure( Reference Kumar, Muntner and Kaskel 8 ). Cardiorespiratory fitness (CRF) might act as a marker for outdoor activities and sunlight exposure. BMI has been shown to associate adversely with vitamin D status, likely because of decreased bioavailability of vitamin D and its deposition in body fat( Reference Wortsman, Matsuoka and Chen 20 ). We hypothesize that vitamin D intake and CRF are positively associated with s-25(OH)D and BMI negatively, and that there is no gender difference in s-25(OH)D.
The aim of the present study was to investigate vitamin D intake and status in 7-year-olds in Reykjavík (64°N) in September until November. A secondary aim was to assess the association of s-25(OH)D with total vitamin D intake, as well as with the locally specific vitamin D sources, physical variables like CRF and BMI, and to explore possible gender differences.
Methods
Sample
The study sample was obtained from an intervention study on the lifestyle of 7–9-year-old children aiming to increase physical activity and promote healthy diet in 2006–2008. The present study uses the children's baseline values. The children invited came from six randomly selected schools in the Reykjavík area in Iceland in 2006( Reference Kristjansdottir and Thorsdottir 21 ). All children in the second grade (born 1999) in the schools were invited to participate (n 265) and had height and weight measured. Written consent of both parent and child had to be obtained for participation in the study. Of the 265 children invited to participate, 187 (70·6 %) returned complete 3 d food records (FR). After excluding under-reports (n 22), 165 (62·3 %) valid 3 d FR were included in the data analysis( Reference Kristjansdottir and Thorsdottir 21 ) (Fig. 1). Due to a lower participation rate and a few unsuccessful attempts at collecting blood specimens, a total of 158 (59·6 %) children had usable blood samples taken. There were no significant differences in BMI or ethnicity between the children participating and those not participating in the study. A total of 120 (45·3 %) participants both returned valid 3 d FR and had blood samples taken, representing about 2·7 % of all children in the second grade in Iceland in 2006. The study was conducted according to the guidelines laid down in the Declaration of Helsinki and all procedures involving human subjects were approved by the National Bioethics Committee (VSN b2006050002/03) as well as the Icelandic Data Protection Commission. Informed consent was obtained from all participants.
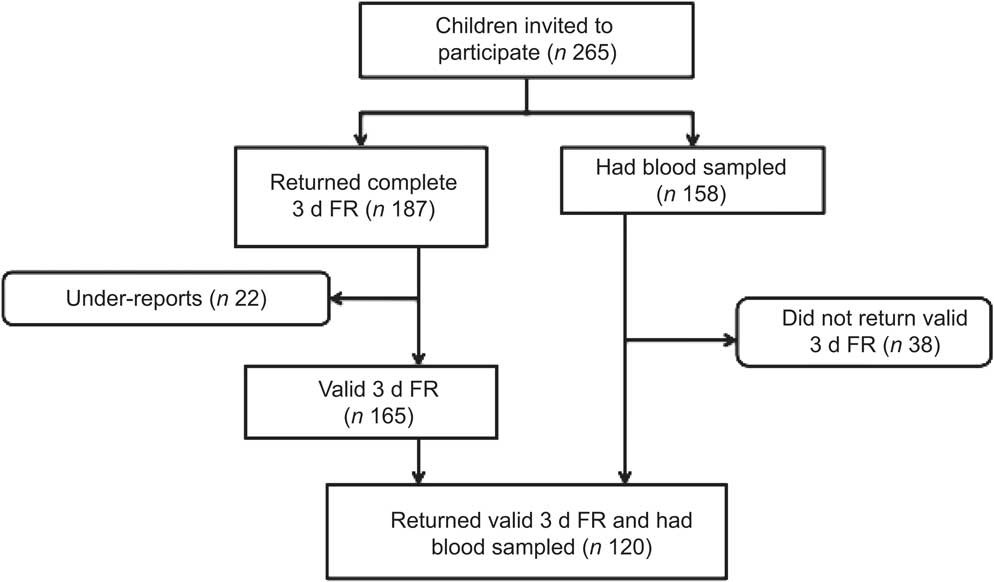
Fig. 1 Flowchart showing the participation rate of the study (3 d FR, 3 d food record)
Dietary assessment methods
The dietary assessment method used was a 3 d FR. The 3 d FR was done over two weekdays and one weekend day. Data were collected evenly from September until the end of November( Reference Kristjansdottir and Thorsdottir 21 , Reference Kristjansdottir, Johannsson and Thorsdottir 22 ). Parental meetings were held at the time of measurements where instructions on how to record the diet were given. The parents weighed all food items for each child except for the school meal, which was recorded for each child by a trained nutritionist( Reference Kristjansdottir, Johannsson and Thorsdottir 22 ). Under-reporters (energy intake < 1·2 × estimated BMR) were excluded and not used in the calculations. Nutrient calculations were performed with ICEFOOD, using the Icelandic Nutrient Database as well as the Icelandic Nutrition Council Recipe Database 2002. All data on food and drink as well as fish-liver oil and supplement consumption were included in the data analysis( Reference Kristjansdottir, Johannsson and Thorsdottir 22 ). Total intake of vitamin D was calculated from all food and supplement intake( Reference Kristjansdottir and Thorsdottir 21 ). Among the children with s-25(OH)D concentration <50 nmol/l there were two who had consumed a non-specified multivitamin, which may indicate that the multivitamin included vitamin D.
Biochemical measurements
Blood samples were collected evenly at each school from the beginning of September until the end of November. Fasting blood samples were obtained using standard procedures after overnight fasting and serum samples were frozen immediately and kept at −80°C until analysis. Serum vitamin D (25(OH)D) was measured with a DiaSorin 25OHD RIA assay (DiaSorin, Stillwater, MN, USA) and PTH was measured by electro-chemiluminescence immunoassay (Elecsys 2010; Roche Diagnostics, Indianapolis, IN, USA)( Reference Hrafnkelsson, Magnusson and Sigurdsson 23 ). Suboptimal levels of vitamin D were defined as s-25(OH)D <50 nmol/l, and deficiency as s-25(OH)D <25 nmol/l( Reference Alonso, Díaz and García 24 ).
Fitness measurement
CRF was measured with a Monark ergometer bike with the main outcome as maximum watts per kilogram per person (W/kg per person). The study protocol from the European Youth Heart Study was followed when this test was administered( Reference Andersen, Harro and Sardinha 25 ). This maximal fitness test was run such that every 3 min the weight on the front wheel was increased by 20–25 W, depending on the participant's weight. Each participant had to keep a steady pace during the test of about 60 rpm and bike either until exhaustion or until no longer being able keep up the desired pace. A trained individual performed all CRF assessments. The same verbal encouragement protocol was used on all participants to motivate them during the test.
Statistical analyses
The statistical analyses were performed using the statistical software package IBM SPSS Statistics 20 for Windows. Distribution assessment was performed on the outcome variables by means of histograms and QQ plots. The distributions of intake variables were skewed; hence the Mann–Whitney U test was used when comparing gender differences for intake variables and week of autumn. s-25(OH)D was normally distributed, and the independent t test was used when comparing continuous parametric variables between gender (s-25(OH)D, height, weight, BMI, PTH and CRF). The χ 2 test was used to assess the relationship between suboptimacy and deficiency of s-25(OH)D and supplement intake. The variables are presented as median and interquartile range in Table 1. Spearman's correlation analysis was used to assess correlations between s-25(OH)D and week number in autumn, intake variables and physical variables. The level of significance used in all analyses was P ≤ 0·05. Simple linear regression and multiple linear regression analyses were performed to model the association between the primary dependent variable (s-25(OH)D) and independent variables (week of autumn, CRF and vitamin D intake), which had the strongest correlations with s-25(OH)D of the variables tested.
Table 1 Median and IQR of s-25(OH)D (nmol/l) and intakes of vitamin D (μg/d) and fish-liver oil (ml/d) in 7-year-old Icelandic girls and boys, Reykjavík, 2006

IQR, interquartile range; s-25(OH)D, serum 25-hydroxyvitamin D.
†Variables were tested for gender differences by using the Mann–Whitney U test, except for serum vitamin D which was tested using the independent t test.
Results
Diet and evaluation of serum vitamin D
The recommended intake of vitamin D (10 μg/d) was reached by thirty-seven children (22·4 %) and the recommended intake of fish-liver oil (5 ml/d) was reached by twenty-one children (12·7 %). Suboptimal vitamin D status was present in 103 children (65·2 %), five of whom (3·1 %) had deficient status (s-25(OH)D <25 nmol/l). In total, fifty-six of the children giving blood samples were taking fish-liver oil or other vitamin D supplements. Of the group of fifty-six children, twenty-eight children reached optimal vitamin D status (s-25(OH)D ≥50 nmol/l) with a median fish-liver oil intake of 4 ml/d and a median total vitamin D intake of 9·6 μg/d. Of the same group, twenty-eight children had suboptimal vitamin D status (s-25(OH)D <50 nmol/l) with a median fish-liver oil intake of 2·7 ml/d and a median total vitamin D intake of 8·1 μg/d; thereof, one child had deficient vitamin D status (s-25(OH)D <25 nmol/l) with a median fish-liver oil intake of 1·7 ml/d and a median total vitamin D intake of 4·2 μg/d.
Table 1 shows a significant gender difference for total vitamin D intake and fish-liver oil intake, where boys had higher intakes in both cases (P = 0·003 and P = 0·03, respectively). The median s-25(OH)D for the children was 45·1 nmol/l, with no significant gender differences.
No gender difference was found in the frequency of suboptimal status of vitamin D (<50 nmol/l) or vitamin D deficiency (< 25 nmol/l; P = 0·68, Table 2), despite the different intake levels of vitamin D. However, there was a significant difference between the frequency of suboptimal status of vitamin D and vitamin D deficiency between the groups taking and not taking fish-liver oil or other vitamin D supplements (P = 0·02), irrespective of gender.
Table 2 Frequency of suboptimal levels of vitamin D (s-25(OH)D <50 nmol/l) and vitamin D deficiency (s-25(OH)D <25 nmol/l) for the children in total (all blood values, n 158), and for the groups taking and not taking fish-liver oil or other vitamin D supplements (data presented are for the children who returned valid 3 d food records and had blood sampled, n 120); 7-year-old Icelandic girls and boys, Reykjavík, 2006
s-25(OH)D, serum 25-hydroxyvitamin D.
Significance values were computed with χ 2 tests. There was no gender difference in suboptimal levels or vitamin D deficiency for all samples (P = 0·68). There was a significant difference in suboptimal levels and vitamin D deficiency between those taking and not taking fish-liver oil or other vitamin D supplements (P = 0·02), irrespective of gender.
†A total of sixty-three girls and fifty-seven boys both returned 3 d food records and had blood tested (n 120).
Seasonal and dietary influences on serum vitamin D
Figure 2 shows the effect of week in autumn on s-25(OH)D during the sampling period from early September to late November (weeks 36–46). The concentration of s-25(OH)D ranged from 17·4 to 94·8 nmol/l. Levels of s-25(OH)D were significantly lower in November (36·7 nmol/l) than in September (59·9 nmol/l; P=0·001). Median values were <50 nmol/l for both supplemented children and non-supplemented children in November (data not shown). The median s-25(OH)D concentration for the vitamin D-supplemented children was higher than for those not supplemented, 49·2 nmol/l and 43·4 nmol/l respectively (P = 0·009; Fig. 3). The median intake of vitamin D for the supplemented group was 8·8 μg/d v. 2·0 μg/d for the non-supplemented group (data not shown). The correlation between s-25(OH)D (nmol/l) and serum PTH (nmol/l) was R 2 = 0·047 (Spearman's ρ = −0·159, P = 0·05; data not shown).
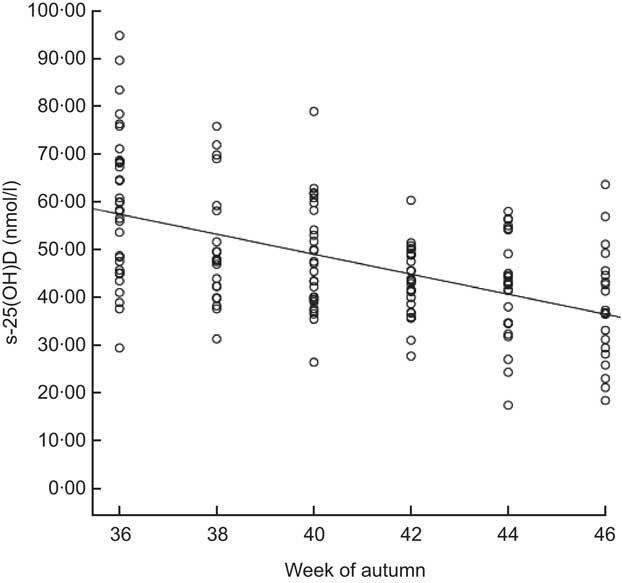
Fig. 2 Correlation between blood sample timing in autumn (weeks evenly distributed from week 36 to week 46) and serum 25-hydroxyvitamin D (s-25(OH)D) concentration (nmol/l) among 7-year-old Icelandic girls and boys (n 158), Reykjavík, 2006. Spearman's ρ = −0·496, P = 0·01; R 2 linear = 0·273. The concentration of s-25(OH)D decreased significantly between week 36 (59·9 nmol/l) and week 46 (36·7 nmol/l) according to the independent t test (P < 0·001)
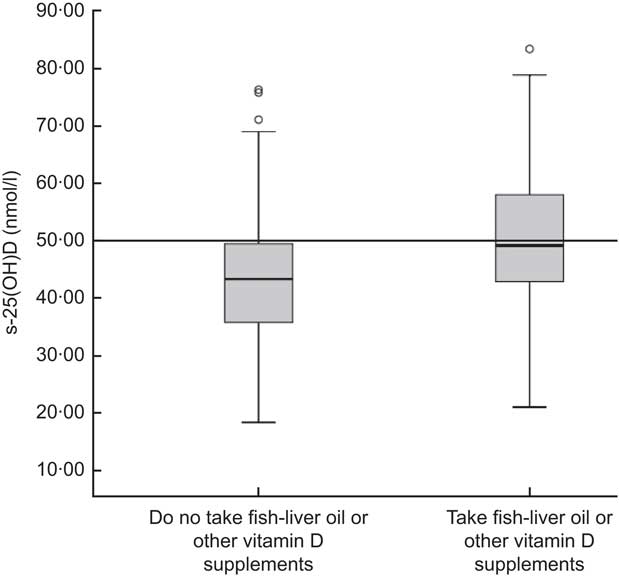
Fig. 3 Box-and-whisker plots† showing the difference in serum 25-hydroxyvitamin D (s-25(OH)D) concentration (nmol/l) between those taking vitamin D supplements (fish-liver oil or other vitamin D supplements) and those not taking vitamin D supplements among 7-year-old Icelandic girls and boys (n 120), Reykjavík, 2006. The median concentration of s-25(OH)D was not significantly different between the two groups according to the independent t test (P = 0·009). Median vitamin D intake for the group taking vitamin D supplements was 8·8 μg/d (equivalent to about 4·5 ml of fish-liver oil daily) and 2·0 μg/d for the group that did not take vitamin D supplements. There was a significant difference in vitamin D intake between the group taking vitamin D supplements and the one that did not (P < 0·001), based on the Mann–Whitney U test. †The line within the box represents the median value; the bottom and top edges of the box represent the 25th percentile and 75th percentile (i.e. the interquartile range), respectively; the bottom and top whiskers represent the minimum and maximum values, respectively; and the circles represent outliers. Optimal serum vitamin D status is ≥50 nmol/l (———)
Selected predictors associated with serum vitamin D
Table 3 shows that s-25(OH)D was negatively correlated with week of autumn, BMI and PTH, but positively correlated with intake of fish-liver oil, intake of vitamin D and CRF. The correlations were dependent on gender for the following: BMI and serum PTH were significant only in boys.
Table 3 Correlation coefficients between s-25(OH)D (nmol/l) and seasonal variable (n 158), physical variables (n 158) and intake variables (n 120); 7-year-old Icelandic girls and boys, Reykjavík, 2006

s-25(OH)D, serum 25-hydroxyvitamin D; CRF, cardiorespiratory fitness; PTH, parathyroid hormone.
*Correlations are significant at the P = 0·05 level.
**Correlations are significant at the P = 0·01 level.
†P values are shown for gender differences. Gender differences were computed with the Mann–Whitney U test for week of autumn, BMI, vitamin D intake and fish-liver oil intake, and with the independent t test for height, weight and CRF.
The stepwise linear regression model showed that week of autumn accounted for 18·9 % of the variation in s-25(OH)D (P < 0·001; Table 4). Vitamin D intake accounted for an extra 5·2 % (P < 0·004) and CRF 4·6 % (P < 0·005), in total explaining 28·7 % of the variance in s-25(OH)D. Gender and BMI did not have a significant effect on the model (P = 0·266 and P = 0·981, respectively).
Table 4 Stepwise linear regression model explaining the variance in s-25(OH)D (nmol/l) dependent on background, seasonal, intake and physical variables based on the food records (n 120); 7-year-old Icelandic girls and boys, Reykjavík, 2006

s-25(OH)D, serum 25-hydroxyvitamin D; CRF, cardiorespiratory fitness.
†Weeks 36–46.
‡Marker for outdoor activities or sunlight exposure.
Discussion
The present study shows that a minority of 7-year-old children were following the dietary guidelines for fish-liver oil or vitamin D supplement intake in autumn, despite a rich tradition in Iceland for fish-liver oil intake. Only 42·5 % of the children took fish-liver oil or other vitamin D supplements on some of the recording days and for those children, only 50 % reached optimal serum vitamin D status (s-25(OH)D >50 nmol/l). Among the children who did not take vitamin D supplements, only 30 % reached optimal serum vitamin D status in autumn. These results indicate that those autumn weeks have a great impact on serum vitamin D status in children, as the median value had decreased to below 50 nmol/l in both the supplemented and non-supplemented groups at the end of the measurement period. Sunlight exposure and outdoor activities during summer and early autumn are important to increase vitamin D synthesis and status, and affect serum vitamin D concentrations during autumn and winter.
The strongest correlations with vitamin D status in the present study were intake of vitamin D, week of autumn and CRF, but BMI was not significantly correlated with vitamin D status. Studies have shown the correlation between consumption of vitamin D and vitamin D status to be about r = 0·20–0·54 for children over 12 years of age, which suggests that the variability in vitamin D status in the blood is only partly explained by vitamin D consumption( Reference Sigurdsson, Franzson and Thorgeirsdottir 19 ). Furthermore, only about a quarter of the inter-individual variability in serum vitamin D concentration is considered to be attributable to season, latitude or reported vitamin D intake( Reference Wang, Zhang and Richards 26 ). Data from the Northern Ireland Young Hearts 2000 study found that the strongest predictors of vitamin D inadequacy during winter for children aged 12–15 years were low vitamin D intake and gender( Reference Hill, Cotter and Mitchell 7 ), which is not in line with our results as vitamin D status did not differ between genders in present study during the autumn season, despite different intake levels. Vitamin D intake might play a larger role in increasing serum vitamin D during the winter season than in the autumn. Season was found to be one of the strongest determinants of vitamin D status in New Zealand children aged 5–14 years( Reference Rockell, Green and Skeaff 6 ). The interesting gender difference in diet observed in the present study is similar to former results and is attributed to different food choices( Reference Glynn, Emmett and Rogers 27 – Reference Gunnarsdottir, Eysteinsdottir and Thorsdottir 30 ). In the present cohort, boys had a higher intake of protein as a percentage of energy and the gender difference in vitamin D intake is attributed to the greater vitamin D content of protein-rich foods like fish-liver oil, fish and eggs. Since the blood samples from boys and girls, respectively, were equally distributed over the sampling weeks and there was no confounding by BMI between genders, these factors do not explain why there was no gender difference in s-25(OH)D despite different intake levels. This suggests that girls get more sun exposure, perhaps attributed to different clothing during summer (tank tops v. T-shirts, skirts v. pants). However, exclusion of different vitamin D metabolism in the genders or a stronger negative influence of BMI in boys, as indicated in Table 3, is not possible.
The Icelandic food-based dietary guidelines state that fish-liver oil or another vitamin D supplement should be used, especially during the winter. The RDI of vitamin D for children and adults up to 60 years of age is 10 μg/d, equivalent to 5 ml of cod-liver oil daily( 17 , Reference Thorsdottir and Gunnarsdottir 29 ). Only a minority of the children reached the recommendations for fish-liver oil intake (12·7 %) or vitamin D intake (22·4 %), and about 50 % of the children who took fish-liver oil or other vitamin D supplements in the present study did not reach either the optimal level of vitamin D in their blood (≥50 nmol/l) or the recommended intake of vitamin D (10 μg/d). These findings relate to the vitamin D intake and status in the adult population in Iceland, where only approximately 17 % and 30 % of women and men, respectively, reach the RDI for vitamin D, and 21 % take fish-liver oil daily according to the most recent National Dietary Survey conducted in 2010( Reference Thorgeirsdottir, Valgeirsdottir and Gunnarsdottir 11 ). This as well as results from studies on vitamin D intake among Icelandic children( Reference Gunnarsdottir, Helgadottir and Thorisdottir 12 , Reference Gunnarsdottir, Eysteinsdottir and Thorsdottir 30 ) support that the present study sample taken from randomly chosen schools in Reykjavík is representative for the population of 7-year-olds in Iceland. Since the median vitamin D value is not far from the reference value (50 nmol/l), emphasizing nutrition education campaigns, increasing adherence to the vitamin D recommendations and promoting outdoor activities for sunlight exposure could elevate values to more optimal levels. The vitamin D status decreased rapidly in the autumn weeks, and it can be assumed from Fig. 2 that they could decrease even further before spring (April/May). A new Nordic study on healthy adults (19–48 years) in Norway showed that supplementation with 10 μg of vitamin D daily over a 4-week period during winter, either in the form of fish-liver oil or multivitamin tablet, increased serum vitamin D (s-25(OH)D) by a mean of 34·1 (sd 13·1) nmol/l( Reference Holvik, Madar and Meyer 31 ). This suggests that if the children were following the recommended vitamin D intake of 10 μg/d, they would probably have better maintained their serum vitamin D status.
In an Icelandic cohort investigating vitamin D status of infants, 2-year-olds and 6-year-olds, the children who did not take fish-liver oil or other sources of vitamin D were within half of the RDI (2–3 μg/d) while those who consumed fish-liver oil on a daily basis reached the RDI for vitamin D (9·5 μg/d for the 2-year-olds and 12·3 μg/d for the 6-year-olds)( Reference Thorsdottir and Gunnarsdottir 32 ). In general, vitamin D intake is low in Europe (≤2–3 μg/d)( Reference Ovesen, Andersen and Jakobsen 33 ) and more than one-third of adolescent girls (12 years) in Northern Europe had vitamin D status below 25 nmol/l and almost all were below 50 nmol/l during winter( Reference Andersen, Mølgaard and Skovgaard 34 ). Vitamin D status in European children has been the focus of several investigations, and high prevalence of vitamin D deficiency has been reported during winter, especially above the 51·9°N latitude( Reference Tylavsky, Frances and Cheng 35 ). Latitude has shown to be a well-established risk factor for suboptimal levels of vitamin D, particularly in countries with minimal fortification practices( Reference Kimlin 36 ). At Nordic latitudes the highest vitamin D concentration is reached in the late summer or early autumn, related to sunlight exposure during summer. Children with more sunlight exposure during summer should have higher serum vitamin D and better maintain their serum vitamin D during autumn and winter, when little or no vitamin D is synthesized and vitamin D status is dependent on reserve vitamin D stores and sufficient vitamin D intake. The ideal daily dose of vitamin D has been studied in detail in the past years, but a consensus has not been reached( Reference Steingrímsdóttir, Gunnarsson and Indridason 37 ).
Several mechanisms for a correlation between fitness and vitamin D status have been proposed. One is that fitness may be a confounder in the association between body fat tissue and vitamin D( Reference Wortsman, Matsuoka and Chen 20 ). Fitness may also be associated with vitamin D concentrations because greater fitness is likely linked to increased outdoor activities( Reference Nilson, Andersen and Ommundsen 38 ) and thus exposure to sunlight( Reference Rockell, Green and Skeaff 6 ), as predicted in the present study. It should however also be mentioned that girls (12–14 years) with low s-25(OH)D have been shown to generate less power, jump less height and have lower velocity than girls with higher s-25(OH)D concentrations, measured as the ‘Esslinger Fitness Index’ which represents efficiency and asymmetry of movement and maximum voluntary force of each leg( Reference Ward, Das and Berry 39 ), suggesting that a lower CRF as a consequence of lower 25(OH)D could be one potential explanation for the positive association between CRF and 25(OH)D. Several studies worldwide have reported higher vitamin D status in boys compared with girls, although the reason is unclear( Reference Rockell, Green and Skeaff 6 – Reference Kumar, Muntner and Kaskel 8 ), but these studies were only examining vitamin D status, irrespective of intake. In the present study boys had higher fitness and higher intakes of vitamin D than girls, but there was no gender difference in serum vitamin D status. That might suggest that girls have similar outdoor activities or sun exposure as boys in Iceland, irrespective of fitness.
The correlation between vitamin D status and PTH was significant, but weak, in the present study. Some studies suggest that the threshold for vitamin D deficiency should be set on the basis of the relationship between vitamin D status and PTH according to the theory that suppression of PTH is beneficial for bone health( Reference Vieth, Chan and MacFarlane 40 ). However, limited information is available about whether a plateau in PTH concentrations is evident in young children, as in older children and adults( Reference Houghton, Szymlek-Gay and Gray 41 ). A physiological increase in serum PTH concentrations has been observed in adolescents( Reference Lamberg-Allardt and Viljakainen 42 ) and Cioffi et al. found that serum PTH concentrations in healthy children were lower and had a narrower range than in adults( Reference Cioffi, Corradino and Gazzerro 43 ). Normal values for PTH concentration in actively growing children have not been defined, in part because the range of PTH concentrations that correlate with normal bone turnover in children has yet to be determined( Reference Greer 44 ).
The limitations of the present study may be related to the method used to measure serum vitamin D or the method used to assess vitamin D intake. The method used to measure s-25(OH)D was DiaSorin RIA, which has decreased in popularity since 2001( Reference Wallace, Gibson and de la Hunty 45 ), mainly because it may underestimate 25(OH)D compared with the HPLC method( Reference Glendenning, Noble and Taranto 46 , Reference Glendenning, Taranto and Noble 47 ). It has also been shown to give lower values than LC–MS/MS( Reference Chen, McCoy and Schleicher 48 ). Some experiments suggest that the method does not equally recognize 25-hydroxyergocalcifierol (25(OH)D2) and 25-hydroxycholecalciferol (25(OH)D3), but the method only gives one 25(OH)D value( Reference Wallace, Gibson and de la Hunty 45 ). The values might therefore have been different if other methods had been used, and the proportions for suboptimacy and deficiency could have been different. The method used to measure vitamin D intake was the 3 d FR. FR have been used widely as a dietary assessment tool and as a reference method to validate other dietary assessment methods. However, due to day-to-day and seasonal variations they can be misleading, perhaps omitting some food groups that are rarely consumed. Intake level of fish-liver oil or vitamin D intake is based on evaluated amounts from spoons, beads, tablets and sips which is not precise enough to draw conclusions about exact intake. It may therefore be questioned if this method is valid to evaluate the diet of children. However, a recent systematic review concluded that a 3 d FR that includes weekdays and weekend days, with parents as co-reporters, is the most accurate method to estimate total energy intake in children aged 4–11 years( Reference Burrows, Martin and Collins 49 ). Another limitation is that there is no information on sunlight exposure or outdoor activities during summer and early autumn. Week of autumn and CRF were positively correlated with serum vitamin D as discussed, which may be partly related to outdoor activities and sunlight exposure, but other mechanisms may also be involved.
Conclusions
The present study concludes that only a minority of 7-year-old children (22·4 %) were following the vitamin D intake recommendations during autumn in Iceland. About 65 % of the children had blood values of vitamin D below 50 nmol/l (suboptimal levels). The predictors for vitamin D status were week of autumn, total vitamin D intake and CRF. Week of autumn seemed to have more effect on vitamin D status than diet or CRF, which demonstrates the importance of sunlight exposure during summer. There was a poor correlation between serum vitamin D and PTH. It is suggested that adherence to the advice for 1 h of physical activity daily could improve the vitamin D status through increased outdoor activities and sunlight exposure. To prevent suboptimal vitamin D status in young schoolchildren during autumn in northern countries, an increased effort is needed for enabling adherence to the vitamin D recommendations and promoting the importance of outdoor activities for sunlight exposure.
Acknowledgements
Sources of funding: The study was supported by research grants from the Eimskip Fund of the University of Iceland, Rannís – the Icelandic Centre for Research, the city of Reykjavík and the Ministry of Education, Science and Culture. Two private companies also supported the study: Brim Seafood and World Class Health Clubs, Iceland. The funders of the study had no role in the design, analysis or writing of this article. Conflicts of interest: None. Ethics: The study was conducted according to the guidelines laid down in the Declaration of Helsinki and all procedures involving human subjects were approved by the National Bioethics Committee (VSN b2006050002/03) as well as the Icelandic Data Protection Commission. Informed consent was obtained from all participants. Authors’ contributions: A.B. is a nutrition student who explored the data for associations between intake, fitness and status and wrote the first draft of the paper. A.G.K., H.H. and K.T.M. were all PhD students when the original data were collected and have participated in the analysis and interpretation of the data. E.J. is the Principal Investigator and administered the collection of data. I.T. coordinated the nutritional studies in the project. All authors have participated in writing the manuscript.


