


Characterizing child growth patterns, including the incidence of becoming stunted and of recovery from stunting, in low- and middle-income countries (LMIC) is important for understanding the determinants and consequences of childhood growth trajectories and for developing effective interventions and policies. Cross-sectional data from the Demographic and Health Surveys show that on average children in LMIC experience rapid growth faltering during the first two years of life, with height-for-age Z-score (HAZ), the preferred indicator of long-run nutritional status, declining dramatically over the first 24 months of life and increasing only slightly thereafter( Reference Victora, deOnis and Hallal 1 ). These and similar findings have been used to suggest that recovery after 2 years of age is unlikely and therefore the ‘window of opportunity’ for preventing undernutrition ends at age 2 years.
Nutritional interventions are increasingly targeted towards children under 2 years old as it has been suggested that, similar to linear growth retardation, the cognitive and developmental deficiencies resulting from poor growth may also be largely irreversible after about 2 years of age( Reference Ashworth 2 – Reference Walker, Grantham-McGregor and Himes 8 ). However, some evidence challenges these findings( Reference Johnson 9 – Reference Cheung and Ashorn 17 ) and suggests that there is significant opportunity for catch-up growth, as well as the associated cognitive and schooling improvements, following post-infancy growth stunting. Such evidence may support a complementary approach focused on identifying and targeting children post-infancy who are stunted or at risk for growth faltering, for further nutritional or health interventions. There are few published longitudinal studies of child growth and its consequences for health and development (that by Adair (1999)( Reference Adair 18 ) is an exception), limiting the conclusions that can be drawn about child growth trajectories in LMIC.
Our study addresses this gap in the literature by presenting longitudinal child growth data from population-based cohorts in four LMIC. We analysed data on the growth patterns of children post-infancy (≥12 months), in order to describe growth patterns and determine the incidence of becoming stunted and of recovery from stunting.
Participants and methods
Young Lives study
Young Lives is a longitudinal study of the causes and consequences of childhood poverty in Peru, Vietnam, India and Ethiopia( Reference Barnett, Ariana and Petrou 19 ). Within each country, the study follows a cohort of ~2000 children (there is also an older cohort of about half this size). The Young Lives Project used a multistage sampling strategy, whereby the first stage consisted of the selection of twenty sentinel sites (clusters) per country using a sampling methodology referred to as the Sentinel Site Surveillance System. In each country, the sentinel sites were selected in a semi-purposive manner based on socio-economic, demographic, geographic and policy variables that were relevant to the project. In Peru, Vietnam and Ethiopia, a nationwide sampling frame was used, whereas in India the sentinel sites were selected within the state of Andhra Pradesh. The sampling frame allowed for oversampling of poor areas and a mixture of urban and rural areas. In the second stage, within each sentinel site, households with a child in the target age range were enumerated and approximately 100 index children were selected according to comparable, but country-specific, protocols that were analogous to statistical random sampling. Refusal rates among selected households were <2 % in all four countries and in the case of refusal, replacement sampling was used( Reference Barnett, Ariana and Petrou 19 ). These sampling methods resulted in a sample for each country that reflected the ethnic, geographic and religious diversity of the population, but that was not chosen to be directly nationally representative. Further details on the sampling strategy used within each country can be found in the Preliminary National Reports (accessible at http:/www.younglives.org.uk/). Data collection took place in 2002 (round 1, age 6 to 18 months), in 2006–2007 (round 2, age 4·5 to 5 years) and in 2009–2010 (round 3, age 7 to 8 years). Supine length (round 1) and standing height (rounds 2 and 3) were measured with length/height boards using standardized WHO methodology( 20 ) and measurements precise to 1 mm. The length and height measurements were converted to Z-scores (HAZ) using WHO standards( 21 – 23 ).
Data cleaning and analysis
Length measurements were available at recruitment for 1946 children in Ethiopia, 1992 children in India, 2040 children in Peru and 1990 children in Vietnam. Data were excluded from analysis if the child: was not in the target age range (6–17·9 months) at recruitment (zero children in Ethiopia, thirty-nine in India, twenty-seven in Peru and sixty-nine in Vietnam); was not measured at all three rounds (115 children in Ethiopia, eighty-seven in India, 146 in Peru and seventy-two in Vietnam); or had HAZ values that were implausible, defined as |HAZ| >5 at any one round or an absolute value of change in HAZ between rounds of >4 (121 children in Ethiopia, seventy in India, thirty-two in Peru and nineteen in Vietnam). After these exclusions, data were available for 7171 children (1710 in Ethiopia, 1796 in India, 1835 in Peru and 1830 in Vietnam), representing 90 % of the original sample.
Children who were younger at recruitment tended to have higher HAZ values and children who were older at recruitment tended to have lower HAZ values (Fig. 1). Failing to account for the variability in age at recruitment would distort an assessment of the incidence of becoming stunted and of recovery between rounds 1 and 2, because children who were older than 12 months at round 1 would be coded as having greater recovery than they otherwise would have had they been recruited at 12 months, while children who were younger than 12 months at round 1 would be coded as having greater incidence of stunting than they otherwise would have, assuming that over short periods of time children track along the growth trajectory that is typical of the community in which they live. Therefore, we adjusted round 1 HAZ by adding the difference between the child's observed HAZ and the site-specific mean HAZ for all children within ±1 month of the child's age to the site-specific mean HAZ for children aged 11–13 months. Overall, there was little difference by month of age in mean HAZ in rounds 2 and 3, and therefore we did not conduct a similar adjustment for these rounds.

Fig. 1 Mean height-for-age Z-score (HAZ) at round 1 by age at recruitment in months among children (n 7171) in four low- and middle-income countries (![]() , Ethiopia;
, Ethiopia; ![]() , India;
, India; ![]() , Peru;
, Peru; ![]() , Vietnam); the Young Lives study
, Vietnam); the Young Lives study
Characterizing growth
We compared the mean values for HAZ at each round and the mean within-child change in HAZ between rounds. We computed the prevalence of stunting (HAZ<−2·0) in each round as well as the incidence of becoming stunted (the proportion of children who were not stunted in an earlier round but were stunted at a later round) and of recovery (the proportion of children who were stunted in an earlier round but were not stunted at a later round). Tests of statistical significance were carried out using linear regression analyses that accounted for both the paired nature of the data as well as the clustering within the data due to sampling procedures; all P values presented are two-sided. We also determined the extent to which HAZ measurements at earlier ages predict HAZ at later ages by performing the regression of HAZ at round 2 v. HAZ at round 1, and the regression of HAZ at round 3 v. HAZ at rounds 1 and 2. We used the Intercooled STATA 10·0 statistical software package for all data analyses.
Results
The average age at recruitment was 12·2 months, with some variation across cohorts (Table 1). At round 1, the Ethiopian cohort had the lowest mean HAZ (−1·51) and the Vietnamese cohort had the highest (−1·08; Table 2). From round 1 to round 2, mean HAZ increased among Ethiopian children (0·27; P < 0·001) and decreased among the other cohorts (range: −0·19 to −0·32; all P < 0·001). From round 2 to round 3, mean HAZ increased in all four cohorts (range: 0·19 to 0·38; all P < 0·001). At round 1, the Ethiopian cohort had the highest prevalence of stunting (46 %) and the Vietnamese cohort had the lowest (21 %). From round 1 to round 2, the Ethiopian cohort experienced a 15·1 percentage points (PP) reduction in the prevalence of stunting (P < 0·001), while the stunting prevalence increased (range: 3·0 to 5·3 PP; all P ≤ 0·001) in the other three cohorts. From round 2 to round 3, the prevalence of stunting decreased (range: 5·0 to 12·7 PP; all P < 0·001) in all four cohorts. Taking the whole study period, from round 1 to round 3, there was a significant decrease in the stunting prevalence in Ethiopia (25·4 PP; P < 0·001), Peru (8·3 PP; P < 0·001) and Vietnam (2·0 PP; P = 0·04); however, the decrease of 0·8 PP in India was not significant (P = 0·45).
Table 1 Baseline characteristics of children in the Young Lives cohortsFootnote *

* Based on children in the present analysis.
Table 2 Height-for-age Z-score (HAZ) measures at ages 1 year, 5 years and 8 years, and changes in HAZ between these ages, by country, among children (n 7171) in four low- and middle-income countries; the Young Lives study
From round 1 to round 2, the majority of children had a change in HAZ ≥0·50 (Fig. 2), whereas from round 2 to round 3, the majority of children experienced a change in HAZ ≤0·49.
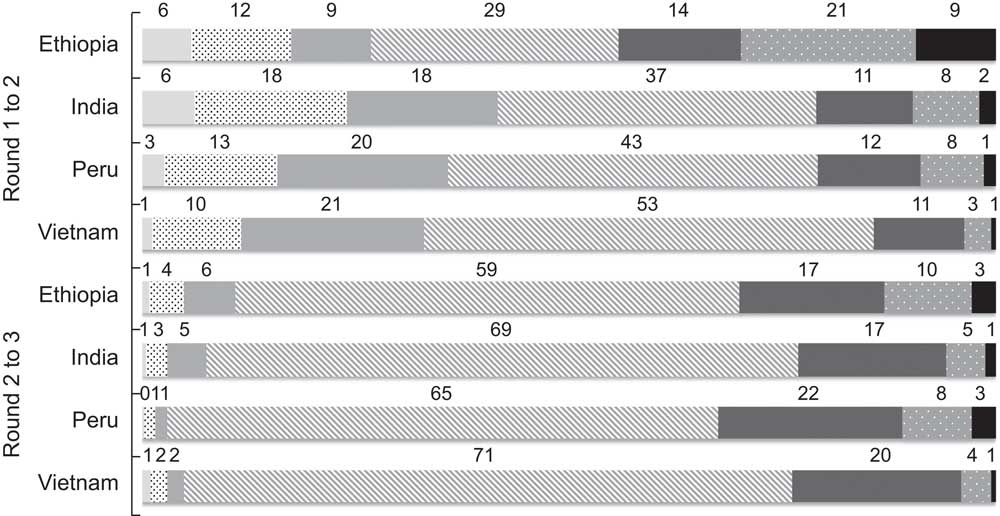
Fig 2 Categories of change in height-for-age Z-score (HAZ) between rounds (![]() , decrease in HAZ of ≥2·00;
, decrease in HAZ of ≥2·00; ![]() , decrease in HAZ of 1·00–1·99;
, decrease in HAZ of 1·00–1·99; ![]() , decrease in HAZ of 0·50–0·99;
, decrease in HAZ of 0·50–0·99; ![]() , change in HAZ within –0·49 to +0·49;
, change in HAZ within –0·49 to +0·49; ![]() , increase in HAZ of 0·50–0·99;
, increase in HAZ of 0·50–0·99; ![]() , increase in HAZ of 1·00–1·99;
, increase in HAZ of 1·00–1·99; ![]() , increase in HAZ of ≥2·00), by country, among children (n 7171) in four low- and middle-income countries; the Young Lives study. Bars represent the percentages of children in each category of HAZ change
, increase in HAZ of ≥2·00), by country, among children (n 7171) in four low- and middle-income countries; the Young Lives study. Bars represent the percentages of children in each category of HAZ change
The incidence of becoming stunted from round 1 to round 2 ranged from 11 % (Vietnam) to 22 % (India; Table 3), and from round 2 to round 3 ranged from 3 % (Peru) to 6 % (India and Ethiopia). The incidence of recovery ranged from 27 % (Vietnam) to 53 % (Ethiopia) between rounds 1 and 2, and from 30 % (India) to 47 % (Ethiopia) between rounds 2 and 3. From round 1 to round 3, the incidence of becoming stunted ranged from 8 % (Peru) to 18 % (India) and the incidence of recovery ranged from 45 % (Vietnam) to 67 % (Ethiopia).
Table 3 Incidence of stuntingFootnote * and of recoveryFootnote † from stunting, by country, among children (n 7171) in four low- and middle-income countries; the Young Lives study
HAZ, height-for-age Z-score.
* Incidence of stunting is the proportion of children who were not stunted at an earlier survey round but were stunted at a later survey round (stunting is defined as HAZ<−2·0).
† Incidence of recovery is the proportion of children who were stunted at an earlier survey round but were not stunted at a later survey round.
In the regression of HAZ at round 2 v. HAZ at round 1, the r 2 was 0·26 in Ethiopia, 0·33 in India, 0·47 in Peru and 0·60 in Vietnam; therefore, between 26 and 60 % of the variability in HAZ at round 2 was predicted by HAZ at round 1. In the regression of HAZ at round 3 v. HAZ at rounds 1 and 2, the r 2 was 0·53 in Ethiopia, 0·65 in India, 0·71 in Peru and 0·73 in Vietnam; therefore, between 53 and 73 % of the variability in HAZ at round 3 was predicted by HAZ at rounds 1 and 2.
Discussion
We analysed child growth patterns using HAZ at ages 1, 5 and 8 years of 7171 children in four LMIC participating in the Young Lives study. Cross-sectional data from round 1 demonstrated decreasing mean HAZ between the ages 6 and 18 months. Three of the four countries continued to experience declining HAZ between ages 1 year and 5 years. Mean HAZ increased in all four countries between ages 5 years and 8 years. While stunting status at round 1 was predictive of stunting at rounds 2 and 3, there was substantial recovery from early stunting, with recovery rates ranging from 27 % to 53 % between rounds 1 and 2, and from 30 % to 47 % between rounds 2 and 3. Intra-child height measurements over time are highly correlated, reflecting a combination of genetic predisposition and environmental influences that affect linear growth. However, a substantial proportion of the variability in HAZ at age 5 years (40–74 %) and in HAZ at age 8 years (27–47 %) was not predicted by HAZ measurements at earlier time points.
The data we used were collected through a large, multi-country longitudinal study, using standardized anthropometric procedures and rigorously trained field workers, and provided four diverse country contexts with which to study child growth patterns. However, several limitations of the data merit discussion. The Young Lives study began collecting data when the children were 6–17·9 months old, so length at birth is not consistently available. Round 1 data were collected during an age period in which growth faltering occurs in many LMIC settings( Reference Victora, deOnis and Hallal 1 ), and indeed our data show this age-related decrease in length-for-age. We addressed this challenge by internally adjusting our data to age 12 months. Length was not measured at age 2 years, the age at which HAZ generally reaches its nadir( Reference Victora, deOnis and Hallal 1 ). However, data from the INCAP (Institute of Nutrition of Central America and Panama) nutrition supplementation study showed that HAZ at ages 6, 12 and 18 months are strongly correlated with HAZ at age 24 months (r = 0·74, 0·83 and 0·91, respectively; all P < 0·001), suggesting that HAZ between the ages of 6 and 18 months can serve as a reasonable proxy for HAZ at age 24 months( Reference Stein, Melgar and Hoddinott 24 ). Additionally, having only three length/height measurements (at ages 1, 5 and 8 years) limits our ability to characterize post-infancy child growth patterns.
In the present analysis, the calculation of Z-scores used growth standards from two distinct populations. The child growth standards used to calculate Z-scores for the Young Lives cohorts at 1 year of age come from the longitudinal WHO Multicentre Growth Study, a population of exclusively or predominantly breast-fed children. The data for these growth standards end at 5 years of age, so the WHO developed reference charts for children older than 5 years based on cross-sectional data from the 1977 US National Center for Health Statistics study of child growth, where feeding type was not controlled( Reference deOnis, Onyango and Borghi 22 ). We used these WHO reference charts for older children in the calculation of Z-scores at 5 and 8 years of age. This can limit the comparability of the Z-scores at the three time points and suggests that the data should be interpreted carefully.
The results of the current analysis are based on data from four diverse country contexts, and we aimed to present and interpret country-specific findings while also discussing growth patterns that were common across the sites. We did not, however, attempt to explain sources of variation across sites in the magnitude of growth failure and the incidence of stunting and recovery from stunting, as such an analysis would require far more sites than the four in Young Lives and the models would quickly become saturated.
The present analysis has several strengths. When compared with other longitudinal studies that have collected child growth data, such as those participating in the COHORTS (Consortium of Health-Orientated Research in Transitioning Societies) collaboration( Reference Richter, Victora and Hallal 25 ), the Young Lives study provides unique data with which to characterize child growth patterns. The Young Lives study provides more recent data on children born at about the same time that the Millennium Development Goals were established. The data were collected longitudinally within four diverse, population-based cohorts using a study-wide standardization and training process. With its emphasis on LMIC, the Young Lives study is well positioned to document the incidence and timing of stunting and recovery among post-infancy children in countries characterized by poor childhood nutrition and growth, the focus of the Millennium Development Goals.
Our data demonstrate that while child growth trajectories throughout the pre-school and early school-age years are predicted in part by size at age 1 year, there is significant variation in growth after 1 year of age. This includes catch-up growth in some children and faltering in others. These results suggest that while prevention of early-life stunting must continue to be a top priority, programme planners and implementers should consider identifying and targeting for further nutritional interventions children who nevertheless become stunted during infancy, as well as children at risk for later growth faltering. An important area for future research is identifying the factors that contribute to these later variations in growth.
Acknowledgements
Sources of funding: This study is based on research funded by the Bill & Melinda Gates Foundation (Global Health Grant OPP1032713), the Eunice Shriver Kennedy National Institute of Child Health and Development (Grant R01 HD070993) and Grand Challenges Canada (Grant 0072–03 to the Grantee, The Trustees of the University of Pennsylvania). The data used in this study come from Young Lives, a 15-year, ongoing cohort study that investigates the changing nature of childhood poverty in Ethiopia, India (Andhra Pradesh), Peru and Vietnam (www.younglives.org.uk). Young Lives is core-funded by UK aid from the Department for International Development (DFID) and co-funded from 2010 to 2014 by the Netherlands Ministry of Foreign Affairs. The findings and conclusions contained herein are those of the authors and do not necessarily reflect positions or policies of the Bill & Melinda Gates Foundation, the Eunice Shriver Kennedy National Institute of Child Health and Development, Grand Challenges Canada, Young Lives, the DFID or other funders. The funders had no role in the design, analysis or writing of this article. Conflicts of interest: The authors declare that they have no conflicts of interest. Ethics: Ethical approval was not required. Authors’ contributions: M.E.P. was involved in the design of the Young Lives study as well as study implementation in Peru; E.A.L. and A.D.S. oversaw the initial design of the analysis, wrote the paper and had primary responsibility for final content; E.A.L. analysed the data. All authors interpreted the data, helped prepare the manuscript and (except for P.E., who passed away during the preparation of the manuscript) approved the final version.


