


Adequate nutrient intakes are critical to health maintenance and contribute to the prevention of chronic diseases and functional decline(Reference Abellan van Kan, Gambassi and de Groot1–13). Many countries and organisations across Europe provide micronutrient recommendations that serve as a basis for good health(Reference Doets, de Wit and Dhonukshe-Rutten14). Although different terms are used to express such recommendations, e.g. Population Reference Intakes, Recommended Intake, Recommended Daily Allowance, they all refer to the daily intake level that is sufficient to fulfil the requirements of nearly all healthy individuals in a defined population(Reference Doets, de Wit and Dhonukshe-Rutten14, Reference Dhonukshe-Rutten, Timotijevic and Cavelaars15).
There are two main approaches for establishing micronutrient recommendations: the requirement-based approach and the intake-based approach. The first approach evaluates evidence across intervention and observational studies on the relationship between intake and selected health indicators. These health indicators indicate the adequacy of intake to fulfil physiological needs and may include physiological, biochemical and functional measures, equilibrium maintenance and disease incidence(Reference Yates16). Based on the distribution of nutrient requirements both the Average Nutrient Requirement (ANR), also referred to as the Average Requirement or Estimated Average Requirement, and the Recommended Intake can be derived (ANR + 2sd).
The intake-based approach is used when evidence needed to estimate the distribution of nutrient requirements is lacking or incomplete. Consequently, recommendations are based on the lowest level of intake estimated to be sufficient for nearly all healthy people within the population, also referred to as Adequate Intake (AI).
Micronutrient recommendations serve as an important basis for public health nutrition policy. If the distribution of requirements can be estimated, the ANR can be used to assess the prevalence of adequate intakes within a population. Furthermore, if the prevalence of adequate intakes is not satisfactory, recommended intakes can be used for planning interventions to improve the situation(Reference Murphy and Vorster17–Reference Timotijevic, Raats and Barnett19).
Currently, there is considerable variation in micronutrient recommendations between countries and this can cause confusion among policy makers, consumers, the food industry and health professionals(Reference Doets, de Wit and Dhonukshe-Rutten14, Reference Hermoso, Tabacchi and Iglesia-Altaba20–Reference Prentice, Branca and Decsi22). This variation may be due to differences between populations, e.g. in bioavailability from national diets, but it may also be due to differences in approaches used for establishing recommendations (ANR + 2sd v. AI)(Reference King, Vorster and Tome23) and eminence-based decisions regarding the selection of relevant health indicators and data underlying recommendations(Reference Yates16, Reference Timotijevic, Raats and Barnett19, Reference King, Vorster and Tome23, Reference Timotijevic, Barnett and Brown24). Harmonisation of the process for establishing micronutrient recommendations will increase transparency, objectivity and reliability of recommendations and contribute to aligned nutrition policy across Europe(Reference Timotijevic, Raats and Barnett19, Reference King, Vorster and Tome23).
The present paper aims to contribute to the understanding of the variation in recommendations and to signal key issues for harmonising approaches for establishing recommended intakes for adults and elderly people of four micronutrients (folate, vitamin B12, Fe and Zn) that were prioritised by the Network of Excellence EURRECA(Reference Cavelaars, Doets and Dhonukshe-Rutten25–Reference Pijls, Ashwell and Lambert27). First we explored differences in current recommendations between reports from key European and non-European countries/organisations. Second we examined whether the approaches used and the eminence-based decisions made for establishing recommendations contribute to the observed variation.
Methods
Collection and comparison of recommended micronutrient intakes
By the end of 2007, and early 2008, the latest reports on micronutrient recommendations were collected from thirty-one European countries and organisations in collaboration with local key informants involved in setting these recommendations, as described elsewhere(Reference Doets, de Wit and Dhonukshe-Rutten14).
Eight European countries, clusters of countries or organisations provided reports on micronutrient recommendations based on a review of the available literature on nutrient requirements(Reference Doets, de Wit and Dhonukshe-Rutten14): United Kingdom (GB)(28), Netherlands (NL)(29, 30), France (FR)(Reference Martin31), Latvia(32), Germany–Austria–Switzerland (DACH)(33), Norway–Sweden–Finland–Denmark–Iceland (NNR)(34), European Community (EC)(35) and WHO/FAO(36). The latter two defined recommendations to be used in an international perspective. Seven of these reports were included in the present study: the Latvian report was excluded because no information was available on the approaches and eminence-based decisions underlying recommendations.
In other European countries, micronutrient recommendations were adopted from at least one of the reports mentioned above or from guidance provided in the USA/Canada(Reference Doets, de Wit and Dhonukshe-Rutten14, 37, 38). Therefore, we also included the report of USA/Canada (US/CA) in the present study. In addition the report of Australia/New Zealand (AU/NZ)(39) was included, because it includes an extensive evaluation of the recommendations previously published in USA/Canada and considers the literature up to 2003.
From the nine reports, we extracted recommended intakes of folate, vitamin B12, Fe and Zn for adults and elderly people (age ≥18 years). To quantify the extent of heterogeneity between reports the ratio of the highest to the lowest recommendation observed per gender was calculated. Within-report comparisons were used to identify differences between men and women and between younger and older adults.
Collection and comparison of approaches
From each report we retrieved information on the approach used for establishing the recommendations of interest (ANR + 2sd, or AI). If an ANR + 2sd was reported, we obtained the ANR and inter-individual variation coefficient (CV = 100 × sd/ANR). In case the ANR or CV was not explicitly reported, the missing value was calculated based on the following equation: ANR + 2sd = ANR × (1 + 2 × CV/100). We evaluated whether variation in ANR + 2sd was more strongly related to between-report differences in ANR or CV. For each combination of two reports with a different ANR + 2sd, we checked in what way applying the same CV would change the difference between the recommendations.
Collection and comparison of eminence-based decisions
In general there are two ways to establish an ANR: (i) based on intake–health associations or (ii) based on physiological needs estimated by basal losses (i.e. factorial approach). If intake–health associations are used, the ANR is estimated by the mean intake needed to reach a specified cut-off level of the selected health indicator. The factorial approach includes the summation of basal losses via skin, faeces, urine and additional needs for accretion. By correcting total needs for bioavailability from the usual diet, the ANR is estimated (ANR = mean physiological needs × 100/bioavailability factor). To explain potential variation in ANR between reports we collected and compared health indicators and cut-off levels or basal losses and bioavailability factors depending on the method used to establish the ANR.
Finally, to assess the data underlying recommendations the references that were given greatest weight by the authors of the reports were compared between reports that used similar methods for deriving an ANR or AI.
Results
Recommended intakes of folate, vitamin B12, Fe and Zn for adults (≥18 years) from European countries, US/CA and AU/NZ are presented in Tables 1 and 2. Since recommendations were similar across adult ages, for each report we only present one recommendation per gender. Due to the diminished Fe needs after onset of menopause, all reports provided recommended Fe intakes for pre- and postmenopausal women separately.
Table 1 Recommended intakes of folate and vitamin B12 for adults (age ≥18 years) and underlying approaches
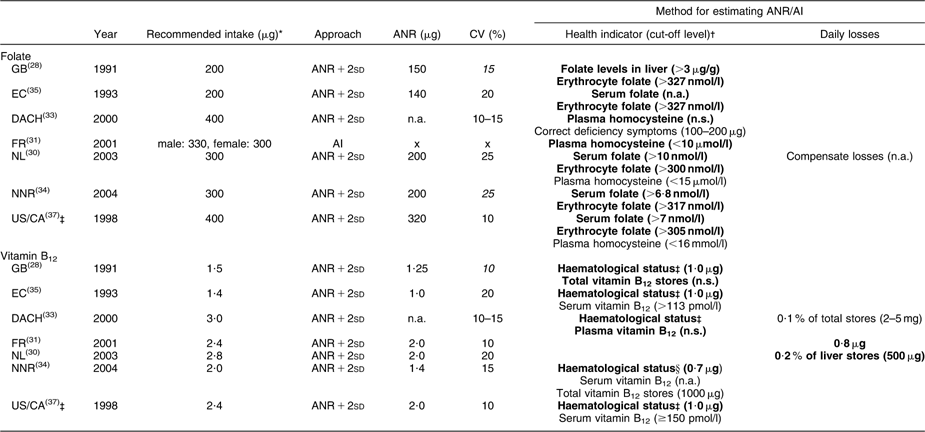
ANR, Average Nutrient Requirement; AI, Adequate Intake; GB, United Kingdom; EC, European Community; DACH, Germany–Austria–Switzerland; FR, France; NL, Netherlands; NNR, Norway–Sweden–Finland–Denmark-Iceland; US/CA, USA/Canada; n.a., not available in report; x, not available because the intake-based approach was used; n.s., not specified.
Values in italics could not be retrieved from the reports, but were calculated: CV = 0·5 × [(recommendation/ANR) − 1].
*Recommended folate intakes were expressed as dietary folate equivalents (DFE): 1 DFE = 1 μg food folate = 0·6 μg folic acid from fortified foods = 0·5 μg folic acid from supplements.
†Bold text indicates the primary indicator used to estimate the ANR, whereas the text not in bold indicates a secondary health indicator.
‡WHO/FAO and Australia/New Zealand (AU/NZ) adopted recommendations from US/CA; therefore the reports of WHO/FAO and AU/NZ were not considered separately.
§Haematological status as measured by stable Hb, normal mean cell volume and normal reticulocyte response.
Table 2 Recommended intakes of iron and zinc for adults (age ≥18 years) and underlying approaches
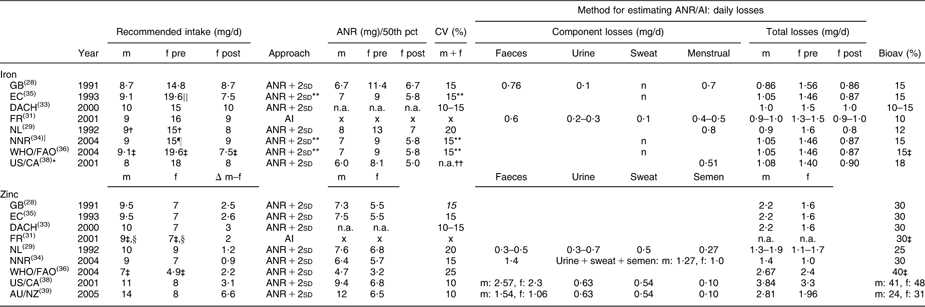
m, males; f, females; pre, premenopausal; post, postmenopausal; pct, percentile; ANR, Average Nutrient Requirement; AI, Adequate Intake; bioav, bioavailability; GB, United Kingdom; EC, European Community, DACH, Germany–Austria–Switzerland; FR, France; NL, Netherlands; NNR, Norway–Sweden–Finland–Denmark–Iceland; US/CA, USA/Canada; AU/NZ, Australia/New Zealand; n.a., not available in report; x, not available because the intake-based approach was used; n, negligible.
Values in italics could not be retrieved from the reports, but were calculated: CV = 0·5 × [(recommended intake/ANR) − 1].
*AU/NZ adopted recommendations from US/CA; therefore the report of AU/NZ was not considered separately.
†A separate recommended Fe intake was provided for men and women aged 19–21 years, m: 11·0 mg, f: 16·0 mg.
‡Recommended intakes of Fe and Zn were also available for other bioavailability coefficients (WHO/FAO: 5, 10 and 12 % for Fe, 15 and 50 % for Zn, FR: 20 % for Zn).
§For men and women aged ≥75 years, the recommended Zn intake was 8·0 mg.
∣∣EC also presents the 90th percentile of intakes to fulfil physiological requirements, 15·8 mg.
¶The recommended Fe intake was set at the 90th percentile of Fe requirements.
**Not applicable for premenopausal women: the distribution of requirements was skewed and recommended Fe intake could therefore not be derived as ANR + 2sd.
††Distribution of Fe requirements for both men and women was based on the median and variability in body weights recorded in the third National Health and Nutrition Examination Survey.
WHO/FAO and FR provided recommended intakes of Fe and Zn for different bioavailability factors. In our comparison, we included the recommendations estimated with the bioavailability factor most frequently used in the other reports (Fe 15 %, Zn 30 %).
Variation in recommendations
Between-report ratios of highest to lowest recommendations were about 2·0 for folate (200–400 μg), vitamin B12 (1·3–3·0 μg) and Zn (men 7–14 mg, women 4·9–9·0 mg), whereas for Fe the variation was less with a ratio of about 1·3 (men 8–10 mg, premenopausal women 14·8–19·6 mg, postmenopausal women 7·5–9·0 mg).
Within reports, we observed no gender differences for folate and vitamin B12; only FR recommended a higher folate intake for men (+30 μg). For Fe, higher recommendations were established for premenopausal compared with postmenopausal women (+3 mg to +12 mg), whereas recommendations for men and postmenopausal women were similar or slightly different (EC, NL, WHO/FAO; maximum difference 1·6 mg). For Zn all reports provided higher recommendations for men than for women (+1 to +6 mg).
In general few differences existed between recommendations for younger and older adults, due to limited knowledge of the effects of the ageing process on utilisation and absorption of folate, vitamin B12, Fe and Zn. However, all reports, except the one from GB, indicated that consumption of vitamin B12 via fortified foods or supplements is recommended for elderly people suffering from food-bound malabsorption. Due to the high prevalence of atrophic gastritis among elderly people (10–30 %), US/CA applied this recommendation for all those aged 51 years and older.
Both for folate and vitamin B12 we observed a clear difference in recommended intakes between reports of GB and EC published until 1993 (folate 200 μg, vitamin B12 1·4–1·5 μg) and the other reports published since 1998 (folate 300–400 μg, vitamin B12 2·0–3·0 μg).
Variation in approaches
In general, reports suggested that recommendations were established using the requirements-based approach (ANR + 2sd); only FR indicated providing an AI for folate, Fe and Zn (Tables 1 and 2).
To derive recommended Fe intakes for premenopausal women, five reports (EC, NNR, WHO/FAO, US/CA, GB) used an alternative approach since the distribution of menstrual Fe losses was found to be skewed. EC, NNR, WHO/FAO and US/CA estimated the distribution of Fe requirements for this population group as the convolution of the distributions of menstrual and basal Fe losses and subsequently derived recommended Fe intakes as the 90th (EC, NNR), 95th (EC, WHO/FAO) or 97·5th (US/CA) percentile of Fe requirements. EC and NNR argued that considering a usual diet, Fe intake fulfilling requirements of 95 % of the population would be unrealistically high for the majority of premenopausal women. GB derived an ANR for Fe as the sum of mean basal losses and the 75th percentile of menstrual Fe losses corrected for the bioavailability factor. The ANR + 2sd was estimated by applying a CV of 15 %.
Between reports CV varied from 10 to 20 % (vitamin B12 and Fe) or 10 to 25 % (folate and Zn). Part of the observed between-report differences in ANR + 2sd can be explained by variation in CV. In general for folate, Zn and Fe, between-report differences in ANR contributed more to the variation in recommendations than differences in CV, as between-report differences in ANR + 2sd stayed similar, decreased only slightly or even increased after applying the same CV (data not shown). The variation in CV only fully explained the differences in ANR + 2sd for vitamin B12 established by FR, NL and US/CA, and differences in ANR + 2sd for Zn established by NL and US/CA. In these cases, ANR were the same in all specified reports and only CV varied. For Zn, some variation in ANR + 2sd was more strongly related to between-report differences in CV than in ANR both for men (GB–NL, EC–NL) and women (NL–AU/NZ).
Variation in eminence-based decisions
For folate and vitamin B12, the maintenance of blood or tissue levels at a concentration not accompanied by deficiency symptoms was generally considered as health indicator for establishing an ANR (Table 1). For folate all countries/organisations used at least one biomarker of folate status as primary health indicator for establishing an ANR. Cut-off levels indicating adequate concentrations of biomarkers showed some variation between reports: erythrocyte folate >300–340 nmol/l, serum folate >6·8–10·0 nmol/l, serum homocysteine <10–16 μmol/l. EC, NL, NNR and US/CA all used adequate serum and erythrocyte folate as health indicators, but ANR varied from 140 to 320 μg. All four reports referred to the same depletion–repletion study by Sauberlich et al.(Reference Sauberlich, Kretsch and Skala40). In addition, EC based their ANR on two older depletion–repletion studies(Reference Herbert41, Reference Herbert42), and NL, NNR and US/CA on a more recent depletion–repletion study(Reference Jacob, Wu and Henning43) and a balance study(Reference Milne, Johnson and Mahalko44). NL and US/CA also considered the randomised controlled trial by O'Keefe et al.(Reference O'Keefe, Bailey and Thomas45). However, NL did not use the latter study for estimating the ANR because requirements based on the results of that study were much higher than those in other studies. In contrast, in the report of US/CA the O'Keefe study was given greatest weight, as subjects in the other depletion–repletion studies would have received more folate than reported due to underestimation of the folate content in food.
GB based recommended folate intakes on observational data on the relationship between long-term folate intake and adequate concentrations of folate in liver and erythrocytes(Reference Jacob, Wu and Henning43).
An optimal concentration of homocysteine was selected as health indicator for folate in reports of FR(Reference Chango, Potier De Courcy and Boisson46) and DACH(Reference Pietrzik and Bronstrup47, Reference Selhub, Jacques and Wilson48), which was explained as the level at which the risk for CVD is minimised. On the contrary, NL, NNR and US/CA reported that available evidence on minimising CVD risk by lowering homocysteine concentrations is not strong enough to take this biomarker into account for estimating folate requirements.
For vitamin B12, GB, EC, NNR and US/CA selected the maintenance of adequate haematological status as primary health indicator for estimating the ANR (1·0–2·0 μg). EC, NNR and US/CA mainly based the ANR of vitamin B12 on Darby et al.(Reference Darby, Bridgforth and Le Brocquy49), studying the effects of various intramuscular doses of vitamin B12 on subjects with pernicious anaemia. NNR and US/CA corrected these levels for reabsorption of biliary vitamin B12 as occurs in healthy people(Reference Bozian, Ferguson and Heyssel50–Reference Heyssel, Bozian and Darby52). EC did not perform these corrections, but assumed that adjustments for reabsorption will cancel out adjustments needed for incomplete absorption from the diet. Studies in vegetarians were used as supportive data(Reference Baker and Mathan53). In GB (ANR: 1·25 μg) studies given largest weight were different(Reference Baker and Mathan53–Reference Sullivan and Herbert57).
FR and NL estimated the ANR for vitamin B12 following the factorial approach using estimates of basal losses (0·8–1·0 μg) and a bioavailability of 40 and 50 %, respectively. Estimations of basal losses were based on different studies (FR(Reference El Kholty, Gueant and Bressler51, Reference Gueant, Djalali and Aouadj58), NL(Reference Bozian, Ferguson and Heyssel50, Reference Heyssel, Bozian and Darby52)), but ANR were similar (2·0 μg).
The DACH report mentioned several health indicators, but from the information provided we could not deduce which indicator and data were used to estimate an ANR.
For Fe and Zn all reports used the factorial approach to estimate the ANR (Table 2).
For Fe, the maximum difference between reports in basal losses was 0·3 mg (premenopausal women DACH v. NL). All reports, except GB and NL, stated that basal Fe losses were based on physiological needs per kilogram of body weight, namely 14 μg/kg per d. Reference body weights selected for estimating an ANR varied between reports (men 74·0–77·4 kg, women 59–64 kg). Using the highest or lowest observed reference weight would result in a difference in ANR of ≤1·2 mg.
In most countries/organisations, basal Fe losses were based on a single experimental study by Green et al.(Reference Green, Charlton and Seftel59) using radio-labelled Fe to measure losses from different body compartments. US/CA reported that Green's was the only study with reliable quantitative data for basal Fe losses in human subjects. A previous report on recommendations published by FAO(60) was also indicated three times as an important reference.
In contrast, FR, DACH and NL did not refer to the experimental study by Green et al.(Reference Green, Charlton and Seftel59): FR referred to the FAO report(60), NL used data from other balance, turnover and depletion–repletion studies(Reference Bowering and Sanchez61–Reference Monsen, Hallberg and Layrisse63) and DACH did not provide information on their evidence base.
For estimates of menstrual Fe losses, all reports, except FR and NL, referred to the same study from year 1966(Reference Hallberg, Hogdahl and Nilsson64). Although the evidence base used in FR and NL was different, their estimated basal losses were similar to estimates provided in the other reports.
Bioavailability factors for Fe varied between reports from 5 to 18 %. They were mainly based on studies investigating bioavailability from diets with ratios of haem Fe to non-haem Fe representative of national (NL, FR, NNR, US/CA) or Western/mixed diets (GB, DACH, WHO/FAO, EC) in Fe-replete subjects with minimal or normal Fe stores. FR applied a bioavailability factor of 10 %, but indicated that in subjects without Fe stores bioavailability could reach 15–20 %, whereas US/CA estimated an ANR for those with normal Fe status but minimal stores and applied a factor of 18 %.
For Zn, total losses varied substantially (men: 1·3–3·8 mg; women: 1·0–3·3 mg); on intestinal losses in particular there was no agreement (men: 0·3–2·57 mg; women: 0·3–2·3 mg). All countries/organisations used different combinations of studies to estimate the ANR, but all except FR and NNR refer to the balance study by Milne et al.(Reference Milne, Canfield and Mahalko65). Other important sources of evidence reported in at least three reports were a depletion–repletion study(Reference Baer and King66) (NL, NNR, WHO/FAO), the study by Hess et al.(Reference Hess, King and Margen67) measuring Zn excretion in young women on low Zn intakes (NNR, WHO/FAO, US/CA, AU/NZ), a book chapter(Reference King68) (GB, EC, DACH) and a cohort study(Reference Taylor, Bacon and Aggett69) (WHO/FAO, US/CA, AU/NZ).
Bioavailability factors for Zn varied between reports from 15 to 50 %. US/CA and AU/NZ applied higher bioavailability factors for women than for men, which contributed to observed gender differences in ANR (respectively 2·6 mg and 5·5 mg). More recent reports (NNR, US/CA, AU/NZ) based bioavailability factors on the relationship between the amount of Zn absorbed and that excreted via the intestine based on mixed diets. AU/NZ estimated their factor with results from the International Zinc Nutrition Consultative Group(Reference Brown, Rivera and Bhutta70), which was lower than factors provided by NNR and US/CA (40–48 %). The other reports based bioavailability factors on studies investigating absorption efficiency from different types of diets. Although the evidence base varied between reports bioavailability factors in these reports were similar (25–30 %).
Discussion
Based on our comparisons of approaches and eminence-based decisions underlying the establishment of recommended intakes of folate, vitamin B12, Fe and Zn, we identified explanations for the variation in current recommendations. For folate selected health indicators were similar between reports and the variation was mainly related to differences in the underlying data. In contrast, for vitamin B12 variation in CV and selected health indicators (maintenance of haematological status or basal losses) seemed to contribute most to the observed variation. For Fe, differences in reference weights and bioavailability factors were the main explanatory factors for the variation in recommendations as the underlying data and consequently the estimates of basal losses were similar in most reports. For Zn the variation in recommended intakes was related to differences in CV, bioavailability factors and the large variation in the evidence base.
Although the reports that we considered were published over 13–14 years, access to new data and changes in concepts of nutrition did not seem to have altered the estimates made by the newer panels, except for folate. Recommended folate intakes published until year 1993 (GB and EC) were based on older studies as compared with the other reports published since 1998.
The present paper describes the situation at the beginning of 2008. Since then several countries have published updates for one or more micronutrients. However, for the countries/organisations, micronutrients and age groups included in the comparison herein, no updates were identified. All most recent recommendations and ANR provided by European countries and organisations are collated in EURRECA's web-based tool Nutri-RecQuest(Reference Cavelaars, Kadvan and Doets71).
In general, the requirements-based approach was used to establish recommendations. Only FR indicated providing an AI for folate, Fe and Zn, although the type of health indicators and data selected as the basis for recommendations were similar to other reports providing an ANR + 2sd. Apparently there is no consensus on the use of this term.
In 2007, a working group of international experts reviewed the harmonisation of approaches for developing recommendations on nutrient intakes. They proposed new terminology and developed a new statistical approach for establishing recommendations. With this new approach, recommendations do not necessarily reflect ANR + 2sd covering the needs of 97·5 % of the population, but lower levels in the distribution of requirements may also be chosen when this is more likely to be achieved with current nutrition policies(Reference King, Vorster and Tome23). Clearly, estimates of inter-individual variation depend on the health indicator selected to be most reflective of meeting nutritional needs. However, for folate, vitamin B12 and Zn, CV varied largely between reports using the same health indicators, as data on inter-individual variation in requirements are unavailable, inadequate or inconsistent and therefore assumptions are made based on variation in metabolic rates, variation in bioavailability and/or the level of uncertainty in the ANR estimate. More research is needed to define CV, but as long as appropriate data are lacking, international consensus on how to make assumptions regarding inter-individual variation in requirements of folate, vitamin B12 and Zn will help to harmonise approaches for setting recommendations.
Health indicators selected for estimating requirements for folate, vitamin B12, Fe and Zn varied between reports and included biomarker concentrations rather than associations between intake and health outcomes such as organ function or chronic disease risk. Cut-off levels indicating adequate concentrations of biomarkers were based on the prevention of deficiency symptoms, whereas their predictive value for health outcomes was not often considered. Moreover, along with the observation that similarities in the consulted evidence base often lead to different ANR of folate and vitamin B12, the example on optimal concentrations of homocysteine for the prevention of CVD illustrates that methods used for the selection, evaluation and integration of data were not consistent between reports. The Institute of Medicine developed an analytical framework for setting nutrient reference values for optimal health based on associations between dietary exposure (intake) and clinical health outcomes (chronic diseases)(Reference Russell, Chung and Balk72). The use of standard systematic review methodology including meta-analyses for evaluating data on these associations will contribute to increased transparency of the decision-making process and could therefore be an important step in harmonising approaches for setting micronutrient recommendations(Reference Russell, Chung and Balk72, Reference Chung, Balk and Ip73). However, the use of chronic disease outcomes for setting recommended micronutrient intakes may be challenging due to the lack of data on associations between intake and such clinical outcomes and due to the multifactorial nature of chronic diseases including factors such as genetics, age, diet, environment and lifestyle(Reference Chung, Balk and Ip73). In addition, it could be questioned whether establishing an ANR based on associations between intake and chronic disease risk would be possible as it seems very challenging to estimate the intake at which 50 % of the population is at risk and 50% is not. Setting an AI seems more feasible as it represents the intake level that resulted in the greatest reduction of risk of disease(Reference Russell, Chung and Balk72, Reference Trumbo74). As data on direct associations between intake and clinical outcomes are often lacking, biomarkers that correlate both with intake and a disease or physiological state may be used as an intermediary between intake and health(Reference Russell, Chung and Balk72, Reference Chung, Balk and Ip73). Recently, within the scope of the EURRECA Network of Excellence, best practice methods for assessing intake(Reference Henriquez-Sanchez, Sanchez-Villegas and Doreste-Alonso75, Reference Serra-Majem, Pfrimer and Doreste-Alonso76) and best practice biomarkers have been evaluated for all nutrients of interest(Reference McNulty and Scott11, Reference Hoey, Strain and McNulty77–Reference Zimmermann79) by means of standardised systematic review methodology(Reference Hooper, Ashton and Harvey80). Up to now, these best practice biomarkers have not yet been used for estimating requirements, except for folate (erythrocyte folate and serum/plasma folate). Currently within EURRECA, systematic reviews including meta-analyses are carried out to evaluate the strength and quality of dose–response relationships between intake and status of the priority micronutrients and between micronutrient intake or status and various health outcomes. Following standardised protocols, these reviews will make transparent what evidence is available addressing populations and outcomes of interest and they may enhance the selection of health indicators(Reference Chung, Balk and Ip73).
Dose–response relationships for Fe and Zn might be especially difficult to estimate due to a lack of sensitive and specific biomarkers reflecting status and due to the strong homeostatic regulation of body Fe and Zn(Reference Gibson81). The factorial approach may therefore be the most appropriate way of estimating ANR on both minerals assuming a certain level of bioavailability. Bioavailability of Fe and Zn is influenced by the composition of the diet as well as individual characteristics including micronutrient status, age, genotype and clinical conditions influencing absorption and utilisation(Reference Gibson81–Reference Hurrell and Egli83). Absorption of Fe depends on the form of Fe (haem or non-haem) and the presence of factors enhancing or inhibiting absorption like vitamin C and phytate(Reference Gibson81, Reference Yates84). In addition, homeostatic adaptations occur, increasing or decreasing fractional absorption when intake or status is low or high(Reference Gibson81). For Zn, bioavailability is also influenced by factors enhancing or inhibiting absorption, by individual Zn intake and status, and it may also be influenced by ageing(Reference Fairweather-Tait, Harvey and Ford85). Variation in bioavailability factors between reports was related both to differences in diet composition between countries and differences in methodologies for deriving bioavailability factors. To align methods of deriving bioavailability factors for Fe and Zn, agreement is needed on how to estimate the effects of meal composition and individual characteristics such as micronutrient status, genetic variation (single nucleotide polymorphisms) and age on bioavailability(Reference Hurrell and Egli83, Reference Hambidge86, Reference Casgrain, Collings and Harvey87).
In conclusion, for the harmonisation of approaches for setting recommended intakes of folate, vitamin B12, Fe and Zn across European countries, standardised methods are needed to: (i) select health indicators and define adequate biomarker concentrations; (ii) make assumptions about inter-individual variation in requirements; (iii) derive bioavailability factors; and (iv) collate, select, interpret and integrate evidence on requirements.
Acknowledgements
This work was carried out within the EURRECA Network of Excellence (www.eurreca.org), financially supported by the Commission of the European Communities, specific Research, Technology and Development (RTD) Programme Quality of Life and Management of Living Resources, within the Sixth Framework Programme, contract no. 036196. This report does not necessarily reflect the Commission's views or its future policy in this area. None of the authors have reported any financial or personal conflict of interest related to the present manuscript. The contributions of each author in this work are as follows: A.E.J.M.C., R.A.M.D.-R. and E.L.D. designed the research; E.L.D. conducted research and wrote the first draft; A.E.J.M.C., R.A.M.D.-R., L.C.P.G.M.d.G. and P.v.t.V. provided critical review; E.L.D. had primary responsibility for final content. All authors read and approved the final manuscript. The authors are grateful to all EURRECA members who contributed to the collation of data.


