


The human genome is only about 1·5 % different from that of the chimpanzee(1). As the human gene line separated from the great apes about 5–7 million years ago, the human genome is largely ancient. Therefore our physiology and genomics are adapted to wild foods. Wild meats are naturally lean. As reported in 1968(Reference Crawford2), there has been a substantial increase in the amount of non-essential fats and a loss of essential fats derived from contemporary animal husbandry. Despite various recommendations (e.g. reference 3), the high meat and carcass fats have not been corrected.
The lipid bilayer of the plasma membrane contains receptors, ion channels, transporters and antioxidant defence systems. Their function is influenced by the composition of the lipids, which in turn are affected by diet. Moreover, it is now known that there is an array of lipid-derived second messengers with subsequent activation of protein phosphorylation cascades that have emerged as one of the fundamental mechanisms of signal transduction in animal cells(Reference Rozengurt, Rey and Waldron4). The specialization of membrane lipid reaches its zenith in the brain, where the structural material is 60 % lipid. This lipid has a highly specific composition with a particularly consistent ratio of arachidonic acid (AA) to DHA(Reference Crawford, Casperd and Sinclair5). The lipid bilayer is also of special relevance to the vascular endothelium, which has the highest ratio of plasma membrane to cytoplasm of any cell in the body. The inner cell membrane lipid of the endothelium contains high proportions of AA(Reference Crawford, Golfetto, Bistanis, Ghebremeskel, Min, Moodley, Poston, Phylactos, Cunnane and Schmidt6). There is an abundance of evidence that dietary deficiency/excess or non-essential fatty acids competing with essential PUFA adversely affect the function of the brain, skin and vascular and immune systems. It has been long recognized that fatty acids interact with one another, competing for the same enzyme systems and for incorporation into cell membranes(Reference Holman7). Even distortion of the balance within the essential PUFA families will lead to adverse consequences(Reference Holman8, Reference Budowski and Crawford9).
A worrying aspect of the secular trends in disease is the rise in mental health. As predicted in 1972(Reference Crawford and Crawford10), brain disorders have risen and overtaken all other burdens of ill health. In the EU the cost for the twenty-five member states was put at €386 billion (2004 prices)(Reference Andlin-Sobocki and Wittchen11). In the UK, Lord Warner, in a reply to a Parliamentary Question by Lord Morris, gave the data shown in Fig. 1 on rising costs of mental ill health for hospital and related costs only(12). In addition to what is happening in Europe, the Global Forum of Health is predicting that mental ill health will soon be in the top three burdens of ill health worldwide with heart disease and perinatal conditions (www.globalforumhealth.org). Adverse nutrition is involved in the aetiology of all three conditions.
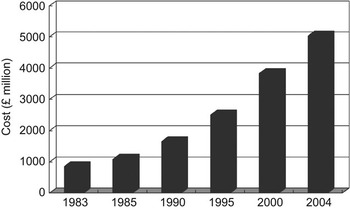
Fig. 1 The rising cost of mental ill health in the UK, limited to immediate costs associated with hospital health care, 1983–2004. Information from Lord Warner in reply to a Parliamentary Question by Lord Morris of Manchester(12) on gross expenditure (£ million) only on mental illness elements of the National Health Service Hospital and Community Health Services budget
The 1972 prediction that brain disorders would follow on the rise in CVD was based on the nutrition of the fetus being dependent on the placenta, which is a very fast-growing vascular system. Moreover, the cardiovascular system develops early in the human embryo to feed the large energy demand of the developing fetal brain. The development and growth thrust of the fetal brain in the last trimester are intimately dependent on a healthy vascular system. Seventy per cent of the energy sent by the placenta to the fetus is used in human fetal brain growth. The implication of a diet high in saturated fat in heart disease and atherosclerosis meant that although young women are better protected, the same would eventually impact on neurogenesis.
Feeding a high-fat diet to pregnant rats was found to restrict transfer of the essential PUFA required by vascular and neural development, with vascular dysfunction detectable in the newborn(Reference Ghebremeskel, Bitsanis, Koukkou, Lowy, Poston and Crawford13, Reference Ghosh, Butsanis, Ghebremeskel, Crawford and Poston14). Both vascular dysfunction and lipid distortion persisted into adulthood, adding experimental evidence for the concept of prenatal programming(Reference Armitage, Lakasing, Taylor, Balachandran, Jensen, Dekou, Ashton, Nyengaard and Poston15, Reference Barker16) and confirming the effect of an atherogenic diet in the mother affecting fetal essential PUFA and its vascular system. There is ample experimental and human data(Reference Birch, Garfield, Castaneda, Hughbanks-Wheaton, Uauy and Hoffman17) on the importance of essential PUFA in neurodevelopment(Reference Crawford, Golfetto, Bistanis, Ghebremeskel, Min, Moodley, Poston, Phylactos, Cunnane and Schmidt6). The likelihood that the increase in many brain disorders has been engineered by nutritional distortions, which in the last century precipitated the rise in heart disease, is strong.
The view that man evolved as a hunter–gatherer meant eating meat. If animal fat were a cause of degenerative disease it would not have been compatible with an upward thrust of cerebral expansion. Moreover, the aorta of lions and other top carnivores in the wild are free from the fatty lesions seen in young Western human subjects who died accidentally or in war(Reference Joseph, Ackerman, Talley, Johnstone and Kupersmith18). Animal fats are not intrinsically atherogenic. It is more likely that it is the manner in which the animals are reared and fed, with the consequent quantitative and qualitative alteration of the fats, which is the culprit. In the 1970s, chickens were considered a lean option to fatty red meat(Reference Shaper19). In the present paper we report the results of total and saturated fat and fatty acid analyses of poultry products purchased between 2004 and 2008 and how they compare with historical data.
Methods
Samples
Birds were purchased from supermarkets and farm shops in different locations across the south-east to the mid-west of England. This represented, in our view, a cross-section of what was being sold and bought. Several were supplied to us by Channel 4’s Dispatches, ITV’s Tonight with Trevor McDonald, Hugh Fearnley-Whittingstall and colleagues in Chelsea Football Club who were interested in the composition of the food they were buying to give to their players. We also made independent purchases from farms and supermarkets. The present report is not an analysis of breed, husbandry or feeding method; this would be a large-scale, costly exercise. The Department for Environment, Food and Rural Affairs turned down a request by Elm Farm Research for such an analysis; hence it is important that these limited data be made public. It should be noted that the data herein represent only a snapshot of what is available to the public. Our data have been shared with the industry at two industry-organized conferences.
Analytical
The analysis of the chicken samples was conducted as previously described in our analysis for the fat and fatty acid composition of foods for the McCance and Widdowson supplement on fatty acids(20). Total lipids from the whole carcass or meat were extracted according the method of Bligh and Dyer(Reference Bligh and Dyer21) or Folch(Reference Folch, Lees and Stanley22). Methylation was carried out by the method of Sato and Murata(Reference Sato and Murata23). Previous experience of chicken analysis was obtained in the 1970s in support of a programme on maternal nutrition and pregnancy outcome in the East End of London, together with analyses done for the Laboratory of the Government Chemist and the Coronary Prevention Group. The data from these previous analyses were used as a comparison(Reference Doyle, Crawford and Laurance24, Reference Crawford, Gale, Woodford and Casperd25). In addition, we had data generated during an Agricultural and Food Research Council (the precursor to the Biotechnology and Biological Sciences Research Council) project on encephalomalacia in chickens(Reference Budowski, Hawkey and Crawford26). Most of the detail of the 1970 data is no longer available but enough exists, together with other published data, to substantiate the conclusions (Table 1). The situation of chickens as a lean product is also confirmed by the 1976 report from the Royal College of Physicians and British Cardiac Society, chaired by Professor A.G. Shaper; within its recommendations on the prevention of CVD was the reduction of fatty red meat consumption and an increase in the consumption of low-fat, lean poultry(Reference Shaper19).
Table 1 Data on energy from fat and protein in chicken, 1870–2004. Although these data represent spot checks, anyone who recalls chickens in the 1950s–1970s will remember the tiny amount of fat that fell out when roasted. Today, the roasting pan contains much fat after cooking. While some may throw this away, that represents a considerable waste of energy. Some may use the juice and with it the fat for gravies and sauces or for further cooking
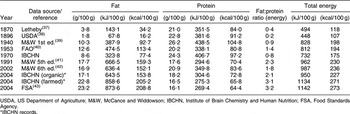
USDA, US Department of Agriculture; M&W, McCance and Widdowson; IBCHN, Institute of Brain Chemistry and Human Nutrition; FSA, Food Standards Agency.
*IBCHN records.
Heptadecanoic acid (17 : 0) was used as an internal standard in the lipid fractions for the quantitative analysis. Fatty acid methyl esters (FAME) were prepared from the lipid fraction reacted with 4 ml of 15 % (v/v) acetyl chloride–methanol solution in a sealed vial at 70°C for 3 h. FAME were separated by GLC (HRGC MEGA 2 Series; Fisons Instruments, Milan, Italy) fitted with a BP capillary column (30 m × 0·32 mm internal diameter, 0·25 μm film; SGE Ltd, Milton Keynes, UK). Hydrogen was used as carrier gas. The temperature of the injector, oven and detector were 240, 195 and 260°C, respectively. FAME were identified by comparison of retention times with authentic standards and interpretation of equivalent chain-length values. Peak areas were integrated and normalized by using computer software (EZChrom 6·6 Chromatography Data System; Scientific Software, Inc., San Ramon, CA, USA).
The phospholipids (PL) were separated from the total lipids by TLC on pre-coated silica gel 60 plates (Merck KGaA, Darmstadt, Germany), using a developing solvent system of chloroform–methanol–methylamine (65:35:15, by vol.) with 0·01 % (w/v) butylated hydroxytoluene as an antioxidant. The different lipid or phosphoglyceride bands were visualized by spraying a methanol solution of 2,7-dichloroflurescein (0·01 %, w/v) on the developed plates and identified by the use of authentic standards. High-purity (industrially defined as AnalaR, which refers to a reagent that conforms to the tests and purity standards in ‘AnalaR Standards for Laboratory Chemicals’) solvents and reagents were used throughout.
After extraction and methylation, total fatty acids were analysed, as were their FAME, using GLC (HP G 1800 B; Agilent, Palo Alto, CA, USA) fitted with a programmable temperature vaporizer–injector, a fused silica Omega-wax 250 (Supelco, Dorset, UK) capillary column and a mass ionization detector. Fatty acids were identified by comparing mass spectra obtained against records from the library of the National Institute of Standards and Technology and retention times from various commercial standards. Values of the individual fatty acids were expressed as a percentage of total FAME or as total amount calculated from the inclusion of the internal standard.
Values were expressed as a weight percentage of the total fat. We express the analysis to the relative amounts of principal essential PUFA in the present study to facilitate comparison with published data. The original fatty acid data were obtained on 5 ft packed columns with each sample run on columns of contrasting polarities on polyethyleneglycoadipate and Apiezon M, to resolve overlapping peaks. The disadvantage with the packed columns was the size of the sample required and the poorer sensitivity compared with capillary columns. The much greater signal to noise ratio of the capillary columns offered greater selectivity, which obviated the need for two-dimensional (2D) runs. When we introduced capillary columns in the 1970s we compared their performance with the 2D packed columns on biological samples (muscle, blood, liver and brain). With meat (muscle) samples, for fatty acids present at greater than 1 % of the total, the agreement with the 2D method was better than 95 %; so that it is reasonable to compare the data obtained for the principal fatty acid peaks now with those previously analysed by 2D packed columns of the 1960s and 1970s by the same laboratory team. The fatty acid proportions in total were analysed to represent the profile of fatty acids in food bought to be eaten.
The ratio of TAG to total PL was used to compare the proportion in storage fat to cellular structural fats. PL are used specifically in cellular membrane lipids, so they are representative largely of the cellular bilayers of the tissue. Moreover, the PL of active cellular material are rich in essential PUFA and in particular the C20 and C22 chain-length fatty acids of the n-6 and n-3 families. The TAG, by contrast, are representative of adipose fat, the major energy storage system. Fatty acid data are presented as the mean and the standard deviation of the mean where more than five samples were analysed.
Results
It has to be emphasized that no attempt was made to assess breed or geographical location, or indeed to define performance in relation to the different feed systems on offer. At the same time there is much commonality in breed, feed systems and management principles, probably dictated by the demands of supermarkets for uniformity. Nor did we set out to detail differences between different methods such as organic, free range or battery production systems. The aim was to obtain an image of what people are eating sparked by discussions with Elm Farm Research.
Hence the data presented here simply represent the state of what is bought by the consumer in certain locations in the UK. We were informed by television researchers (McDonald and Fearnley-Whittingstall) that over 90 % of the chickens eaten in the UK come from the intensive system and are reared under uniform conditions as demanded by the supermarkets. Our data only hint at the type of differences between conventional, organic and free range.
Fat/protein energy content of the carcass
A search of the literature and our own data reveals that while chicken was at one time a lean, low-fat food, it is no longer (Table 1). Even without our data, the high fat content is confirmed by McCance and Widdowson’s data in the fifth and sixth editions and the website of the Food Standards Agency, which records 20 % carcass fat in contemporary chickens. While it might be argued that methods used for analysis in 1870 and 1896 are not comparable to current methodology, it needs to be remembered that the analysis of fat and protein does not require high technology. Indeed, in the 1940 publication of McCance and Widdowson’s The Composition of Foods, fat analysis is referred to as being done by von Leiberman and Szekely’s method of 1898. Any difference between then and now is unlikely to be major as the key measurement is weight. The assessment of weight was one of the first analytical methods to be perfected to a high degree over a century ago. The accuracy of weighing systems has advanced only at the microgram level and with the development of electronic readout. Indeed, the protein data from 1870 and 1896 are not significantly different from that reported by McCance and Widdowson and the FAO in the 1940s and 1950s.
Essential PUFA content of the meat
The data in Table 2 suggest a loss of DHA, the principal n-3 fatty acid of muscle-cell PL and in the brain. Under full free-range conditions the chickens would have access to green foods and insect sources of n-3 fatty acids. The proportions of n-3 essential fatty acids in the contemporary chickens we purchased were low. The historical figure of 170 mg DHA/100 g chicken meat is comparable to that of wild birds. These figures appear in the McCance and Widdowson tables of the fat and fatty acid supplement we obtained jointly with the Laboratory of the Government Chemist to ensure reproducibility and confirmation by two laboratories in the 1970s. Twelve samples obtained from twelve different outlets were analysed to obtain these data. Modern broiler chickens had about a fifth of the 1970s value.
Table 2 n-6 Fatty acids, linoleic acid (LA) and DHA in poultry meat, 1970–2006. The loss of DHA is almost certainly associated with the use of LA-rich n-3-deficient cereals and also the lack of exercise and loss of mitochondria-rich muscle. Note the high level of LA in the more recent analyses

M&W, McCance and Widdowson; IBCHN, Institute of Brain Chemistry and Human Nutrition; USDA, US Department of Agriculture.
*Data were first obtained in 1970; later the data were reanalysed on twelve samples in collaboration with the Laboratory of the Government Chemist and were then included in M&W’s original supplement on fatty acidsReference Paul, Southgate and Russell(44).
†IBCHN records.
In Table 3 we present some novel fatty acid data on the TAG and PL. The PL are inherent in cell structures, subcellular organization and function. It is important to note that AA and DHA are concentrated in PL and not TAG. The TAG:PL ratio presented in Table 3 is evidence of a distortion of the balance between cell structural lipids, which represent the ‘real’ muscle (meat) fat, as opposed to the storage fats – the TAG. A truly surprising amount of TAG was found in the skinless meat.
Table 3 Storage (TAG) and structural fats (phospholipids, PL) in different meats sold for human consumption in the UK (data per 100 g product): samples of supermarket- and farm-bought chickens. TAG are the storage/energy fats largely deposited in adipose tissue, but under excess feeding and lack of exercise can infiltrate muscle. It is likely that inadequate supply of essential fatty acids, particularly the n-3 fatty acids, will exacerbate an increase in TAG. In normal muscle/meat, there should be more PL than TAG. While much of the fat is subcutaneous, removal of the skin apparently can leave a significant amount of fat on the meat. With lack of exercise, the possibility that there may be some degree of TAG infiltration into the meat needs to be assessed
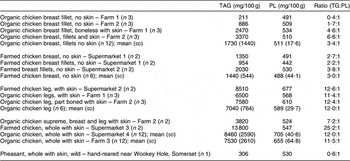
In the organic chicken the TAG content was among the best (TAG:PL = 0·4:1, similar to the pheasant) but it was very high, at worst 12·6:1, for individual chicken pieces. The high TAG content in samples without skin raises the question as to the origin of the TAG in the meat. It is claimed by the Department of Health that skin should be removed, as this is where the fat is stored. Our methods do not detect whether the TAG fat was infiltrating the muscle, as in marbling in beef, or if freezing and thawing resulted in migration of such fat. One supermarket whole chicken was worse still at 25·2:1.
There is an unusual finding in Tables 4 and 5, where we report evidence of a distortion of the balance between the n-3 fatty acid docosapentaenoic acid (DPA) and DHA. Small mammals and our Rhode Island Reds had high levels of DHA in relation to the DPA precursor. The switch towards precursor is typical of large, fast-growing mammals, not small mammals and birds.
Table 4 Essential PUFA content of TAG and phospholipids (PL) in different chicken samples from UK farms and supermarkets. The PL come mainly from meat; the TAG represent surplus energy store. Under normal conditions in muscle (meat) the lipid should be mainly PL. An excess of TAG over PL is an index of overfeeding. The surprise is that, except for one, the organic products are little better for the n-6:n-3 ratio than non-organic. Feeding organic cereals complies with the organic regulations but distorts the n-6:n-3 ratio. Being organic is not a guarantee of nutritional value per se
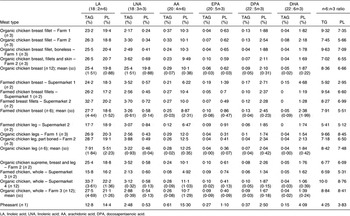
LA, linoleic acid; LNA, linolenic acid; AA, arachidonic acid; DPA, docosapentaenoic acid.
Table 5 Ratio of docosapentaenoic acid (DPA) to DHA of standard broiler chickens. Traditional chicken and wild birds contain more DHA than DPA. For example, in the 1970s studies on chickens (Rhode Island Reds)(Reference Budowski, Hawkey and Crawford26), DPA:DHA = 0·31 or conversely DHA > DPA by a factor of 3·2. DHA comprised 8·5 % of the fatty acids in liver ethanolamine phosphoglycerides. In chicken plasma total phospholipids, DPA:DHA = 0·56 or conversely DHA:DPA = 1·79 and in chicken breast 2·86. In small mammals and birds, there is consistently more DHA than DPA. It is only in the large, fast-growing animals such as pigs, horses and buffalo that the amount of DPA is typically greater than DHA
Note: There was one exception with an organic chicken with DHA = 3·06 % and DPA = 1·87 %.
Discussion
The rise in fat content of domestic livestock and the high-fat meat owe their origin to changes in management. Four major events were responsible:
1. Confining animals to enclosures in the 18th century.
2. Selecting those that gained weight fastest (they earned more at market).
3. The development of high-energy foods and growth promoters.
4. The restriction and final denial of exercise by keeping the animals in an enclosed space with food permanently available.
In early times, customary rights of usage and common land gave individuals access to several hundred acres of land. Then came the enclosures of the 18th century which Arthur Young described as a rational enlightenment, allowing implementation of new agricultural methods. The enclosures made possible the introduction of new crops like turnips and the four field rotation of wheat, roots, barley and clover. In the mid-lands, grass and animal husbandry dominated. The enclosure of animals into fields meant that the choice of what the animal ate was taken from it. Instead of the Gainsborough picture of animals in forests with access to browse sedges and herbs, and a large space in which to move, they were restricted to grass pasture with less space. As more animals were packed into the small fields they cropped the grasses more heavily, maintaining a pasture of young growing shoots which are packed with energy and gave increased weight gain, much of it fat. Normally fat is gained in spring to serve energy needs during the winter. The fat had multiple purposes. It was eaten and also rendered down to provide soap, wood, leather, boot and saddle polishes, and importantly candles to light the homesteads.
The enclosures offered a captive means to improve feeding throughout the year. Selective breeding for weight gain commenced on this regime and the animals soon earned the title of ‘fat stock’. In the 20th century, growth promoters, selective breeding and finally the finishing of animals indoors with high-energy foods led to the loss of muscle, fat infiltration and a carcass fat of about 30 %. This meant that by the latter half of the 20th century, the energy in carcass fat was 6·75 times that from protein. Perhaps using this past experience as a justification, a somewhat similar process seems to have occurred recently with chickens.
In 1976 the Royal College of Physicians jointly with the British Cardiac Society recommended in their report on diet and heart disease to eat less fatty red meat and to choose more poultry because it was lean(Reference Shaper19). Moreover, it was then followed by a joint consultation in 1978 by FAO and WHO(3) which came to the same conclusion and called for a reduction in the amount of carcass fat. While chicken was lean then, in 2004 a chicken thigh purchased from an organic farm contained 418 kJ (=100 kcal) more energy than a chicken thigh did in the 1970s. A chicken carcass now contains two to three times the energy coming from fat compared with protein. Parents may think they are still feeding their children a low-fat product, as it was in their youth, but are unknowingly feeding their children on a high-fat product. The cocktail of gene selection for fast weight gain, lack of exercise and high-energy food available 24 hours a day, is a simple and well-understood recipe for obesity.
With the intensification of chicken rearing came the streamlining of their food based on cereals or grains, i.e. food rich in n-6 with little n-3 fatty acids. The primary food source of n-3 fatty acids is green plants and the tiny animals that eat green plants. These would have majored in the diet of the jungle fowl or a fully free-range chicken’s natural diet. Confining animals indoors and using cereal feeds has resulted in products with high n-6 and low n-3 content. This would happen regardless of whether the animals are fed with organic food or even if given a greater amount of living space as in the Freedom Food system. Cereals, whether organic or not, can have an n-6:n-3 ratio greater than 50:1. The relevance to human nutrition is that chickens and their eggs used to be one of the few land-based sources of DHA. The decline of dietary DHA and the disturbance of the n-6:n-3 ratio are thought to be contributing to the rise in mental ill health(Reference Hibbeln, Nieminen and Lands27). According to the health audit published in 2005(Reference Andlin-Sobocki and Wittchen11), the cost of brain disorders has now overtaken all other burdens of ill health in the EU. Heart disease, traditionally the most costly, stood at just 17 % of the total. Brain disorders were recorded at 25 % of the total, an estimated cost of €386 billion at 2004 prices for the twenty-five member states. Included in this cost is the rise in mental ill health among children possibly associated with the reduction in dietary n-3 fatty acids, particularly from seafood(Reference Tanskanen, Hibbeln, Tuomilehto, Uutela, Haukkala, Viinamaki, Lehtonen and Vartiainen28). The ALSPAC (Avon Longitudinal Study of Pregnancy and Childhood) study in Bristol, UK, involved over 14 000 pregnancies with follow-up of the children to school age. Having controlled for confounding variables, the researchers were left with a significantly higher rate of reduced verbal IQ and increased behavioural problems at 7–8 years of age related to minimal or absence of n-3 fatty acids from fish consumption recorded in the pregnancies(Reference Hibbeln, Davis, Steer, Emmett, Rogers, Williams and Golding29). Conversely, the study described a virtually straight-line correlation between maternal long-chain n-3 (EPA and DHA) consumption in pregnancy and the social and verbal IQ of the schoolchildren at 8 years of age. Chicken should be a primary source of n-3 DHA because its precursor, α-linolenic acid, is part of their naturally balanced diet and is required for the production of a healthy chick brain(Reference Budowski, Leighfield and Crawford30).
Of special interest is the novel finding of a switch between DPA and DHA. The conversion of DPA to DHA requires a Δ6 desaturation of its chain elongation product (24 : 5n-3). The desaturation product dihomodocosahexaenoic acid (24 : 6n-3) is then β-oxidized to DHA (22 : 6n-3) in the peroxisomes, from where it is exported to the reticulo-endothelial system(Reference Sprecher, Luthria, Mohammed and Baykousheva31). This process is time-consuming especially as the Δ6 desaturation is a rate-limiting step. Nevertheless, DHA and not DPA is used exclusively in the brain regardless of species(Reference Crawford, Casperd and Sinclair5). Other than the brain, there is wide variation of fatty acid composition in different organs and different species. Small mammals, including birds and indeed old fashioned poultry, consistently have more DHA than DPA in liver and muscle lipids. However, the large fast-growing mammals fail to fully synthesize DHA in liver and muscle, which results in a higher proportion of DPA(Reference Crawford, Gale and Woodford32). The reversal of this balance between DHA and DPA in intensively reared chickens is most unusual and a new phenomenon. It is likely to be the result of genetic selection for fast growth outstripping the biosynthetic process, so further devaluing the product as a natural land-based source of DHA. This devaluation of nutrients due to gene selection for weight gain has been done without counting the cost of nutrient density.
Whatever action has been taken by the industry to reduce animal fat(Reference Sun, Coon, Mark, Poch, Rosebrough, Ashwell and McMurtry33) is to be welcomed but what we report here is a substantial discrepancy; more energy coming from fat than from protein with a reduction in n-3 fatty acids and both likely to impact on human health. There may also be unease at the cost to the industry and the high carbon footprint of a high-energy input being converted to fat that people do not want and are advised against by health experts. The industry has justified the intensive broiler system in the media, saying that the public wants cheap food. This stance omits consideration of quality. If one takes DHA as the limiting nutrient for assessment of quality, then to obtain the same amount of DHA from intensively reared chickens today as would have been obtained in the 1970s, one would be required to eat six chickens – ingesting somewhere in the region of 37 600 kJ (=9000 kcal).
Explanations for the tripling of obesity since 1980(34) include a lack of exercise, fast food, social factors, television, schoolchildren’s snacks, sugary drinks, genes and ethnic backgrounds. The National Institute for Health and Clinical Excellence, the Food Standards Agency and the National Collaborating Centre for Primary Care(35) have published recommendations to deal with the ‘obesity epidemic’. Yet there is no reference to the changing composition of foods.
At the extremes we encountered of high-fat chickens, the possibility that is that they are technically obese. This situation raises concerns for animal welfare as well for human nutrition: does eating obesity cause obesity in the consumer? Moreover, the dilution of micronutrients by the high energy density has diminished the value of poultry as a source not only of DHA but also of a range of micronutrients. For example, the loss of dark meat in these animals is a reflection of the loss mitochondria packed into the fast-acting muscle fibres due to indoor confinement and lack of exercise. In biochemical terms it means the increase in the TAG:PL ratio of the meat will be associated with the loss of B vitamins, Fe and other elements packed into mitochondria.
The increase in brain disorders this century has catapulted mental ill health to cost £77 billion in the UK during 2008, greater by far than all other burdens of ill health(Reference Nurse36). Although the intensification of chickens alone cannot be responsible for this rise in brain disorders, it is part of a package in the changing food system that has ignored the nutrient requirements of people and, specifically in this case, for the brain. It would be helpful if human food production was again linked to human nutritional requirements as its first priority, as was achieved during World War II by Professor Sir Jack Drummond.
Acknowledgements
This research received no specific grant from any funding agency in the public, commercial or not-for-profit sectors. The authors have no conflict of interest to declare. All four authors wrote the paper led by M.A.C. Y.W. carried out the analyses under the supervision of K.G. C.L. contributed background information on animal biology and welfare. We wish to express our appreciation to the Mother and Child Foundation, the Letten Foundation and London Metropolitan University for support of the part of this work involved in assessing food composition to define nutrient intakes in pregnancy. We are also grateful to the BBC, ITV’s Tonight with Trevor MacDonald, and Channel 4’s Dispatches and Hugh Fearnley-Whittingstall for providing the incentive and for some of the chicken samples. We are grateful to Chelsea Football Club for initiating this chain of reaction by asking how much n-3 fatty acids their players were eating.


