


The Food Stamp Program (FSP) is the largest of the food-assistance programmes in the USA. Although FSP is a critical component of the safety net for needy families and individuals, not everyone who is potentially eligible chooses to apply. Some people may not realise they are eligible for FSP or do not know how to apply, whereas others may perceive less need to enrol in the programme. The latter may be particularly true among FSP-eligible households with slightly higher incomes, since the amount of food stamps they are eligible to receive would be relatively low. Stigma and/or fear associated with receiving government aid are other reasons why some low-income people do not apply.
Studies using national, regional and local data sets have examined the characteristics associated with FSP participation in potentially eligible populations (Fig. 1). Some demographic characteristics associated with FSP participation are likely due to eligibility requirements (i.e. limits on assets) or related to categorical eligibility(Reference Daponte1, Reference Gundersen and Oliveira2). A national survey conducted in 1991–92 found higher FSP participation rates among Non-Hispanic Black, compared to other households(Reference Gundersen and Oliveira2). However, in the 1999 Current Population Survey, neither race nor Hispanic ethnicity was a predictor of FSP participation after controlling for other demographic and income variables(3). Two smaller, local surveys found that FSP participation among Non-Hispanic Black households is lower than in Hispanic (mainly of Puerto Rican descent) and White households(Reference Martin, Cook, Rogers and Joseph4, Reference Biggerstaff, McGrath Morris and Nicholds-Casebolt5).

Fig. 1 Characteristics independently associated with Food Stamp Program participation in previous studies (WIC, Special Supplemental Nutrition Program for Women, Infants, and Children)
Need, access and awareness of eligibility have all been associated with FSP participation. Perceived need is low among potentially eligible non-participants who are food sufficient(Reference Gundersen and Oliveira2, Reference Haider, Jacknowitz and Schoeni6). Low-income people who work more than 40 h/week are less likely than other households to participate, possibly because they cannot access FSP offices during normal business hours(Reference Zedlewski and Rader7). Lack of awareness as well as avoidance of government programmes appear to be barriers among immigrant groups. In Boston, researchers conducted chart reviews and in-hospital interviews less than 48 h after delivery among 171 women, half of whom were not US citizens(Reference Geltman and Meyers8). Fewer of the immigrants (documented or undocumented) believed their newborn was eligible for FSP, compared to US citizens (59 % v. 79 %, P < 0·01). In contrast, belief about the infant’s eligibility for the Special Supplemental Nutrition Program for Women, Infants, and Children (WIC) was high (92 % for US citizens; 98 % for documented immigrants and 84 % for undocumented immigrants). These differences may, in part, be due to the requirement of US citizenship (with some exceptions) to be eligible for FSP but not for WIC.
To examine the FSP participation rates among the elderly, Haider et al. used data from the 1998 and 2000 Health and Retirement Study (HRS), a large, nationally representative sample with detailed information on income and wealth(Reference Haider, Jacknowitz and Schoeni6). Among the elderly, the low participation rate does not appear to be primarily due to errors in estimating eligibility for FSP. In fact, when more accurate measures of income, wealth and expenses are available, participation rates are even lower. With the best estimates, the rate drops from 41·4 % for 50–59-year-olds to 20·8 % for those who are 80 years and older. After examining the effects of many demographic, economic and behavioural factors on FSP take-up rates, the researchers concluded that unmet needs are relatively low among the elderly.
Other factors may also account for low participation rates among the elderly(Reference Wilde and Dagata9). Focus-group interviews reveal that pride and perceived stigma of the programme are important barriers to participation among the elderly. Commonly mentioned barriers include confusion about eligibility, lack of transportation and language barriers. Memory loss and other cognitive changes in the elderly may pose barriers to accepting the new electronic benefits transfer technology or remembering a PIN (Personal Identification Number) needed to access benefits.
To determine whether providing information about eligibility would increase FSP enrollment, Daponte et al. conducted a study among 405 low-income, potentially FSP-eligible households in Pennsylvania(Reference Daponte, Sanders and Taylor10). Upon screening the households, the researchers found that many of these ‘potentially eligible’ households were in fact not eligible. Only half of those with incomes less than 130 % were deemed to be FSP-eligible upon screening. However, many were unaware of their eligibility status. Among a small number of non-participant, FSP-eligible households, outreach and information did play a significant role in increasing participation.
In the late 1990s, economic growth and policy changes in FSP eligibility rules appear to explain only 35–40 % and 2–5 %, respectively, of the decline in FSP participation(Reference Wilde11). Nord examined trends in food insecurity and food stamp participation to observe whether declines in FSP participation were also due to decreased perceived need(Reference Nord12). If FSP participation had decreased due to decreased need, then food insecurity should also be lower over the same period. Using data collected in the Current Population Survey, he found that prevalence of food insecurity among low-income households (less than 130 % of the federal poverty level (FPL)) was actually higher in 1999 (28 %) than in 1995 (23 %). This change was observed among all types of households, particularly among US citizens. These observations may suggest that the large unexplained decline in FSP participation among low-income households in the 1990s was due to confusion about eligibility, difficulty in accessing the programme or greater stigma associated with participation, rather than due to decreased need for the programme.
The purpose of the present research is to determine factors associated with FSP participation in a potentially eligible population, included in the California Women’s Health Survey (CWHS) from 2002 to 2004. To develop targeted and effective FSP outreach programmes, more information is needed on factors influencing participation. The specific research questions include the following:
1. What factors are associated with FSP participation in a potentially FSP-eligible population?
2. How do reasons for not applying differ by participant characteristics?
3. Are those women who say they do not need FSP truly less needy than women who give other reasons for not applying?
Methods
The CWHS, coordinated by the Survey Research Group, is an on-going annual telephone survey that collects data about health-related attitudes and behaviours from a randomly selected sample of women(13). Below is a brief description of the procedures currently used in the CWHS, including the years from 2002 to 2004. The survey asks about past and present involvement in health-care systems, participation in public- and food-assistance programmes, food insecurity, prenatal care, breast-feeding, vitamin use, physical activity, substance use, utilisation of cancer-screening procedures, domestic violence and demographic information. Trained interviewers conduct the interviews in English or Spanish. The questionnaire contains about 200 questions, and the English version takes about 30 min to administer. Data are collected monthly from January through December. The protocol pertaining to recruitment and data collection has been approved by the California Health and Human Services Committee for Protection of Human Subjects.
A screened random digit dial sample is used in the CWHS. All women who are 18 years and older and live in the selected household are eligible to participate in the survey. If more than one per household is eligible, one woman is randomly selected for an interview, conducted either at that time or later by appointment. Interviewers make two additional attempts to recruit participants who refuse initially to participate. Fifteen attempts are made to contact households with busy signals, who do not answer or with message machines. The response rate was 72 % in 2002 and 2003, and 74 % in 2004.
Definitions of variables
Key variables in the analysis were defined as follows:
1. Current FSP participation: participant has received FSP in the past 12 months.
2. Potentially eligible for FSP: household income less than 130 % of FPL and not denied FSP.
3. Reasons for not applying for FSP:
(a) No need: ‘don’t need them’.
(b) Lack of information: ‘don’t think I am eligible’ or ‘don’t know how to get them’.
(c) Too hard: ‘too hard to apply’.
(d) Stigma: ‘don’t want government help’ or ‘too embarrassed’.
(e) US citizenship: ‘worried about US citizenship status’.
4. Level of need:
(a) Food security level (based on a six-item subset of the federal Food Security Module(Reference Radimer14)).
(b) Considers income adequate for basic needs (yes or no).
(c) Use of emergency food banks (yes or no).
Data analysis
Since the characteristics associated with FSP participation were similar across the three years (2002, 2003 and 2004), the data sets were pooled and yielded a final sample size of 527 FSP participants and 1405 non-participants in the potentially FSP-eligible population to examine question #1. In exploring reasons as to why women do not apply for FSP, responses were available on 1390 potentially eligible non-participants (questions #2 and #3). To examine the potential effects of US citizenship status, the sample was restricted in some of the analyses to either US-born women or foreign-born women who were likely to have at least one US-born child, based on the woman’s date of entry in the USA and the birth date of the youngest child. Thus, presumably the last child is a citizen if born after the mother’s date of entry in the USA. In the analysis, the data were weighted to reflect the age and race characteristics of the California population in the year 2000.
To identify variables associated with FSP participation, bivariate analyses were carried out using χ 2 analysis. Multivariate analyses, using logistic regression, were carried out to identify factors that are independently related to FSP participation. All of the multivariate analyses were carried out adjusting or controlling for income level. To avoid collinearity or redundancy problems in the regression, best variables, defined as having P < 0·10 significance level, were selected using stepwise procedures in three stages: (i) enter and select best demographic variables (age, education, race/ethnicity, household composition, employment status, immigrant status); (ii) enter and select best other private and public assistance variables (emergency food bank, welfare, WIC, past foster care, insurance status); and (iii) enter and select best health and psychosocial variables (feeling overwhelmed, poor mental/physical health, pregnancy status, disability). The final step examined the best candidate variables in a stepwise logistic regression analysis, using those variables that were significant at P < 0·05 from each of the three stages.
After determining which subgroups were less likely to be FSP participants, additional χ 2 analyses were carried out to find out whether the reasons for not applying for FSP and level of perceived need differed among these groups. SAS version 9.0 was used in all the analyses (SAS Institute, Cary, NC, USA). The protocol for the data analysis was exempted from human subjects review by the University of California Institutional Review Board since the CWHS is a public data set without personal identifiers.
Results
In CWHS 2002–2004, the self-reported FSP participation rate was 0·27 among all potentially eligible households (<130 % of FPL and not denied Food Stamps). When only those households with US-born women and/or children were considered, the participation rate was 17 % higher (0·317).
What factors are associated with Food Stamp Program participation?
Among all potentially eligible households, FSP participants reported more psychosocial/health problems and other disadvantages than non-participants (Table 1). FSP participants were more likely to be unemployed; single mothers with children; on welfare, WIC and/or emergency aid; formerly in foster care; and uninsured. They were also more likely than non-participants to have experienced domestic violence; have poor mental and physical health; feel sad and overwhelmed; and be pregnant. FSP participants, compared to non-participants, were less likely to be Hispanic/Latino, to have been interviewed in Spanish and to be foreign-born. Fewer younger (<25 years) and older (55 years and above) women participated in FSP, compared to middle-aged women (25–54 years).
Table 1 Characteristics of FSP participants and all potentially FSP-eligible non-participants, CWHS 2002–2004
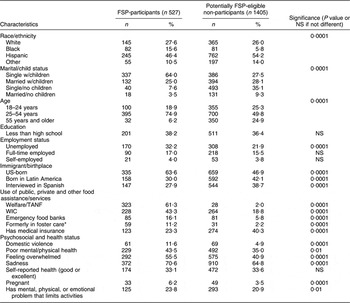
FSP, Food Stamp Program; CWHS, California Women’s Health Survey; WIC, the Special Supplemental Nutrition Program for Women, Infants, and Children; TANF, Temporary Assistance for Needy Families.
*Whether the subject had ever been removed from her home by the state, county, or court and went to live with people other than parents.
In the logistic regression analysis including all potentially eligible households (Table 2), the following remained independently and positively related to FSP participation: single mother with children; unemployed; on welfare; on WIC; and US-born. Women under 25 years and older than 54 years were less likely to participate than women aged 25–54 years. Two variables – US-born and Hispanic/Latino ethnicity – were almost interchangeable in the models including all potentially eligible households, although the former was positively related and the latter was negatively related to participation. When the analyses were repeated among only those potentially eligible households who were also likely to have US citizens (either the respondent or respondent’s child), the effect of the respondent’s being US-born was attenuated but still significant (OR = 1·17; 95 % CI 1·08, 1·28).
Table 2 Factors associated with FSP participation, CWHS 2002–2004*

FSP, Food Stamp Program; CWHS, California Women’s Health Survey; WIC, the Special Supplemental Nutrition Program for Women, Infants, and Children; TANF, Temporary Assistance for Needy Families.
*Adjusted for percentage of federal poverty level, n 1932.
Why do low-income women not use the Food Stamp Program?
Responses to the question on why potentially FSP-eligible women do not apply for FSP are shown in Table 3. The main reason for not applying among all types of households is ‘don’t need them’. However, over one-third either do not think they are eligible or do not know how to apply. The foreign-born women were more likely than the USA-born women to cite reasons related to stigma and worry about US citizenship.
Table 3 Reasons why low-income women do not apply for the Food Stamp Program
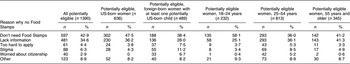
All comparisons by birthplace or age group were conducted with χ 2 analysis and found to be significant at P = 0·001 or lower.
When compared by age, younger non-participants were more likely to cite ‘don’t need them’ as a reason for not applying, compared to older women. Older women did not cite stigma more often than did middle-aged women; they also do not cite ‘don’t need them’ more often than do the youngest women. However, 31 % of the women aged 55 and older think they are not eligible, compared to 17·6 % of the women aged 18–25 years.
Are those women who say they do not need Food Stamp Program truly less needy?
To find out whether some non-participants are less needy, reasons for not applying are compared against indicators of need (Table 4). Potentially eligible non-participants who cite ‘don’t need them’ as a reason for not applying are less likely to be food insecure, to have inadequate income and to use alternative emergency aid, compared to women citing all other reasons. The highest level of need is among those who cite worry about US citizenship or stigma as reasons for not applying.
Table 4 Indicators of need among all potentially eligible low-income women who do not apply for the FSP, CWHS 2002–2004 (n 1390)
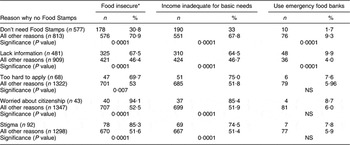
FSP, Food Stamp Program; CWHS, California Women’s Health Survey.
*Based on six food security items, where food insecurity is defined as affirmative response to five or more items.
Discussion
In the present study, the strongest positive FSP predictors – welfare, unemployment, single motherhood – are consistent with the view that FSP in California is serving a very high-need population. Lack of eligibility due to US citizenship status may only partially explain the lower participation rate among low-income Hispanic, immigrant women. In particular, barriers to applying and stigma are reported more often among potentially eligible foreign-born women, compared to the USA-born group. Overall, the profile of FSP participants matches the perceptions expressed by limited income focus groups in California(15). In those discussions, FSP was viewed as filling an important need for people who are unemployed or are in a crisis situation but it was also considered a last resort for help. The Spanish-speaking participants expressed many barriers apart from US citizenship that impeded access to the programme. A study of food pantries in Los Angeles found limited English ability to be a barrier to FSP participation(Reference Algert, Reibel and Renwall16). Language ability may act as a proxy for immigration status, since in the CWHS, birthplace is more strongly and independently related to FSP participation than the language spoken.
Our ranking of reasons as to why people do not apply for FSP is different from that provided by food bank staff in California in 2005(17). In that report, Food Bank staff ranked the fear that FSP would hurt immigration chances as the most important reason why people do not apply. Other high-ranked reasons included lack of communication and misconceptions about eligibility. At the bottom of the list was ‘people don’t think they need them’. Since the CWHS asks a random sample of the population directly as to why they do not apply, it is not surprising that the ranking reported here might differ from observations of food bank staff. The response option – ‘don’t need them’ – might be the most socially acceptable answer, but our findings also show that people who give that reason are more likely to be food secure and less likely to access emergency food banks than people giving other reasons for not applying.
Several other studies have reported lower participation rates among the elderly(Reference Haider, Jacknowitz and Schoeni6, Reference Wilde and Dagata9). In the CWHS, older women cite reasons related to lack of information for not applying more often than stigma. Since women experience more health problems with age, greater FSP outreach through health providers and senior services may be helpful. Messages could be tied to the benefits of using food stamps to buy more fruits, vegetables and high-fibre foods that may help older low-income women manage health conditions related to ageing.
Of concern are the very high rates of food insecurity among potentially eligible women who do not apply for reasons related to stigma and fear. Greater FSP outreach through trusted community-based channels may be needed. For example, since many immigrants with young children enroll in WIC, one approach might be an enhanced system of FSP referrals, particularly timed when clients become categorically ineligible for WIC. Similarly, FSP outreach messages to the low-income population should highlight the benefits of using food stamps to purchase a more healthful diet for the family. Other trusted channels include local health clinics, schools, churches and other community groups.
The estimated FSP participation rate for the CWHS sample (0·27–0·317) is much lower than the official state Program Access Index (PAI) of 0·421 for 2003. The lower estimate from the CWHS may be due to underreporting of the FSP status and/or household income. Other studies have found that underreporting of FSP status in surveys may be as high as 8–15 %(Reference Haider, Jacknowitz and Schoeni6). The CWHS figure is also not adjusted for assets or participation in the Food Distribution Program on Indian reservations and Social Security Insurance (SSI) benefits.
This study has other limitations that could be addressed in future studies. Since non-citizens are not eligible for FSP, this analysis attempted to determine potential US citizenship, based on whether the respondent was US-born or had given birth to a liveborn child since immigrating to the USA. One cannot tell whether or not the child was actually born in the USA (the woman may have travelled back to her home country to give birth). It would be preferable to add another follow-up question, if possible, that simply asks foreign-born women whether any members of her household are US-born or US citizens. Although rural/urban differences related to FSP participation are reported in other studies, this variable could not be analysed in the CWHS.
Strategies to increase participation in FSP should incorporate messages that change the public’s perception of the programme. Potentially eligible people need to see that FSP is not just for those in a crisis situation but is also meant to help the working poor, low-income seniors and struggling families. In addition to promoting the benefits of using FSP to purchase a healthful diet, other steps to simplify the application process, make people aware of their eligibility and improve customer service are needed to increase participation in underserved groups.
Acknowledgements
Data for these analyses were provided by the California Women’s Health Survey (CWHS) Group. The CWHS is coordinated by the California Department of Health Services in collaboration with the California Department of Mental Health, the California Department of Alcohol and Drug Programs, CMRI, the Department of Social Services, and the Public Health Institute. Questionnaire development and funding for the survey were provided by the collaborating programmes. Analyses, findings, and conclusions described in this report are not necessarily endorsed by the CWHS Group. I disclose that funding for the analyses in this report was provided by the Department of Social Services.


