


A total of 51 % of adult horses in southwest Virginia state, USA, are overweight or obese( Reference Thatcher, Pleasant and Geor 1 ) and with similar findings in Scotland( Reference Wyse, Mcnie and Tannahill 2 ) and the UK( Reference Stephenson, Green and Freeman 3 ), the rate of obesity may be similar in other equine populations. Obesity is a critical problem for the horse population due to the many negative downstream effects on health, welfare and performance. Negative health effects of obesity in horses include reduced reproductive performance( Reference Sessions, Reedy and Vick 4 , Reference Vick, Sessions and Murphy 5 ), reduced evaporative cooling and reduced athletic performance( Reference Sillence, Noble and McGowan 6 ), and insulin resistance( Reference Hoffman, Boston and Stefanovski 7 – Reference Vick, Adams and Murphy 9 ). The latter increases the risk of laminitis, a painful and debilitating condition of the equine hoof( Reference Treiber, Kronfeld and Geor 10 , Reference Treiber, Kronfeld and Hess 11 ).
Many factors influence the development of an overweight and obese state, but, simply, weight gain occurs when a surplus of energy is consumed relative to energy utilisation. Interestingly, Thatcher et al. ( Reference Thatcher, Pleasant and Geor 1 ) reported that the obese horses in the southwest Virginia study were consuming a forage-based diet, suggesting that horses are becoming overweight and obese on forage alone and not necessarily highly digestible commercial feeds and grains. Forage is high in fibre, which is not digested by mammalian enzymes due to the β-glycosidic bonds linking monosaccharide residues; however, fibres are digested by micro-organisms in the gastrointestinal tract (also known as gut microbes or gut microbiota), specifically the caecum and colon, of the horse( Reference Bergman 12 ). These gut microbes produce usable products (i.e. volatile fatty acids; VFA) from otherwise indigestible substrates. Acetate is the dominant VFA produced by equine gut microbes( Reference Elsden, Hitchcock and Marshall 13 – Reference Hussein, Vogedes and Fernandez 17 ). Diet and diet change influence faecal VFA concentrations in horses in that the acetate:propionate ratio is generally lower with increasing grain starch in the diet( Reference Hussein, Vogedes and Fernandez 17 , Reference Swyers, Burk and Hartsock 18 ). Furthermore, Julliand et al. ( Reference Julliand, de Fombelle and Drogoul 19 ) reported that the concentration of fibrolytic bacteria and acetate production were lower in the caecum and colon of horses fed hay plus barley v. horses fed hay alone.
Obese humans and rodents appear to have a unique gut microbiota as compared with their lean counterparts( Reference Ley, Bäckhed and Turnbaugh 20 , Reference Ley, Turnbaugh and Klein 21 ). Conventionally raised mice (those with gut microbes) have greater diet-induced weight gain than their germ-free (those without gut microbes) mouse counterparts( Reference Bäckhed, Ding and Wang 22 , Reference Fleissner, Huebel and Abd El-Bary 23 ). Furthermore, Turnbaugh et al. ( Reference Turnbaugh, Ley and Mahowald 24 ) reported that obese mice (ob/ob) have higher caecal acetate concentrations than non-obese wild-type mice. The role of VFA such as acetate on fat mass may be two-fold: VFA serve as an energy source and as ligands for G protein-coupled receptors with subsequent inhibition of lipolysis and stimulation of adipogenesis( Reference Roelofsen, Priebe and Vonk 25 , Reference Arora, Sharma and Frost 26 ). In horses, plasma acetate may be aerobically oxidised and directly used for energy( Reference Pethick, Rose and Bryden 27 ) or stored as TAG in adipose and skeletal tissue( Reference Suagee, Corl and Crisman 28 ).
The equine gut microbiota has received increasing attention due to the importance of gut microbes in equine health. The Firmicutes phylum dominates the hindgut (caecum and large colon) and faecal microbiome in horses (44–72 % of total bacteria)( Reference Daly, Stewart and Flint 29 , Reference Shepherd, Swecker and Jensen 30 ). The abundance of Bacteroidetes in horses varies between 4 and 49 % of total bacteria( Reference Willing, Voros and Roos 31 – Reference Shepherd, Pleasant and Crisman 33 ). In obese mice, pigs and human subjects there is an association between increased relative abundance of the Firmicutes phylum, along with a reduction in the relative abundance of the Bacteroidetes phylum( Reference Ley, Bäckhed and Turnbaugh 20 , Reference Ley, Turnbaugh and Klein 21, Reference Guo, Xia and Tang 34 – Reference Turnbaugh, Hamady and Yatsunenko 36 ). While this is an area of controversy due to the inconsistency in abundance of these two phyla in obese v. lean individuals, there is also variation between studies with respect to host species, samples evaluated (i.e. faecal v. intestine lumen v. intestinal mucosa), region of the gastrointestinal tract evaluated, and time point relative to obesity( Reference Ji, Kim and Park 37 , Reference Pedersen, Andersen and Molbak 38 ). Nevertheless, these phyla continue to be associated with obesity in recent studies( Reference Mujico, Baccan and Gheorghe 39 , Reference Verdam, Fuentes and de Jonge 40 ) and have not yet been evaluated relative to obesity in the horse.
The equine hindgut microbiome is dominated by fibrolytic bacteria according to both culture-based( Reference Garner, Coffman and Hahn 41 , Reference Mackie and Wilkins 42 ) and culture-independent studies( Reference Lin and Stahl 43 , Reference Hastie, Mitchell and Murray 44 ). Fibrolytic bacteria are represented in both the Firmicutes and Bacteroidetes phyla( Reference Gibson and Roberfroid 45 ). Fibrobacter succinogenes, Ruminococcus flavefaciens and R. albus are the most extensively studied fibrolytic bacteria in herbivores( Reference Lin and Stahl 43 , Reference Hastie, Mitchell and Murray 44, Reference Daly and Shirazi-Beechey 46 ) and, of these, F. succinogenes and R. flavefaciens represent 12 and 4 %, respectively, of total hindgut bacteria in the horse( Reference Lin and Stahl 43 , Reference Hastie, Mitchell and Murray 44 , Reference Julliand, de Vaux and Millet 47 ). Due to their role in breaking down the most abundant carbohydrate in the forage-based equine diet, these bacterial species may play a causative role in the condition of equine obesity or overweight. Despite the interest in equine obesity( Reference Frank, Elliott and Brandt 8 , Reference Vick, Adams and Murphy 9 , Reference Buff, Dodds and Morrison 48 , Reference Thatcher, Pleasant and Geor 49 ) and reliance on gut microbes for energy harvest, no studies to date have compared the abundance of Firmicutes, Bacteroidetes or fibrolytic bacteria in overweight v. moderate-condition mares.
A relationship between gut microbes or microbial products with obesity would be significant as hindgut microbes can provide more than 50 % of daily digestible energy (DE) requirements to a horse( Reference Glinsky, Smith and Spires 16 , Reference Pethick, Rose and Bryden 27, Reference Vermorel, Vernet and Martin-Rosset 50 ), as compared with only 10% of the energy requirements of humans( Reference Cummings 51 – Reference Xu and Gordon 55 ). Alterations in the gut microbiota or changes in function of the gut microbes, such as enhanced VFA production, may influence body weight or adiposity in the horse despite similar energy consumption. In the present study, we assessed the in vivo diet digestibility of grass hay in overweight and moderate-condition mares. In addition, faecal and plasma VFA concentrations were measured to evaluate primary metabolic outputs of hindgut microbial fibre fermentation. Finally, abundance of members of the Firmicutes and Bacteroidetes phyla and the abundance of the fibrolytic bacteria R. flavefaciens and F. succinogenes in the faeces were measured. We evaluated the ratio of active, fibrolytic( Reference Bera-Maillet, Ribot and Forano 56 ) R. flavefaciens and F. succinogenes (16S ribosomal RNA (rRNA)) v. the total number of fibrolytic bacterial copies (16S ribosomal DNA (rDNA)) abundance, providing a measurement of the proportion of actively replicating bacteria. We hypothesised that overweight mares would have higher apparent hay digestibility and higher faecal and plasma acetate concentrations than moderate-condition mares. We also hypothesised that overweight mares will have an increased abundance of faecal Firmicutes and a lower abundance of Bacteroidetes. Furthermore, we expected overweight mares to have a higher abundance of active R. flavefaciens and F. succinogenes compared with moderate-condition mares.
Materials and methods
Animals and housing
A total of five moderate-condition adult, non-pregnant mares (body condition score (BCS) 5–6 on a nine-point scale( Reference Henneke, Potter and Kreider 57 ); age 7–20 years; weight 523–611 kg) and five overweight adult, non-pregnant mares (BCS 7–9/9; age 7–20 years; weight 511–575 kg) from the Virginia-Maryland Regional College of Veterinary Medicine teaching herd were allocated to the study. The total herd of twenty-two horses had been managed for at least 3 years, grouped by BCS and managed on the same pastures (rotated around cool-season grass pastures) and fed the same cool-season grass hay during winter months. Forage was fed at a rate to meet National Research Council( 58 ) daily DE requirements for ideal body weight. The overweight mares maintained a BCS > 6/9 throughout the year and the moderate-condition mares maintained a BCS < 6/9 throughout the year. Average BCS at the start of the study for the overweight and moderate-condition groups were 7·3/9 and 5·3/9, respectively. The study was designed to detect a 0·03 difference ± 0·015 sd ( Reference Ragnarsson and Jansson 59 ) in digestibility based on α of 0·05 and 1 – β of 0·885.
Mares were housed in individual box stalls (3·6 m × 3·6 m) with adjacent individual dry paddocks (3·6 m × 4·8 m) during the 15 d study. The study was divided into two periods: a 10 d acclimatisation period followed by a 4 d digestibility trial and a final day for morphometric measurements. For the first 10 d of the study, stalls were bedded with pine shavings and mares had access to paddocks 24 h per d. Stalls were cleaned twice daily (11.00 and 20.00 hours). For the last 5 d of the study, stalls were bare except for rubber mats; mares had access to outside paddocks 10–15 min once daily during the 11.00-hour thorough stall cleaning; faeces were accounted for as described below.
All horses received routine veterinary care including vaccines, deworming and dental floating before the study. The study was conducted during June 2011 in Blacksburg, VA (mean ambient temperature 22·1°C). The animals were maintained and all procedures were performed in accordance with the Virginia Tech Institutional Animal Care and Use Committee (IACUC) guidelines (IACUC no. 10-152-CVM).
Diet
Before the study, all mares were housed on and allowed ad libitum access to the same cool-season grass (predominantly tall fescue; Festuca arundinacea) pastures all year round. Mares were fed cool-season grass hay (predominantly orchard grass (OG; Dactylis glomerata) hay) in the winter months when pasture forage was unavailable. Mares were housed in individual stalls during the study (days 0–15) and limit-fed a commercially available OG hay (Standlee Hay Company) (Table 1). Hay was fed in hay nets at 20 g/kg body weight as fed per d divided into two equal feedings at 08.00 and 20.00 hours. The mares were acclimatised to the hay during a 10 d acclimatisation period, as previously described( Reference Eckert, Myer and Warren 60 ). Mares were offered a vitamin–mineral supplement (EquiMin® Granular; Southern States) free choice, as previously fed on pasture; the supplement was withdrawn on days 11–15. Orts were weighed, recorded and subtracted from the daily amount of hay offered. Total daily DM intake (DMI) was determined for each mare by multiplying total hay intake by average hay DM.
Table 1. Nutrient analysis* of the orchard grass (Dactylis glomerata) hay fed to mares during the study
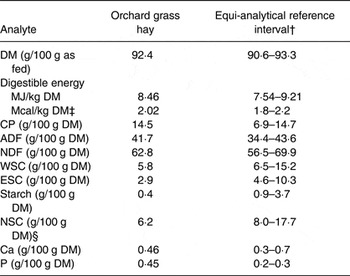
CP, crude protein; ADF, acid-detergent fibre; NDF, neutral-detergent fibre; WSC, water-soluble carbohydrates (monosaccharides, dissacharides, fructan oligo/polysaccharides); ESC, ethanol-soluble carbohydrates (monosaccharides, disaccharides); NSC, non-structural carbohydrates.
* Forage analysis performed was as previously described( Reference Shepherd, Pleasant and Crisman 33 ); values include a single measurement on a composite sample.
† Equi-Analytical Laboratories; grass hay analyte reference range is mean ± 1 sd for 10000–40000 samples based on analyte.
‡ Digestible energy (kcal/kg DM) calculated as 2118 + 12·18 (CP %) – 9·37 (ADF %) – 3·83 (hemicellulose %) + 47·18 (fat %) + 20·35 (NSC) – 26·3 (ash %)( Reference Pagan 93 ).
§ NSC (calculated) = WSC + starch.
Sample collection
On day 0 and day 15, mares were body condition scored, weighed on a digital scale (Cambridge Scale Works) and assessed for subcutaneous fat (rump fat) thickness before the 08.00 hours feeding. BCS( Reference Henneke, Potter and Kreider 57 ) was subjectively scored on day 0 and day 15 by a single individual (M. L. S.). Rump fat thickness was measured with a 12 mHz tendon probe with the probe placed in the sagittal plane 5 cm off of midline at the centre of the pelvis( Reference Westervelt, Stouffer and Hintz 61 ); measurements were taken in triplicate and averaged. All measurements were taken before the morning meal; day 0 measurements were taken immediately after transport to the research barn.
A 20 g hand grab sample of the commercially available OG hay was obtained twice daily at each feeding on days 11–14 and stored in individual brown paper bags until analysis. Total daily faeces were collected continuously throughout the day on days 11–14 into plastic bags, kept closed between collection, to prevent moisture loss of faeces; total collections were weighed four times daily (14.00, 20.00, 02.00 and 08.00 hours) before disposal. Additional three times daily (08.00–09.00, 14.00–15.00, and 20.00–21.00 hours) 200 g fresh faecal samples, for digestibility and gross energy analysis, were collected into tin mini loaf pans (Schneider Paper Products, Inc.) and placed in a plastic bag until processing within 2 h of collection. In addition, three 50 g faecal samples were collected once daily (08.00 hours) for VFA and microbial abundance analysis. Two samples were stored in empty 50 ml tubes (VWR International); one sample was stored in a 50 ml tube (VWR International) containing 25 ml RNAlater® (Life Technologies) as per the manufacturer's protocol. The 50 g faecal sample and 25 ml RNAlater® were manually homogenised immediately after collection. The 50 g faecal samples were placed immediately on ice, and stored at –80°C within 1 h of collection until further analysis. All 08.00 hours samples were collected from the rectum; the 14.00 and 20.00 hours samples were collected from the floor immediately after defecation (seconds after defecation was observed).
The 20 g OG hay samples and 200 g faecal samples were weighed and dried in a 55°C forced-air oven (Precision Freas Mechanical Convection Ovens Model 645; Pacific Combustion) for 96 h to achieve <10 g/100 g moisture. Dried OG hay and faecal samples were ground using a 1-mm screen (model 4 Wiley Mill; Thomas Scientific), composited within horse, and subsampled within horse. All digestibility analyses were evaluated in duplicate. Faecal output was calculated as the summed weight of the four daily total faecal collections and 200 g three times daily faecal samples for each horse.
Before faecal collection and feeding at 08.00 hours, blood samples were drawn into 10 ml tubes (BD Vacutainer®) containing lithium heparin for VFA analysis. Plasma was harvested within 30 min of collection after centrifugation (3000 g ) and stored at –80°C until analysis. Plasma samples were pooled within horse over the four sampling days and analysed for acetate in duplicate.
Apparent digestibility
In vivo apparent diet DE digestibility and DM digestibility are used to represent total-tract digestibility while neutral-detergent fibre (NDF) apparent digestibility and acid-detergent fibre (ADF) apparent digestibility represent microbial fermentation in the hindgut. Gross energy of ground OG hay and faeces was measured with a bomb calorimeter (Parr 1271A Auto Calorimeter) using a sample size of 0·15–0·20 g (analysis was corrected for sample weight) and jacket temperature at 30°C; 1 g benzoic acid was used as the standard and 0·45–0·50 g mineral oil was used as the spike. Commercially available OG hay DE for each horse was calculated using the following:
DE (kJ/kg DM (kcal/kg DM)) = (gross energy of OG hay (kJ/kg DM (kcal/kg DM)) × total daily hay consumption (kg DM)) – (gross energy faeces (kJ/kg DM (kcal/kg DM)) × total daily faecal production (kg DM)).
Data are reported as kJ/kg DM (kcal/kg DM). DM, ash, ADF and NDF, inclusive of ash, were determined using AOAC procedures( 62 ). Apparent digestibility of DM was calculated with the following: DM digestibility = (DMI – faecal output)/DMI( Reference Staniar, Bussard and Repard 63 ); calculations were repeated for organic matter, NDF and ADF fractions.
Volatile fatty acids
Frozen 50 g faecal samples were thawed at 4°C for 4 h and prepared as described by Otto et al. ( Reference Otto, Yokoyama and Hengemuehle 64 ). Briefly, 2 g of thawed faeces were mixed with 8 ml deionised water and 0·5 ml concentrated HCl (Fisher-Scientific), vortexed for 10 s, and then centrifuged at 25314 g for 20 min. The supernatant fraction was filtered through a 0·22 µm filter (Millipore Co.) and stored in 3·7 ml (1 fluid dram; DR) glass vials (no. 0333922B; Fisher Scientific). Samples were pooled to combine by day within horse and stored at –80°C until VFA analysis. Thawed pooled plasma and faecal supernatant fraction samples were spiked with 100 µl internal standard/volume marker (2·5 mm-[1,2-13C2]sodium acetate, 1 mm-[1,2,3-13C3]propionic acid, 1 mm-[1,2,3,4-13C4]sodium butyrate) then derivatised using a water, acetonitrile and 2-chloroethanol solution adapted from Kristensen( Reference Kristensen 65 ). Faecal preparations were analysed for acetate, propionate and butyrate, and plasma was analysed for acetate by GC and MS( Reference Kristensen 65 ).
Faecal bacterial abundance
Frozen 50 g faecal samples were thawed at 4°C for 4 h before DNA extraction. A commercial kit (ZR Soil Microbe DNA MicroPrep™; Zymo Research) was used to extract DNA from 0·25 g homogenised and pelleted faeces as described by Shepherd et al. ( Reference Shepherd, Swecker and Jensen 30 ).
Two storage methods (RNAlater®-preserved faeces and liquid N2-preserved faeces) and extraction kits (RNeasy® Mini Kit, Qiagen, Ca and Zymo Soil/Faecal RNA Mini Prep, Zymo Research, Irving, CA) with and without a DNase step were evaluated with the goal of optimising RNA yield and quality from faeces. RNA quality was determined using a Bioanalyser 2100 (Agilent Technologies, Inc.). The highest 23S:16S ratio of 1·5 and RNA integrity number (RIN) of 8·4, indicators of RNA quality, were obtained from RNA extracted using the RNeasy® Kit (Qiagen) with bead beating and DNase treatment. Furthermore, this method produced the cleanest 23S and 16S peaks and minimal noise (no additional peaks) on electropherograms. Therefore, RNA was extracted from 0·25 g of each faecal sample stored in RNAlater® at –80°C after having thawed on ice for 2 h and strained to remove RNAlater®. The RNeasy® Mini Kit Fungal/Plant protocol with on-column DNase was followed according to the manufacturer's instructions (Qiagen).
Extracted DNA and RNA concentrations were assessed by spectrophotometry (NanoDrop ND-1000 Spectrophotometer; Coleman Technologies). DNA and RNA was re-extracted from a faecal sample only when concentrations were <10 ng/µl. DNA was standardised to a concentration of 60–70 ng/µl; RNA was standardised to a concentration of 65–75 ng/µl.
Quantitative real-time PCR was used to quantify the abundance of total bacteria and members of the Firmicutes or Bacteroidetes phylum using previously designed primers (Table 2). Each 25 µl reaction contained 12·5 µl HotStart-IT® SYBR® Green qPCR Master Mix 2X (no. 75770; USB Corp.) with 5 mm-MgCl2, 0·4 mm-nucleotides and 10 nm-fluorescein in addition to 1·3 µl each of 16S rDNA forward and reverse primers (10 µm; Table 2), 2·5 µl 10 % dimethyl sulfoxide (Fisher-Scientific), additional 1 µl 25 mg/ml MgCl2, 0·5 µl ROXTM passive reference dye (no. 75768; USB Corp.) and 4·9 µl nanopure nuclease-free water (no. E476; Amresco Inc.). The PCR protocol consisted of denaturation at 95°C for 3 min followed by forty cycles of 95°C for 15 s, annealing for 30 s (see annealing temperature in Table 2), and elongation at 72°C for 30 s. The melt curve consisted of 95°C for 1 min, 55°C for 1 min, seventy-one cycles of 60·5°C for 30 s increasing the temperature with each repeat. The melt curve was evaluated for a single fluorescent peak per PCR reaction; multiple fluorescent peaks indicate non-specific primer amplification (i.e. primer dimer formation).
Table 2. Primers used for determining bacterial abundance
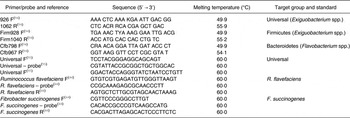
F, forward; R, reverse.
Abundance of R. flavefaciens and F. succinogenes was determined using TaqMan® primers and probes (Table 2) as previously designed by Hastie et al. ( Reference Hastie, Mitchell and Murray 44 ). Each 20 µl reaction contained 65 ng DNA, 10 µl HotStart-IT Probe qPCR Master Mix 2x (no. 75770; USB Corp.), 1 µl of 20X TaqMan® assay (AB TaqMan® Assay; Table 2), 0·4 µl of ROXTM as passive reference dye (no. 75768; USB Corp.) and 7·6 µl nanopure nuclease-free water (no. E476; Ameresco Inc.). PCR conditions consisted of one cycle of 2 min at 95°C for activation of HotStart-IT polymerase, followed by thirty-five cycles of denaturation at 95°C for 15 s, primer annealing and real-time detection at 60°C for 30 s, and extension at 72°C for 1 min carried out with a 7300 real-time PCR detection system (Applied Biosystems). Standard curves were constructed using 6-fold dilutions of target DNA from pure cultures of R. flavefaciens S85 and F. succinogenes FD-1 provided by Dr Roderick Mackie (University of Illinois, Urbana). Absolute abundance was calculated as log10 copies/g faeces. The abundance of active F. succinogenes and R. flavefaciens was determined as described above except that 70 ng RNA were used as the starting material and converted to complementary DNA by the addition of 0·2 µl Moloney murine leukemia virus (M-MLV) RT (no. 75783; USB Corp.) and 0·2 µl RNase inhibitor (no. 75782; USB Corp.). PCR conditions as described above were preceded by one cycle of 5 min at 50°C for reverse transcription of RNA before amplification. Negative controls, without complementary DNA and reverse transcriptase, were run to rule out DNA contamination. Each reaction was prepared and carried out in biological and technical duplicates as described( Reference Price, Totty and Lee 66 ) using an ABI 7300 (Applied Biosystems).
Statistical analysis
Duplicate digestibility, plasma and faecal VFA, and bacterial abundance analyses were conducted on samples pooled within horse for the collection period. Data were analysed using SAS (version 9.2; SAS Institute Inc.). A GLIMMIX procedure was used for analysis, with mare within group as the subject, using the following model for analysis:
 $$\hbox{Y}_{\rm ij}=\mu + \hbox{G}_{\rm i} + \hbox{E}_{{\rm \lpar i\rpar j}}\comma \;$$
where Yij = dependent variables DMD, NDFD, ADFD, plasma acetate, faecal acetate, propionate and butyrate, and abundance of total bacteria, Firmicutes, Bacteroidetes, F. succinogenes and R. flavefaciens; µ = the mean of Y; Gi = fixed effect of group (overweight and moderate condition); and E(i)j = random effect of mare within group. For each model, residual plots were inspected to verify the assumption that errors followed a normal distribution with a constant variance. Differences between groups were considered significant with P < 0·05. Data are presented as mean values with their standard errors.
Results
Animals and apparent digestibility
Body weight, BCS, rump fat thickness and DMI for the two groups are presented in Table 3. Body weight (P = 0·35) did not differ between groups; however, BCS was higher (P < 0·01) and mean rump fat was larger (P = 0·03) in overweight mares. DMI did not differ between groups (P = 0·61). DM, NDF and ADF apparent digestibilities did not differ between groups (Table 4).
Table 3. Mare body weight (BW), body condition score (BCS) and rump fat thickness measured on days 0 and 15 and DM intake (DMI) during days 11–14
(Mean values with their standard errors)
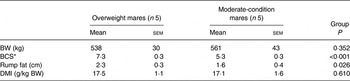
* BCS measured on a scale of 1 to 9.
Table 4. Hay digestibility in overweight and moderate-condition mares during days 11–14 of the study
(Mean values with their standard errors)
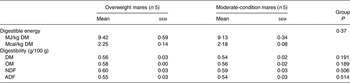
OM, organic matter; NDF, neutral-detergent fibre; ADF, acid-detergent fibre.
Volatile fatty acids
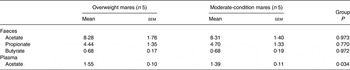
Faecal acetate, propionate and butyrate concentrations did not differ significantly between overweight and moderate-condition mares (Table 5). However, mean plasma acetate concentration was higher (P = 0·034) in the overweight mares (1·55 (sem 0·10) mmol/l) than the moderate-condition mares (1·39 (sem 0·11) mmol/l).
Table 5. Volatile fatty acid concentrations in the faeces (mg/g dry faeces) and plasma (mmol/l) of overweight and moderate-condition mares on days 11–14 of the study
(Mean values with their standard errors)
Faecal bacterial abundance
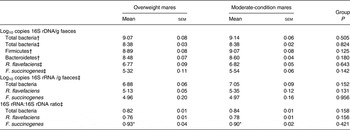
The abundance of total bacterial 16S rRNA copies, as determined using TaqMan® primers/probes, was higher (P < 0·001) than with SYBR® Green primers (Table 6). There was no statistically significant difference in the abundance of total bacteria, Firmicutes and Bacteroidetes 16S rDNA, as determined using SYBR® Green primers, from the faeces of overweight v. moderate-condition mares (Table 6). A difference in the average Firmicutes:Bacteroidetes ratio in the overweight (2·76 (sem 0·46)) and moderate-condition (3·09 (sem 0·35)) mares was not detected (P = 0·588). Differences in total bacteria, R. flavefaciens or F. succinogenes 16S rDNA and 16S rRNA abundance, as determined using TaqMan® primers/probes, were not detected between overweight v. moderate-condition mares (Table 6). The 16S rRNA:16S rDNA ratio was higher (P < 0·001) for F. succinogenes than for all bacteria and R. flavafaciens in both groups (Table 6).
Table 6. Abundance (log10 copies 16S ribosomal DNA (rDNA) and 16S ribosomal RNA (rRNA)/g faeces) and 16S rDNA:16S rRNA ratios for total bacteria, Firmicutes, Bacteroidetes, Ruminococcus flavefaciens and Fibrobacter succinogenes
(Mean values with their standard errors)
Discussion
Animals and apparent digestibility
The mares in the present study were chosen because they had been under the same management and feeding practices for the past 3 or more years before the study yet displayed variable body-condition phenotypes. No differences in DM or fibre digestibilities were detected between overweight and moderate-condition mares in the present study despite all fractions being numerically higher in the overweight mares. A difference in the mean hay DE between overweight and moderate-condition mares of 251 kJ/kg hay DM (0·06 Mcal/kg hay DM) translates to an additional 1025 MJ DE (245 Mcal DE)/year in a 500 kg overweight mare fed 20 g/kg BW per d hay, DM basis or 10 kg DM per d. The additional energy could conceivably be stored as fat. Generally speaking, a 32·2 MJ (7·70 Mcal) energy surplus/deficit is needed to gain/lose 1 kg body weight( Reference Hall 67 ). This estimate does not take into account differences between fat and lean tissue gained/lost during weight gain/loss; however, the 1026 MJ DE (245 Mcal DE)/year could hypothetically lead to an increase of 32 kg body weight in 1 year's time.
Ragnarsson & Jansson( Reference Ragnarsson and Jansson 59 ) reported a 0·03 difference in haylage digestibility between six Standardbred and six Icelandic horses (0·57 v. 0·54). Increased individual variation in digestibility was anticipated in the present study, as compared with the Ragnarsson study, due to breed variation. Furthermore, the facilities in the present study allowed for a maximum of ten horses to be evaluated during the same period to avoid the effect of time/period. We used a 10 d adaptation period and 4 d collection period as this is a standard approach in equine digestibility trials( Reference Eckert, Myer and Warren 60 ). We do not anticipate that provision of a longer adaptation period would have allowed us to detect a difference in digestibility. However, based on the variation in the present study, we would need a larger cohort of obese (n 14) and lean (n 14) adult mares to detect a 0·02 difference in grass hay DM digestibility.
The overweight mares may, if allowed ad libitum access, consume more total daily DM than the moderate-condition mares, thereby influencing total daily energy intake. We did not evaluate voluntary OG hay consumption in the overweight v. moderate-condition mares and thus are unable to comment on the effect of voluntary intake on the overweight condition. Conversely, we cannot comment on the potential effect of voluntary overconsumption on digestibility.
Volatile fatty acids
Faecal VFA concentrations in the present study (Table 5) were higher than concentrations in the faeces of geldings limit-fed lucerne cubes (2·84 mg acetate, 0·89 mg propionate and 0·55 mg butyrate/g faecal DM) as reported by Hussein et al. ( Reference Hussein, Vogedes and Fernandez 17 ). This difference could be due to an effect of diet (lucerne v. hay) or individual variation in VFA production by hindgut microbes or VFA absorption. Argenzio et al. ( Reference Argenzio, Southworth and Stevens 15 ) reported that total VFA concentrations varied from 20 to 60 mmol/l in the hindgut among ponies fed the same pelleted feed. Other VFA, such as valerate, isovalerate and isobutyrate, were not evaluated in the present study as they collectively represent less than 10 % of total VFA in horse faeces( Reference Hussein, Vogedes and Fernandez 17 ). Therefore, a comparison of the VFA ratios in the present study and prior studies cannot be made.
Plasma acetate concentrations in the present study were higher (>1·0 mmol/l; Table 5) than previously reported in horses (0·56 (sem 0·07) mmol/l)( Reference Waller, Geor and Spriet 68 ) and human subjects (<0·1 mmol/l)( Reference Freeland and Wolever 69 ). The adult Standardbreds in the Waller et al. study( Reference Waller, Geor and Spriet 68 ) were managed on a sweet feed and forage diet v. forage-only diet in the present study. The exact cause and significance of higher plasma acetate in the overweight v. moderate-condition mares were beyond the scope of the study. Possible causes for increased plasma acetate in overweight mares could be due to increased microbial VFA production, reduced microbial acetate utilisation/metabolism( Reference Duncan, Barcenilla and Stewart 70 , Reference Duncan, Holtrop and Lobley 71 ), increased VFA absorption across the gut mucosa, reduced acetate oxidation, increased hepatic acetate production( Reference Siler, Neese and Hellerstein 72 , Reference Yamashita, Kaneyuki and Tagawa 73 ) or reduced hepatic TAG synthesis. VFA absorption is negatively correlated with gut lumen pH and positively associated with the concentration of a given VFA in the lumen( Reference Bergman 12 ). Diet influences hindgut and faecal lumen pH, with non-structural carbohydrates (mono/disaccharides, starches, fructans), as found in grains, favouring a more acidic pH( Reference Swyers, Burk and Hartsock 18 , Reference Garner, Coffman and Hahn 41, Reference Garner, Hutcheson and Coffman 74 , Reference van Eps and Pollitt 75 ). Reductions in hindgut pH may lead to enhanced VFA absorption secondarily due to mucosal barrier compromise, which could lead to the horse's demise( Reference Mungall, Kyaw-Tanner and Pollitt 76 , Reference Bailey, Baillon and Rycroft 77 ). Mares in the present study were fed a grass-hay diet low in non-structural carbohydrates( Reference Shepherd, Pleasant and Crisman 33 ) with no inclusion of grains. Cani & Delzenne( Reference Cani and Delzenne 78 ) described a cascading process of obesity, altered gut microbes, altered gut barrier function, metabolic endotoxaemia and subsequent inflammation in human models. We did not evaluate the entire microbial population in the present study; however, we did not find evidence of altered gut microbes between overweight and moderate-condition mares.
The potential effects of increased plasma acetate in overweight horses are numerous. Of the VFA, peripheral tissues directly utilise acetate as an energy source( Reference Pethick, Rose and Bryden 27 ). Once in the blood, acetate may be aerobically oxidised and directly used for energy( Reference Pethick, Rose and Bryden 27 ) or stored as TAG in adipose and skeletal tissue( Reference Suagee, Corl and Crisman 28 ). Once absorbed, acetate can be oxidised via the tricarboxylic acid (TCA) cycle or stored in the form of adipose, as acetate is the primary substrate for de novo fat synthesis in the horse( Reference Suagee, Corl and Crisman 28 ). Furthermore, acetate may directly increase hepatic lipogenesis, lipoprotein lipase and subsequent fat storage as found in the murine model( Reference Cani and Delzenne 78 ). In humans, acetate is used as a substrate for de novo fatty acid synthesis in adipose tissue( Reference Patel, Owen and Goldman 79 ) and VFA are recognised as a link between obesity and gut microbes in human subjects( Reference Tremaroli and Backhed 80 ). Therefore, the cause and significance of higher plasma acetate in overweight v. moderate-condition mares should be further explored. VFA may secondarily influence energy intake by influencing food intake. In ruminants, rumen infusions of acetate decrease intake( Reference Farningham and Whyte 81 , Reference Sheperd and Combs 82 ). Similarly, rectal acetate infusion increased plasma peptide YY, which generally inhibits food intake, in human subjects( Reference Freeland and Wolever 69 ). To our knowledge the effects of parenteral or rectal acetate infusions have not been evaluated in horses; we feel that this would be worth investigating. Furthermore, as previously discussed, we did not evaluate voluntary intake in the present study and thus cannot evaluate a potential relationship between plasma acetate and intake.
Faecal VFA concentrations do not accurately reflect those in the caecum and colon( Reference Argenzio, Southworth and Stevens 15 ). Therefore, without a direct measurement of caecal/colon VFA concentrations, we cannot speculate whether a difference in caecal/colon VFA concentrations would be detected in this cohort. Similarly, plasma VFA concentrations in the jugular vein will not accurately represent microbial VFA production or even portal vein VFA concentrations, particularly for propionate and butyrate. Most absorbed propionate is converted into glucose by the liver and provides 50–61 % of blood glucose in horses( Reference Simmons and Ford 83 ), and butyrate is the preferred energy substrate for colonocytes and thus plays an important role in the maintenance of hindgut health. Therefore, of the venous VFA, we focused on plasma acetate. Measurement of portal venous VFA concentration in conjunction with caecal and colon VFA concentrations would be a more accurate method to elucidate VFA absorption rates in vivo and thus determine if a difference in VFA absorption exists between overweight and moderate-condition horses. Portal vein catheterisation in horses has been described( Reference Baker, Sutton and Lieb 84 ) and can be placed in conjunction with caecal cannulas; however, both are invasive procedures.
Faecal bacterial abundance
The relative abundance of Firmicutes in the hindgut is positively associated with obesity in human subjects( Reference Ley, Turnbaugh and Klein 21 , Reference Turnbaugh, Hamady and Yatsunenko 36 ), pigs( Reference Guo, Xia and Tang 34 ) and rodents( Reference Ley, Bäckhed and Turnbaugh 20 , Reference Turnbaugh, Baeckhed and Fulton 35 ). However, a difference in abundance of Firmicutes was not detected between overweight and moderate-condition adult mares in the present study (Table 6). Furthermore, the faecal Firmicutes:Bacteroidetes ratio in the faeces of overweight v. moderate-condition mares did not differ. We hypothesise that R. favafaciens and F. succinogenes 16S rRNA abundance would be higher in the overweight v. moderate-condition mares as an indication of higher fibrolytic bacterial activity. However, we did not detect a difference in the abundance of R. favafaciens and F. succinogenes in overweight v. moderate-condition mares.
The higher 16S rRNA:16S rDNA ratio for F. succinogenes may represent a higher activity of F. succinogenes in the rectum of adult mares fed grass hay as compared with R. flavafaciens. F. succinogenes plays an important fibrolytic role in herbivores fed a grass-based diet( Reference Shinkai, Ohji and Matsumoto 85 ). F. succinogenes has superior fibrolytic activity as compared with Ruminococcus spp.( Reference Kobayashi, Shinkai and Koike 86 , Reference Suen, Weimer and Stevenson 87 ), which may explain the increased 16S rRNA:16S rDNA ratio, a representation of activity. Furthermore, time of day, with respect to feeding, influences the abundance of F. succinogenes in the rumen of dairy cattle( Reference Mullins, Mamedova and Carpenter 88 ). However, the effect of time or feeding was not evaluated in the present study, as faecal samples for microbial analysis were collected once daily, before the morning feeding.
The higher abundance of total bacteria as determined using SYBR® Green primers v. TaqMan® primers/probes (Table 6) is probably due to the higher specificity when using TaqMan® primer/probe combinations( Reference Cao and Shockey 89 ). TaqMan® probes bind only between the two PCR primers; therefore, the complimentary sequence must be present for the primers to bind and subsequently the probe to bind and result in a fluorescent signal and thus TaqMan® probes are indicated when evaluating bacterial members in low abundance within a population( Reference Malinen, Kassinen and Rinttila 90 ). In contrast, SYBR® Green binds and fluoresces with any double-stranded DNA; SYBR® Green primers are less expensive than TaqMan® probes, can be used with a wider range of primers, and are commonly used when evaluating bacterial members in high abundance within a population( Reference Malinen, Kassinen and Rinttila 90 ).
This is the first study, to the authors' knowledge, of evaluating 16S rDNA abundance alongside 16S rRNA abundance to characterise the equine faecal bacterial population with an emphasis on fibrolytic bacteria. Evaluation of 16S rDNA abundance has been used to evaluate the abundance of bacteria in equine gut/faecal samples( Reference Hastie, Mitchell and Murray 44 ), but does not distinguish between viable and non-viable bacteria. The 16S rRNA abundance and can be used as an indicator of bacterial activity( Reference Lee, Macbeth and Sorenson 91 ) and is typically higher than 16S rDNA abundance in pure culture( Reference Lee, Macbeth and Sorenson 91 , Reference Perez-Osorio, Williamson and Franklin 92 ). As reported in the present study, we expected the 16S rRNA abundance to be lower than the 16S rDNA abundance in faeces because RNA is a less stable molecule than DNA. Furthermore, both viable and non-viable bacteria are present in faeces of adult mares and the latter would not be transcribing the rDNA into rRNA. We used faecal samples as a non-invasive means to evaluate two different groups of horses; however, we cannot directly infer that the findings presented here represent the caecal and colonic microbiome.
In conclusion, overweight mares have higher plasma acetate concentrations than lean mares fed the same commercially available OG hay diet. The cause and significance of this finding should be further explored as a mechanism linking obesity and gut microbes.
Acknowledgements
Funding was provided by a Virginia-Maryland College of Veterinary Medicine Intramural Grant. The commercially available OG hay was donated by Standlee Hay Company. The authors would like to thank Dr Roderick Mackie, University of Illinois, for supplying the F. succinogenes and R. flavafaciens strains that served as standards for real-time PCR analysis, Dr Amy Tanner and Barbara Self for their assistance in the digestibility analyses, Dr Mark Hanigan, Tara Wiles and Deepthi Nayananjalie for their assistance in VFA analysis, and Dr Mike McGilliard for statistical guidance. We would like to give special thanks to the twenty-six undergraduate student volunteers that assisted with horse care, sample collection, sample processing and analysis.
M. L. S. authored the paper, established the study design, carried our animal care, sample collection and analysis. M. A. P. and A. O. B. were co-authors on this paper, co-advised the lead author in study design, and provided editorial comments. S. C. M. helped with horse acquisition and care along with sample collection and analysis. W. S. S. was a co-author on this paper, principal investigator for the grant supporting the research, contributed editorial comments, and advised the lead author from study design to manuscript. The authors declare no conflict of interest.


 Open access