


Vitamin D3 (D3) is synthesised in skin exposed to UVB radiation in sunlight. However, in Northern Europe, including Finland, exposure to sunlight is limited or non-existent in winter( Reference Lamberg-Allardt, Brustad and Meyer 1 ). Between November and March, dietary or supplementary vitamin D intake is essential to maintain adequate serum 25-hydroxyvitamin D (S-25(OH)D) concentrations. There are only a few natural dietary sources of vitamin D. Fish and egg yolks contain significant amounts of D3 (cholecalciferol), and some wild mushrooms are a source of vitamin D2 (D2, ergocalciferol). Thus, vitamin D fortification of certain foods has been suggested as one strategy to improve vitamin D status of Northern European populations( Reference Black, Seamans and Cashman 2 ), but also that such strategies use a range of foods to accommodate dietary diversity( Reference Cashman and Kiely 3 ).
Although D3 is the most commonly used vitamer in fortified products in Europe currently( Reference Black, Seamans and Cashman 2 ), use of D2 as a fortificant may also have some advantages. For example, it may be important for vegetarians, vegans and those with cultural considerations who would not benefit from animal-derived sources of vitamin D, whether as foods or supplements. The production of plant-derived D2 could be more cost-effective than production of D3. Finally, although the potential for biofortification of animal-derived foods has been proposed as food-based solutions for vitamin D deficiency( Reference Cashman and Kiely 3 , Reference Cashman 4 ), there is also potential for D2-biofortified foods such as those arising from UVB irradiation of mushrooms and baker’s yeast, which have been shown to stimulate their endogenous D2 content. As yet, these are not very common in the European Union. While potentially of major importance in addressing vitamin D deficiency, a key consideration is whether these food-based sources of D2 are effective and whether they might have a negative impact on serum 25-hydroxyvitamin D3 (S-25(OH)D3) concentrations. Recently, Logan et al.( Reference Logan, Gray and Peddie 5 ) showed that supplementation of New Zealand adults with D2 (25 μg/d) for 25 weeks in winter increased serum 25-hydroxyvitamin D2 (S-25(OH)D2) but produced a 9 nmol/l greater decline in S-25(OH)D3 compared with placebo. This contributed to the finding that end point total S-25(OH)D concentrations were 21 nmol/l lower in participants receiving D2 compared with those receiving D3 (25 μg/d) among whom total S-25(OH)D concentrations remained unchanged during winter. Data on the impact of food-derived D2 on S-25(OH)D3 are limited( Reference Black, Seamans and Cashman 2 ). A systematic review reported that supplemental D3 is more effective in raising total S-25(OH)D concentrations than supplemental D2 ( Reference Tripkovic, Lambert and Hart 6 ). The half-life of D2 has been found to be shorter after a bolus dose in vitamin D-deficient subjects( Reference Romagnoli, Mascia and Cipriani 7 ). A reduction in S-25(OH)D3 despite significant increases in S-25(OH)D2 may have physiological consequences. For instance, D3 seems to be more efficient than D2 in decreasing serum parathyroid hormone (S-PTH) levels in vitamin D-deficient subjects( Reference Romagnoli, Mascia and Cipriani 7 ).
Thus, we aimed to investigate the bioavailability of D2 from UV-irradiated baking yeast present in bread in terms of efficacy of raising S-25(OH)D2 and total S-25(OH)D (i.e. S-25(OH)D2+S-25(OH)D3) as well as its possible effects on S-25(OH)D3 and S-PTH concentrations compared with D2 or D3 supplementation in a randomised placebo-controlled trial in young, healthy females during winter in Finland. The UV-irradiated baking yeast is known to be safe and suitable for baking and has been approved by the Food and Drug Administration (FDA) in the USA and by the European Food Safety Authority (EFSA) in Europe( 8 , 9 ).
Methods
Subjects
The study was conducted as part of the European Union-funded research project ODIN (Food-based solutions for optimal vitamin D nutrition and health through the lifecycle, FP7-613977-ODIN; www.odin-vitd.eu). Specifically, it was a part of Work Package 5 within the ODIN project where the overall aim was to investigate the potential advantages and limitations of use of novel food-based solutions for the prevention of vitamin D deficiency. D2-biofortified yeast was one of these novel food-based solutions. The intervention study ‘BreaD’ was carried out at the Viikki Campus of the University of Helsinki (60°N) in Finland over 8 weeks from February to April 2014, when the availability of UVB radiation of sunlight is insufficient for endogenous vitamin D production, and S-25(OH)D concentrations are expected to be the lowest( Reference Lamberg-Allardt, Brustad and Meyer 1 ). Study volunteers were mainly recruited from the University Campus areas via advertisements for personnel, student mailing lists and the Internet. This study was conducted according to the guidelines laid down in the Declaration of Helsinki, and all procedures involving human subjects were approved by the Helsinki Uusimaa Hospital District Ethics Committees. Written informed consent was obtained from all subjects. The study was registered on ClinicalTrials.gov (www.ClinicalTrials.gov; NCT025003).
Inclusion criteria were good general health (no continuous medication), Caucasian origin, BMI<30 kg/m2 and aged between 20 and 40 years. Exclusion criteria were S-25(OH)D>100 nmol/l, diagnosed coeliac disease or cereal allergy, a vacation in a sunny place during the study period or within the preceding 2 months, regular use of vitamin D supplements >15 µg/d and pregnancy or breast-feeding during the study.
Study protocol
The subjects were blindly randomised into four study groups (Fig. 1), with ten to eleven subjects in each group and similar mean total S-25(OH)D concentrations between the groups. During the 8-week trial, three groups were given regular wheat bread and either+a daily placebo pill (group 1), +a daily D2 supplement (group 2) or+a daily D3 supplement (group 3), and a further group was given D2-containing wheat bread+a daily placebo pill (group 4). The average daily portion of bread was 87 g (three slices of bread/d), similar to the daily bread consumption of Finnish females in the nationally representative FINDIET 2012 Study( Reference Helldán, Raulio and Kosola 10 ). The daily dose of vitamin D, 25 µg, corresponds to 2·5 times the national Finnish recommendation for vitamin D intake (10 µg) for that age group( 11 ). Overnight fasting serum samples were collected between 07.30 and 10.00 hours at baseline (week 0), midpoint (week 4) and end point (week 8) of the study.
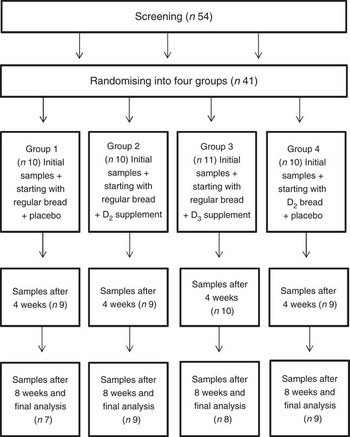
Fig. 1 Flow chart of the study. D2, vitamin D2; D3, vitamin D3.
The supplements/placebos (see below) were delivered to the subjects at the beginning of the study. The frozen breads (see below) were transported weekly from the bakery to the research unit and stored at −20°C. The breads were delivered to the subjects once or twice a week. If the subjects took the weekly allotment in a single delivery, they were advised to store the breads in the freezer at home. The subjects were asked to maintain their habitual diets and exercise habits during the study period. In addition to study breads, the subjects were allowed to eat other breads if they wished to consume more than the requested three slices. The subjects kept a daily record for 8 weeks on all study breads and supplements consumed, and compliance was calculated based on these records and cumulative pill counts at the end of the study.
Habitual vitamin D and Ca intakes of subjects were assessed by a validated semi-quantitative FFQ( Reference Itkonen, Erkkola and Skaffari 12 ). The FFQ was administered by trained interviewers at the baseline and the end point of the study. The use of vitamin and mineral supplements (other than the study supplements) was ascertained by a separate questionnaire at the beginning of the study. The vitamin D content of the foodstuffs was obtained from the Finnish food composition database Fineli®, which is developed and continuously updated by the Finnish National Institution of Health and Welfare (www.fineli.fi).
Breads and supplements
The study breads were provided by a local bakery ‘Marian Konditoria’ (Vantaa, Finland). The breads were baked in one batch and stored at −20°C until delivery to the participants. The D2-biofortified bread (which will be referred to as D2-bread hereafter) was baked with ‘UV-treated baker’s yeast’ (Lallemand SAS), a regular baker’s yeast (Saccharomyces cerevisiae), in which D2 had been produced from ergosterol by UVB light exposure. The product is approved by the FDA in the USA and by the EFSA in Europe( 8 , 9 ). The D2 content of the D2-bread (n 4) was 30·2 µg/100 g, thereby providing the participants 26·3 µg D2 in their daily portion of 87 g bread (analysed by HPLC). The regular bread was baked with regular baker’s yeast, and showed no content of vitamin D (<0·3 µg D2/100 g, n 4). The supplements contained 24·4 µg D2 per each D2 capsule (n 3) (Helhetshälsa AB) and 25·0 µg D3 per each D3 pill (Oy Verman Ab). The HPLC method used for the analyses of D2 was run accredited according to ISO17025 at Technical University of Denmark( Reference Kristensen, Rosenqvist and Jakobsen 13 ). The standard deviation for the method was 6·5 %, and the detection limit was 0·3 µg/100 g.
Biochemical analyses
The total S-25(OH)D concentrations of the screening samples were assessed 1–2 weeks before the trial by OCTEIA immunoenzymometric assay (IDS) at the Department of Food and Environmental Sciences, University of Helsinki. Reproducibility of the analysis was ensured by adhering to the Vitamin D External Quality Assessment Scheme (DEQAS; Charing Cross Hospital, London, UK; http://deqas.kpmd.co.uk/). The laboratory received the DEQAS proficiency certificate in 2012. Inter-assay and intra-assay CV were 2·7 and 3·2 %, respectively. The S-25(OH)D concentrations in the trial samples (i.e. baseline, midpoint and end point) were analysed by the Vitamin D Research Group at University College Cork in Ireland using a liquid chromatography-tandem MS (LC-MS/MS) core analytical platform for the ODIN project. This LC-MS/MS method measures S-25(OH)D2 and S-25(OH)D3 separately, and total S-25(OH)D concentrations were calculated based on the summation of these values. The inter-assay and intra-assay CV for the analyses were <5 and <6 %, respectively, for both metabolites( Reference Cashman, Kiely and Kinsella 14 ). The quality and accuracy of S-25(OH)D analysis by the LC-MS/MS in our laboratory is monitored on an ongoing basis by participation in the DEQAS. In addition, the Vitamin D Research Group method is certified under the Centers for Disease Control and Prevention Vitamin D Standardization Certification Program (http://www.cdc.gov/labstandards/pdf/hs/CDC_Certified_Vitamin_D_Procedures.pdf). Serum intact parathyroid hormone (S-iPTH) concentrations were analysed by the immunoluminescence-based method using Immulite1000 (Siemens Healthcare Diagnostics), and serum Ca (S-Ca) concentrations were analysed by a photometric method using Konelab20 automatic analyser (Thermo Clinical Labsystems Oy) at the Department of Food and Environmental Sciences, University of Helsinki. For S-iPTH analyses, the inter-assay and intra-assay CV were <8·0 and <5·5 %, respectively, and for S-Ca <4·6 and <4·6 %, respectively.
Sample size estimation and statistical analyses
A power calculation based on total S-25(OH)D concentrations was performed to estimate the number of subjects needed to detect a 25 (sd 15) nmol/l change between the groups after intervention, assuming a power of 90 % (α=0·05). This calculation estimated that a sample size of eight per intervention group would be adequate (thirty-two in total); however, this number was increased by 25 % to account for possible dropouts. Anticipating that some potential volunteers would have relatively high S-25(OH)D concentrations, we decided to include a total of fifty-four subjects who qualified for participation and screen them for total S-25(OH)D concentration. The forty-one subjects with the lowest S-25-(OH)D concentrations were accepted as participants.
Statistical analysis was performed using SPSS Statistics version 22 (IBM). Data are presented as mean values and standard deviations, and in figures as means with their standard errors. The normality and homogeneity of the data were verified and log-transformed to improve normality, if needed. All tests were considered significant at P<0·05. Correlations between S-25(OH)D and vitamin D intake variables and potential confounding factors were assessed by Spearman’s correlation coefficients. One-way ANOVA was used to assess differences in background variables between intervention groups; non-parametric tests were used for non-normally distributed variables (i.e. vitamin D intake variables). Post hoc tests were carried out with least significant difference for the normally distributed variables. If the variables were not normally distributed, the Kruskal–Wallis test was used. Repeated-measures ANOVA and repeated-measures ANCOVA were used to assess the impact of the intervention on total S-25(OH)D, S-25(OH)D2 (non-normally distributed; log-transformed), S-25(OH)D3, S-PTH and S-Ca as well as changes in S-25(OH)D, S-25(OH)D2, S-25(OH)D3, S-PTH and S-Ca concentrations over time. In ANCOVA, the baseline total S-25(OH)D/S-25(OH)D2/S-25(OH)D3/S-PTH/S-Ca concentration was used as a covariate. Comparisons between groups were carried out with contrasts.
Results
Subject characteristics
Altogether, thirty-seven of forty-one recruited subjects completed the study. For the final analysis, we excluded two subjects with baseline total S-25(OH)D concentrations >100 nmol/l (as per exclusion criteria, even though their screening samples had total S-25(OH)D concentrations <100 nmol/l) (all the analyses were also carried out including these two persons, and no changes in the results were found) – one subject who used an own vitamin D supplement (in addition to the trial supplement) containing 20 µg/d and one subject who discontinued the use of own vitamin D supplement, which resulted in a significant decrease in total S-25(OH)D concentration at the end point for that subject. Thus, the number of subjects included in the final analyses was thirty-three. Baseline characteristics of these thirty-three subjects are presented in Table 1. The intervention groups did not differ from each other significantly in relation to background characteristics, except for S-PTH, where the D2-bread intervention group had a significantly higher S-PTH concentration than the placebo (P=0·022) or the D3 supplement group (P=0·008) (Table 1). The subjects were healthy, aged between 20 and 37 years and did not have continuous medication, except for hormonal contraception (six subjects). None of the subjects reported smoking regularly. In all, twelve of the subjects were allowed to continue taking their own vitamin D supplements (≤15 µg/d) during the study period, but the mean vitamin D intake from own supplements was only 2·7 µg/d and this small supplemental intake should not have greatly affected the results. The mean compliance of the study products among the subjects was 96·7 %, and no differences were present between intervention groups (P>0·05) (data not shown).
Table 1 Background characteristics of the subjects in the four intervention groups and differences between the groups (Mean values and standard deviations; numbers and percentages)

D2, vitamin D2; D3, vitamin D3.
* P values from non-parametric tests.
† In between-group comparison in the D2-bread group concentration is higher compared with placebo (P=0·022) and D3 supplement group (P=0·008).
Mean baseline total S-25(OH)D concentration among the study subjects was 65·1 nmol/l, and it did not differ significantly among groups. The average total vitamin D intake was sufficient (12·2 µg/d) based on the national Finnish recommendation of vitamin D intake of 10 µg/d( 11 ). The average Ca intake was also adequate at 1217 mg/d (recommended intake 800 mg/d)( 11 ) and was similar to that of the general population in Finland( Reference Helldán, Raulio and Kosola 10 ).
Effects on total serum 25-hydroxyvitamin D (Fig. 2(a))
The responses to treatment differed among the groups over time (P=0·003): D3 was more effective in increasing total S-25(OH)D than placebo (P=0·001) or D2-bread (P=0·002). The D2 supplement increased total S-25(OH)D concentrations relative to placebo (P=0·030), but only borderline relative to D2-bread (P=0·050). The mean changes in the D2 supplement group and the D3 supplement group were +9·6 nmol/l (+14·7 %) and +17·0 nmol/l (+26·2 %), respectively. In placebo and D2-bread groups, total S-25(OH)D remained at baseline levels. No other differences between groups emerged (P>0·05) (repeated-measures ANCOVA, adjusted for baseline total S-25(OH)D concentration).

Fig. 2 Response of total serum 25-hydroxyvitamin D (S-25(OH)D) (a), serum 25-hydroxyvitamin D3 (S-25(OH)D3) (b), serum 25-hydroxyvitamin D2 (S-25(OH)D2) (c) and serum parathyroid hormone (S-PTH) (d) concentration to vitamin D supplementation over the 8-week study period. Time points are at 4-week intervals, representing mean values at each time point, error bars represent standard errors. In repeated-measures ANCOVA, the differences were significant: total S-25(OH)D (P=0·003), S-25(OH)D3 (P<0·001), S-25(OH)D2 (P<0·001) and S-PTH (P=0·018). The significances of between-group comparisons (contrasts) are reported in the text. The values are adjusted for baseline total S-25(OH)D/S-25(OH)D3/S-25(OH)D2/S-PTH concentrations. D2, vitamin D2; D3, vitamin D3; ![]() , D2-bread;
, D2-bread; ![]() , D3 supplement;
, D3 supplement; ![]() , D2 supplement;
, D2 supplement; ![]() , placebo.
, placebo.
Effects on serum 25-hydroxyvitamin D3 (Fig. 2(b))
A difference among the groups in response to supplementation was present over time (P<0·001): D3 supplementation increased S-25(OH)D3 the most (compared with all the other groups, P<0·001). The S-25(OH)D3 concentration decreased in the D2 supplement group relative to the D2-bread (P=0·001) and placebo groups (P<0·001). The mean changes in the D2 supplement group and D3 supplement group were −21·7 nmol/l (−35·4 %) and +18·5 nmol/l (+30·3 %), respectively. S-25(OH)D3 concentration remained at similar levels throughout the study in the D2-bread and placebo groups. No other changes between the groups were observed (P<0·05) (repeated-measures ANCOVA, adjusted for baseline S-25(OH)D3 concentration).
Effects on serum 25-hydroxyvitamin D2 (Fig. 2(c))
The effect of supplementation on S-25(OH)D2 concentrations differed among the groups over time (P<0·001). The D2 supplement was the most effective in increasing S-25(OH)D2 concentration (compared with all the other groups, P<0·001), and D2-bread resulted in a higher S-25(OH)D2 concentration than placebo or D3 supplement (P for both <0·001). The mean changes in the D2 supplement group and D2-bread group were +31·3 and +6·4 nmol/l, respectively. No changes relative to baseline concentrations in the placebo or D3 supplement group emerged. No other significant differences in between-group comparisons were evident (P>0·05) (repeated-measures ANCOVA, adjusted for baseline S-25(OH)D2 concentration).
Effects on serum parathyroid hormone (Fig. 2(d)) and serum calcium
The responses of S-PTH concentrations to supplementation differed among the groups over time (P=0·018). The D2 supplement and D2-bread groups remained at baseline levels throughout the study. S-PTH concentrations decreased in the D3 supplement group compared with the D2-bread (P=0·021) and D2 supplement groups (P=0·006). Relative to the D2 group, S-PTH decreased in the placebo group (P=0·019). The mean changes in placebo and D3 supplement groups were −10·8 nmol/l (−27·0 %) and −11·2 nmol/l (−28·7 %), respectively. Between other groups, no differences were observed (P>0·05). No impact of intervention on S-Ca concentrations during the trial was present (P>0·05, results not shown) (repeated-measures ANCOVA, adjusted for baseline S-PTH/S-Ca concentration).
Discussion
Some studies have shown that D3-fortified breads improve S-25(OH)D status in different population groups( Reference Natri, Salo and Vikstedt 15 , Reference Mocanu and Vieth 16 ), and some D3-fortified breads are currently on the market in Finland as well. The aim of our study was to determine whether UVB-activated D2 of yeast added to bread, as a new source of vitamin D, could improve S-25(OH)D status in an attempt to find a cheaper and more ecological alternative for improving vitamin D intake and status in the general population. In our 8-week randomised-controlled trial (RCT) in young adult females during winter in Finland, the daily ingestion of bread containing 25 µg of D2 derived from UVB-irradiated baker’s yeast only very modestly increased mean S-25(OH)D2 concentration (by 6·4 nmol/l), whereas mean total S-25(OH)D concentration did not increase nor were there any changes in mean S-25(OH)D3 or S-PTH concentrations. In contrast, daily supplementation of young adult females with 25 µg of D2 as a capsule increased mean S-25(OH)D2 and total S-25(OH)D concentrations (by 31·3 and 9·6 nmol/l, respectively) over the same time frame. These findings indicate a very low bioavailability of D2 from the UVB-irradiated yeast in bread. Interestingly, the daily supplementation with 25 µg of D2 decreased S-25(OH)D3 concentrations (by 21·7 nmol/l, on average), which led to the mean increase in total S-25(OH)D concentration being less than that achieved by supplementation with an equivalent amount of D3 (by 17·0 nmol/l less) over the same time frame. A decreasing effect of D2 supplementation on S-25(OH)D3 concentrations has also been noted in earlier studies( Reference Logan, Gray and Peddie 5 , Reference Tripkovic, Lambert and Hart 6 ). The Tripkovic et al. ( Reference Tripkovic, Lambert and Hart 6 ) meta-analysis of vitamin D supplemental studies suggested that no proper data existed with regard to food-derived D2.
The present study, to our knowledge, was the first to test D2-enriched bread in humans and showed a poor bioavailability of D2 from UVB-irradiated yeast. Hohman et al. ( Reference Hohman, Martin and Lachlik 17 ), in their rat experiment, showed a significant increase in total S-25(OH)D in young growing rats fed UVB-irradiated yeast incorporated into bread. Beyond the species and life-stage differences between that study and our present study, the rats in their study( Reference Hohman, Martin and Lachlik 17 ) that were highly vitamin D deficient were in the bread intervention phase (7 weeks of a lead-in diet containing 2·5 % of American Institute of Nutrition-recommended vitamin D intake for growing rodents, leading to a mean plasma 25(OH)D of approximately 2 nmol/l entering the study), whereas the healthy young adults in our RCT were of relatively good vitamin D status (mean S-25(OH)D, 65·1 nmol/l at baseline), which is very much in line with the current situation at a national level in Finland( Reference Cashman, Dowling and Skrabakova 18 ). Thus, the baseline vitamin D status may impact on the S-25(OH)D response of subjects to increased D2 intake in the form of bread made from UV-irradiated yeast. Also of interest, the plasma 25(OH)D response of the rats in the Hohman et al. ( Reference Hohman, Martin and Lachlik 17 ), study to D2 (from UVB-irradiated yeast) was only half of that achieved by rats given an equivalent amount of D3 (provided in crystalline form in the diet, not included in the bread). Unfortunately, the study lacked a group provided with D2 as a supplement, which could have shown a difference in the bioavailability between sources of D2. The reason for the lack of efficacy of the UVB-activated D2 of yeast in raising S-25(OH)D2 and total S-25(OH)D in the healthy young adult females in the current study is not clear. It is interesting to note that, although UV-irradiated mushrooms have been effective in increasing S-25(OH)D concentrations and bone growth in rats( Reference Calvo, Babu and Garthoff 19 ), the results in human studies are contradictory( Reference Urbain, Singler and Ihorst 20 – Reference Mehrotra, Calvo and Beelman 23 ). A recent meta-analysis of data from randomised-controlled studies on the effectiveness of UV-exposed edible mushrooms on raising serum total S-25(OH)D showed that the effectiveness was only evident when the baseline vitamin D status of participants was inadequate (mean S-25(OH)D<approximately 50 nmol/l) and not when status was high( Reference Cashman, Kiely and Seamans 24 ). The increased D2 from consumption of UV mushrooms led to a significant increase in S-25(OH)D2 but a partial reduction in S-25(OH)D3, which reduced the overall response of total S-25(OH)D. Of note, in the two studies with high status (mean S-25(OH)D >70 nmol/l), the increase and decrease of S-25(OH)D2 and S-25(OH)D3, respectively, were of an equal magnitude such that there was no net change in total S-25(OH)D. The meta-analysis also pointed to the potential for the pre-treatment of the mushrooms explaining the differences among studies( Reference Cashman, Kiely and Seamans 24 ). In the present study, the D2 group, which had a much greater increase in S-25(OH)D2, compared with the D2-bread group (31·3 v. 6·4 nmol/l, respectively), had a significant reduction in S-25(OH)D3 (−21·7 nmol/l), whereas the D2-bread group had no significant change. These findings may point to the possibility that the baking process of the bread, which, although not affecting the D2 content of the bread, may have influenced the bioavailability of D2 in the bread. Thus, it is possible that the digestibility of the yeast preparation was low and did not allow liberation of the D2, something that will require further investigation.
In the present study, D3 supplementation (25 µg/d) increased S-25(OH)D3 and total S-25(OH)D concentrations, as expected, and had no effect on S-25(OH)D2. As seen in previous studies, an inverse relationship between S-PTH and total S-25(OH)D concentrations was present( Reference Lamberg-Allardt, Brustad and Meyer 1 ). In our study, supplementation with D3 resulted in decreases in S-PTH concentrations. Nevertheless, this effect was not observed in the D2 supplement group, even though the total S-25(OH)D concentration increased. This observation is in line with that of Romagnoli et al. ( Reference Romagnoli, Mascia and Cipriani 7 ), who found that D3 decreased S-PTH, whereas D2 had no effect on S-PTH. Further, no effects of supplementation on S-Ca concentrations were perceived; however, measurement of serum ionised Ca, the active form of Ca, would have provided more accurate data on possible changes in Ca homoeostasis.
Overall, our results support the contention that D2 appears to be a less effective alternative than D3 in improving vitamin D status( Reference Romagnoli, Mascia and Cipriani 7 , Reference Jones 25 , Reference Houghton and Vieth 26 ). Treatment with D2 has been suggested to cause a decrease in the percentage contribution of D3 to the total vitamin D pool that is available for hydroxylation to the active metabolite – 1,25-dihydroxyvitamin D – resulting in a decrease in S-25(OH)D3 ( Reference Swanson, Nielson and Shrestha 27 ). However, it remains uncertain whether D2 and D3 and their metabolites are biologically equivalent and whether a competitive situation exists( Reference Swanson, Nielson and Shrestha 27 ). Studies have shown that supplementation with D2 contributed to lower S-25(OH)D3 concentrations than D3 supplementation, even though total S-25(OH)D concentrations increased with doses of 25–50 µg/d for 8–25 weeks( Reference Logan, Gray and Peddie 5 , Reference Biancuzzo, Clarke and Reitz 28 , Reference Lehmann, Hirche and Stangl 29 ). Moreover, in a cross-sectional study, higher S-25(OH)D2 has been associated with lower S-25(OH)D3 and further lower concentrations of the active metabolite of D3, S-1,25(OH)D3 ( Reference Swanson, Nielson and Shrestha 27 ). It is important to note that different analytical methods for 25(OH)D may affect the results( Reference El-Hajj Fuleihan, Bouillon and Clarke 30 ), as all of the methods are not able to separate S-25(OH)D2 and S-25(OH)D3. However, in our study and in the above-mentioned studies, LC-MS/MS methods, which detect both forms distinctly, were used( Reference Swanson, Nielson and Shrestha 27 – Reference Lehmann, Hirche and Stangl 29 ).
The mean baseline total S-25(OH)D concentration among the study participants was above the 50 nmol/l recommended by the Institute of Medicine( Reference Ross, Manson and Abrams 31 ), being similar to the concentration in the general Finnish population( Reference Cashman, Dowling and Skrabakova 18 ). On the basis of power calculations, we aimed to find an increase of 25 nmol/l in total S-25(OH)D in the treatment groups. In our study, the largest difference in S-25(OH)D was present between the D3 supplementation group and the placebo group (18·9 nmol/l), and did not reach the aimed level. Thus, the fairly high baseline S-25(OH)D concentrations and adequate vitamin D intake may have hidden a stronger effect of the intervention on total S-25(OH)D concentrations, which could have been found with lower baseline concentrations. At present, due to the improved vitamin D consciousness in the Finnish population, it is difficult to recruit subjects with low S-25(OH)D for intervention studies. In the cross-sectional population study, the FINDIET 2012 Study, 56 % of the female participants used vitamin D supplements( Reference Helldán, Raulio and Kosola 10 ). The relatively good S-25(OH)D status is probably due to the fortification policy in Finland and the increased use of supplementary vitamin D.
Conclusions
The D2 from the biofortified bread did not appear to possess good bioavailability in humans. The reason for this is obscure, possibly caused by the baking process of the bread or a potentially undigestible form of D2 in the yeast preparation. However, our results strengthen the data that D2 supplementation decreases S-25(OH)D3 concentrations, indicating possible replacement of S-25(OH)D3 by S-25(OH)D2 in biological actions of vitamin D. Possibly affecting the results is that the baseline total S-25(OH)D concentrations of the subjects were fairly satisfactory.
Acknowledgements
The authors thank Dr Heli T Viljakainen for statistical advice and technician Anu Heiman-Lindh for laboratory analyses in Helsinki.
This work was supported by funding received by the authors from the European Commission under its Seventh Framework Programme (ODIN; grant agreement no. 613977). Lallemand SAS provided the UVB yeast and study breads. Study supporters had no role in the design, analysis or writing of this article.
The author contributions are as follows: C. L.-A., J. J. and K. D. C. are grant holders. S. T. I., E. S., P. S., M. E. and C. L.-A. designed the study. E. S., P. S. and E. M. S. collected the data. J. J. was responsible for the bread and supplement vitamin D analyses. K. D. C. was responsible for the S-25(OH)D analyses in Cork. S. T. I. performed the statistical analyses and drafted the manuscript. All authors reviewed and approved the final draft of the manuscript.
The authors have no conflicts of interest to declare.


