


Some of the disadvantages associated with self-reported dietary questionnaires in epidemiological and clinical studies( Reference Nielsen, Freese and Kleemola 1 , Reference Hu, Rimm and Smith-Warner 2 ) can be overcome by using biomarkers that provide a more objective assessment of nutrient intake( Reference Spencer, Abd El Mohsen and Minihane 3 – Reference Lehtonen, Lindstedt and Järvinen 5 ). In the case of wine, a biomarker of intake might reflect consumption more accurately than a questionnaire, as individuals may be reluctant to accurately report customary drinking level due to the social undesirability of excessive alcoholic beverage consumption( Reference Hedrick, Dietrich and Estabrooks 6 ).
Total urinary resveratrol metabolites (TRM) have been proposed as biomarkers of wine intake in both clinical and epidemiological studies( Reference Zamora-Ros, Urpí-Sardà and Lamuela-Raventós 7 , Reference Zamora-Ros, Urpí-Sardà and Lamuela-Raventós 8 ), although the high variation in resveratrol content between red and white wines, as a result of different oenological practices, and also between grape varieties( Reference Romero-Pérez, Lamuela-Raventós and Waterhouse 9 , Reference Romero-Pérez, Lamuela-Raventós and Buxaderas 10 ), is an important limitation. In addition, the varying microbiological metabolism reported for resveratrol( Reference Bode, Bunzel and Huch 11 ) could contribute to a higher variation. Therefore, to obtain greater insight into the health effects of moderate wine drinking, new reliable biological markers for wine intake are needed.
In this context, tartaric acid might be a promising candidate, as it accounts for a major fraction of wines, normally within the range of 1·5–4·0 g/l( Reference Regmi, Palma and Barroso 12 , Reference Ribéreau-Gayon, Glories and Maujean 13 ). Tartaric acid, the main acid responsible for wine acidity, is a natural organic acid occurring in grapes at a high concentration (up to 1 % of whole fresh grapes), but rare in most other common plants( Reference Ribéreau-Gayon, Glories and Maujean 13 , Reference Velioglu and Yildiz 14 ). This fact provides high selectivity for tartaric acid when compared with other wine constituents. Furthermore, tartaric acid is not degraded during the winemaking process, and hence its levels remain relatively constant in both red and white wines( Reference Ribéreau-Gayon, Glories and Maujean 13 ). Studies on its metabolism in human subjects have suggested that tartrate excreted in the urine is mainly from dietary sources. Unlike other fruit acids (such as malic and citric acids), which are digested and converted to energy in the body, tartaric acid mostly bypasses the small intestine and is fermented by colonic bacteria, and has been shown to have a beneficial role in intestinal function( Reference Spiller, Story and Furumoto 15 ).
Lord et al. ( Reference Lord, Burdette and Bralley 16 ) reported a significant increase in urinary tartaric acid after consumption of grape juice, while Vázquez-Fresno et al. ( Reference Vázquez-Fresno, Llorach and Alcaro 17 ) observed that its urinary concentrations were significantly higher in wine consumers than in non-wine consumers.
Nevertheless, the use of urinary tartaric acid as a biomarker of wine consumption has not been formally assessed. Therefore, we evaluated the usefulness of tartaric acid as a wine biomarker in a randomised, controlled, cross-over clinical trial conducted in healthy male volunteers.
Materials and methods
Reagents and standards
L-(+)-Tartaric acid and creatinine were purchased from Sigma. The labelled internal standard dl-( ± )-tartaric-2,3-d2 acid was obtained from C/D/N Isotopes. Formic acid (approximately 98 %), picric acid (98 %, moistened with approximately 33 % water) and sodium hydroxide ( ≥ 98 %) were purchased from Panreac. Solvents were HPLC grade and all other chemicals were analytical reagent grade. Ultrapure water was obtained from a Milli-Q Gradient water purification system (Millipore).
Stock solutions of tartaric acid were prepared in water. Different working standard solutions were made by appropriate dilution in 0·5 % formic acid in water and then stored in amber glass vials at − 20°C.
Wine samples
A commercial red wine from the Spanish Protected Designation of Origin ‘Rioja’ was used over the course of the present study. It was elaborated with grapes of Vitis vinifera L. and consisted of a blend of Tempranillo (85 %) and Graciano and Garnacha Tinta (15 %) varieties from the 2009 vintage. To ensure its homogeneity, the wine belonged to the same batch and was bottled on the same day. The wine had a pH value of 3·7 and 13·0 % alcohol by volume. The content of tartaric acid was determined by liquid chromatography coupled to electrospray ionisation tandem MS (LC–ESI-MS/MS) as described previously( Reference Regueiro, Vallverdu-Queralt and Simal-Gandara 18 ). Tartaric acid level in this wine was 1737 (sd 17) mg/l (n 3).
Subjects and study design
A total of twenty-one Caucasian healthy men, with a mean age of 30·7 (sd 5·9) years (median 30·0 years; range 21–50 years) and a mean BMI of 24·7 (sd 2·7) kg/m2 (median 24·2 kg/m2; range 19·8–32·9 kg/m2), participated in a randomised cross-over feeding trial.
The subjects were non-smokers; had no history of cardiovascular, hepatic or renal disease; had no acute or chronic infection, inflammatory disease or endocrine disorders; had no anti-inflammatory, corticosteroid, hormonal or antibiotic drug treatment during the previous 3 months; had no history of alcohol abuse or drug dependence; and had not adhered to any special diets at least 4 weeks before the commencement of the study. Only male subjects were recruited, in order to reduce the menstrual cycle phase-related variability in women, putatively affecting the absorption, metabolism and excretion processes.
The present study was conducted according to the guidelines laid down in the Declaration of Helsinki, and all procedures involving human subjects were approved by the Ethics Committee of Clinical Investigation of the University of Barcelona (Spain) (reference no. IRB0003099). Written informed consent was obtained from all subjects. The study protocol followed the recommendations made in the CONSORT (Consolidated Standards of Reporting Trials) guidelines( Reference Schulz, Altman and Moher 19 ). The present trial was registered at controlled-trials.com as ISRCTN63399546.
The interventions consisted of intake at dinner, in a random order, of 100, 200 and 300 ml red wine, corresponding to 10·3, 20·5 and 30·8 g ethanol, respectively. The participants were randomly assigned following simple randomisation procedures (computerised random numbers) to one of three treatment groups. Before each intervention, the participants followed a 7 d washout period during which they were requested to avoid consuming wine or grape-based products.
First morning urine samples were collected the day before the first intervention and in the morning following each intervention (Fig. 1). All samples were collected in 100 ml random coded sterile specimen containers, and immediately stored at 4°C. Upon receipt of each sample, four aliquots of 1·0 ml were transferred to separate 1·5 ml capped Eppendorf tubes and stored at − 80°C until the analyses, which were performed with no knowledge of the clinical data.
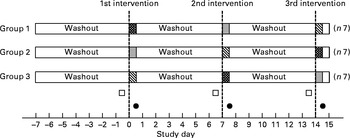
Fig. 1 Schematic representation of the study design. ![]() , Consumption of 100 ml wine at dinner;
, Consumption of 100 ml wine at dinner; ![]() , consumption of 200 ml wine at dinner;
, consumption of 200 ml wine at dinner; ![]() , consumption of 300 ml wine at dinner; □, basal urine sample; ●, post-intervention urine sample.
, consumption of 300 ml wine at dinner; □, basal urine sample; ●, post-intervention urine sample.
Analytical methods
Determination of urinary tartaric acid concentration was carried out according to a previously validated stable-isotope dilution LC–ESI-MS/MS method( Reference Regueiro, Vallverdu-Queralt and Simal-Gandara 18 ). Briefly, urine samples (50 μl) were diluted 1:20 (v/v) with 0·5 % formic acid in water, and 10 μl of a 2H-labelled isotope standard solution in water (dl-( ± )-tartaric-2,3-d2 acid, 60 μg/ml) were added. The sample dilution was filtered using a 0·20 μm filter and analysed by LC–ESI-MS/MS. All samples were analysed in triplicate.
To normalise analyte concentrations in spot urine samples, all results were corrected for urinary creatinine( Reference Boeniger, Lowry and Rosenberg 20 ), and are reported as μg tartaric acid/mg creatinine in the morning urine. Urinary creatinine was determined by a modification of Jaffé's alkaline picrate method( Reference Medina-Remón, Barrionuevo-González and Zamora-Ros 21 ).
LC–ESI-MS/MS analyses were performed on an Agilent 1100 Series HPLC system (Agilent Technologies) coupled to a triple quadrupole mass spectrometer API 3000 (Applied Biosystems) as described elsewhere( Reference Regueiro, Vallverdu-Queralt and Simal-Gandara 18 ). Chromatographic separation was performed on a reversed-phase column Atlantis T3 C18 (100 × 2·1 mm, 3 μm) from Waters maintained at 25°C. Mobile phases A and B were, respectively, 0·5 % formic acid in water and 0·5 % formic acid in acetonitrile. The following linear gradient was used: held at 100 % A for 3·5 min, decreased to 10 % A over 2 min and held for 2 min, and then returned to initial conditions for 1·5 min and re-equilibrated for 6 min. The flow rate was set at 350 μl/min and the injection volume was 10 μl. Post-column addition of acetonitrile (250 μl/min) was carried out to improve analyte ionisation efficiency. Detection was accomplished in the multiple reaction monitoring mode, and the following MS/MS transitions were used for quantification and confirmation, respectively: m/z 149/87 and m/z 149/73 for tartaric acid, and m/z 151/88 and m/z 151/74 for the 2H-labelled isotope.
Statistical analysis
Statistical calculations were made using the software package GraphPad Prism version 5·0 (GraphPad Software). Unless otherwise specified, data are presented as means and standard deviations, and a 0·05 significance level was used. All data were assessed for normality using the ‘omnibus K2’ D'Agostino–Pearson and the Shapiro–Wilk normality tests. Since concentration of urinary tartaric acid was not normally distributed, the non-parametric Mann–Whitney U test and Wilcoxon test were applied to determine statistical difference between groups. Spearman's rank correlation was used to estimate the relationship between urinary excretion and wine consumption. Receiver-operating characteristic (ROC) curve analysis was performed on the concentration of urinary tartaric acid to evaluate its sensitivity and specificity in the discrimination between periods of abstention and wine drinking. To determine the optimal cut-off value, ROC curves were constructed using all possible cut-off points for each assay. For sensitivity and specificity, 95 % CI were calculated using the Clopper–Pearson exact binomial method.
Results
The estimated intake of tartaric acid for the three interventions was 174 (sd 2), 347 (sd 3) and 521 (sd 5) mg for 100, 200 and 300 ml wine consumption, respectively.
The concentrations of urinary tartaric acid before and after each intervention are shown in Fig. 2. After the 7 d washout periods, the median urinary concentration was 1·06 (interquartile range 0.56–1.78) μg/mg creatinine. After wine consumption, a significant rise in its urinary concentration was observed. The amount of tartaric acid increased by 27·0 (95 % CI 22·9, 32·9) μg/mg (P <0·001) after the intake of 100 ml wine, by 52·5 (95 % CI 44·5, 69·7) μg/mg (P <0·001) after the intake of 200 ml wine and by 80·8 (95 % CI 73·1, 107) μg/mg (P <0·001) after the intake of 300 ml wine. The order of interventions did not affect the results. Spearman's correlation analysis revealed a strong direct association between wine dose and urinary tartaric acid (r s= 0·9220; P <0·001).
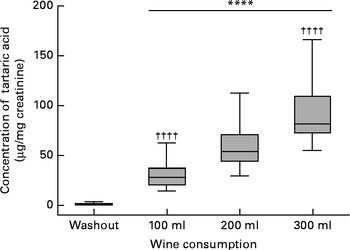
Fig. 2 Box and whisker plot showing the median (central line), 25–75 percentiles (boxes) and the entire range (whiskers) for the urinary tartaric acid concentration after the 7 d washout periods and after the intake of 100, 200 and 300 ml wine, respectively. **** Mean value was significantly different from that of the washout period (P <0·0001). †††† Mean value was significantly different from that of the 200 ml intake (P <0·0001).
To assess the effectiveness of tartaric acid as a biomarker of wine intake, a ROC curve was constructed, showing an AUC of 100 % (P <0·001; Fig. 3). The optimal cut-off point was 8·84 μg/mg creatinine (58·9 nmol/mg creatinine), which allowed wine consumers to be differentiated from non-wine consumers. This point had a sensitivity of 100 % (95 % CI 83·9, 100 %) and a specificity of 100 % (95 % CI 83·9, 100 %). When trying to differentiate between the low dose (100 ml) and the intermediate dose (200 ml), the resulting ROC curve presented an AUC of 91·4 % (95 % CI 82·6, 100 %; P <0·001) and an optimal cut-off value of 40·7 μg/mg creatinine (271 nmol/mg creatinine), which resulted in a sensitivity of 85·7 % (95 % CI 63·7, 96·9 %) and a specificity of 90·5 % (95 % CI 69·6, 98·8 %). Another ROC curve was obtained, aiming to differentiate between the intake of 100 and 300 ml wine (Fig. 3). In this case, the AUC was 99·6 % (95 % CI 98·3, 100 %; P <0·001) and the optimal cut-off value was 48·7 μg/mg creatinine (324 nmol/mg creatinine). This point had a sensitivity of 100 % (95 % CI 83·9, 100 %) and a specificity of 95·2 % (95 % CI 76·2, 99·9 %).
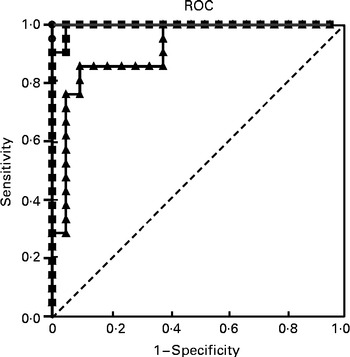
Fig. 3 Receiver-operating characteristic (ROC) curves of urinary tartaric acid to discriminate between wine and non-wine consumers, and between low (100 ml) and moderate (300 ml) wine consumption in the clinical trial. ![]() , Non-consumers v. 100 ml wine intake;
, Non-consumers v. 100 ml wine intake; ![]() , 100 v. 200 ml wine intake;
, 100 v. 200 ml wine intake; ![]() , 100 v. 300 ml wine intake.
, 100 v. 300 ml wine intake.
Discussion
A major challenge for scientists investigating the health-promoting effects of moderate wine consumption is to reliably and accurately assess the consumption status in their clinical and/or epidemiological studies.
In this regard, concentration of urinary TRM has been previously proposed as a biomarker of wine intake. TRM showed a significant dose–response effect (r 0·645; P< 0·001), and it was able to differentiate between wine drinkers and non-wine drinkers with high sensitivity and specificity (72 and 94 %, respectively) at a cut-off value of 90 nmol/g creatinine( Reference Zamora-Ros, Urpí-Sardà and Lamuela-Raventós 8 ). Nevertheless, TRM has limitations as a biomarker because resveratrol is not specific to grapes and can also be found in peanuts, although at lower concentrations( Reference Burns, Yokota and Ashihara 22 , Reference Sobolev and Cole 23 ); moreover, resveratrol content has been shown to vary substantially among different types of wine( Reference Romero-Pérez, Lamuela-Raventós and Waterhouse 9 , Reference Burns, Yokota and Ashihara 22 ).
Further research is therefore needed to evaluate other wine constituents or their metabolites in the human body as potential biomarkers of wine consumption. The aim of the present study was to examine whether tartaric acid, a main wine component, might be a suitable biomarker of moderate wine consumption. In contrast to resveratrol, with several important dietary sources, the major source of tartaric acid in the diet is grapes, and therefore also wine( Reference Ribéreau-Gayon, Glories and Maujean 13 , Reference Velioglu and Yildiz 14 ). Although it can be found in other fruits such as bananas, its concentration levels can be considered negligible when compared with grapes or wine( Reference Velioglu and Yildiz 14 , Reference Flores, Hellín and Fenoll 24 ). Only tamarind, a sour fruit whose consumption is mainly restricted to tropical areas, presents comparable contents of this acid( Reference Spiller, Story and Furumoto 15 ).
Accordingly, after the washout periods, during which the only dietary restriction was the consumption of wine or any other grape-based products, a very low concentration of tartaric acid was detected in the urine, probably due to the previous intake of some food containing low levels of tartaric acid.
An effective nutritional biomarker should also be robust and have a strong direct relationship with specific dietary consumption( Reference Blanck, Bowman and Cooper 25 , Reference Marshall 26 ). The strong correlation observed between wine intake and urinary tartaric acid indicates that the concentration of this acid in the urine reflects the amount of wine consumed. Thus, its urinary concentration underwent a 27-fold increase after drinking only 100 ml wine and almost 80-fold after consumption of 300 ml wine. In a previous study conducted in five male volunteers, the concentration of urinary tartaric acid also significantly increased (P <0·01) after consumption of 200 ml red wine, reaching urinary levels between 35·1 and 91·8 μg/mg creatinine( Reference Regueiro, Vallverdu-Queralt and Simal-Gandara 18 ). Similar results have been reported by Lord et al. ( Reference Lord, Burdette and Bralley 27 ) in urine samples of two healthy men after the consumption of two glasses of wine, which showed an increase in tartaric acid concentrations from < 10 μg/mg to 179 and 210 μg/mg, respectively. In a further study with twenty-three subjects, the same authors observed the dietary impact of grape juice consumption on urinary tartrate, which rose from 7·40 to 282 μg/mg after the intake of 280 ml grape juice( Reference Lord, Burdette and Bralley 16 ). More recently, Vázquez-Fresno et al. ( Reference Vázquez-Fresno, Llorach and Alcaro 17 ) also reported an increase in urinary tartaric acid concentrations in sixty-one male volunteers with high cardiovascular risk factors after the intake of 272 ml red wine and dealcoholised red wine.
Since this acid comes directly from grapes, their consumption as table grapes, raisins or processed into jams and juices would also increase its urinary concentration in a similar way to wine. However, most grapes are used for winemaking (approximately 70 %), about 30 % are consumed fresh and only a minor portion ( < 1 %) are consumed as raisins( 28 ).
To the best of our knowledge, the influence of the food matrix on the bioavailability of tartaric acid has not yet been studied. Interestingly, with the exception of wine or grape-based products, no restrictions were made regarding the intake of food and beverages on the previous days or even on the day of the intervention. Thus, the present results were obtained under real feeding conditions, which suggested that the absorption and excretion of tartaric acid is little affected by the food matrix. This finding confirms that this potential biomarker of wine intake would be selective enough to be minimally affected by a general diet.
Another requirement is that the biomarker permits the discrimination between different levels of consumption( Reference Hunter and Willett 29 ). Under controlled trial conditions, a cut-off value of 8·84 μg/mg creatinine (58·9 nmol/mg creatinine) in the concentration of urinary tartaric acid allowed consumers and non-consumers of wine to be distinguished with maximal sensitivity and specificity (Fig. 3). A second ROC curve was constructed aiming to differentiate between the wine intakes of the low dose (100 ml) and the intermediate dose (200 ml), obtaining a cut-off value of 40·7 μg/mg creatinine (271 nmol/mg creatinine), showing enough sensitivity and specificity. Finally, a cut-off value of 48·7 μg/mg creatinine (324 nmol/mg creatinine) was established to distinguish between low-dose (100 ml) and moderate-dose wine consumers (300 ml), again showing maximal sensitivity and specificity >95 %.
It should be noted that the present data were obtained from a randomised, controlled, cross-over study in which individuals acted as their own controls, which are the optimal conditions for investigating dietary biomarkers. Furthermore, these results might not be generalisable to the women population as only men were included in the present study. Therefore, further research with free-living populations is necessary to determine whether the excretion of tartaric acid can categorise individuals, both men and women, according to their wine intake under uncontrolled conditions.
In comparison with urinary resveratrol metabolites, urinary tartaric acid has some potential advantages. In this context, one of the major limitations of using resveratrol metabolites is the highly varying concentration of resveratrol in wine, usually within the range of 0·98–18·0 mg/l depending on the grape variety( Reference Burns, Yokota and Ashihara 22 ). In addition, the concentration of resveratrol in red wines is much higher than that in white wines, since during the red winemaking, skins, which account for the highest content of resveratrol in grapes( Reference Romero-Pérez, Lamuela-Raventós and Waterhouse 9 , Reference Roldán, Palacios and Caro 30 ), are macerated with the juice, while in white winemaking, only the free-run juice without skin contact is used.
Furthermore, it has been shown that colonic microbiota may play a significant role in resveratrol metabolite production, which needs further investigation due to high inter-individual human microbiota variability( Reference Bode, Bunzel and Huch 11 ).
In contrast, the concentration of tartaric acid in different wines is far more constant, normally within the range of 1·5–4·0 g/l( Reference Regmi, Palma and Barroso 12 , Reference Ribéreau-Gayon, Glories and Maujean 13 ). Tartaric acid is mainly present in the grape pulp, which is used for the winemaking of all kinds of wine, so it would seem more suitable than TRM as a biomarker of wine consumption, including wines with lower contents of resveratrol, such as rose and white wines. Another important advantage relies on the much higher concentration of tartaric acid in wine compared with resveratrol, usually more than 1000-fold. This fact, along with the relatively high percentage of tartrate excreted unchanged in the urine, 14–20 % of ingested dose in human subjects( Reference Chadwick, Vince and Killingley 31 ), would be responsible for the high concentrations of tartaric acid in the urine after wine consumption. This enables a faster sample preparation by simple urine dilution. From an analytical point of view, it results in a reduction of sample manipulation and cost, and at the same time increasing sustainability, accuracy and precision in biomarker measurement.
On the basis of the present findings, urinary tartaric acid may be considered as a sensitive, selective and robust biomarker of moderate wine intake. The present study design did not consider the potential of this acid as a long-term biomarker of intake, especially if wine is episodically consumed. It is likely that tartaric acid is a good short-term biomarker, and that a single urine sample may not be sufficient to assess ‘usual’ intake. Nevertheless, this biomarker could be used in studies in which repeated samples are available and also in combination with self-reported questionnaires to improve the accuracy of intake assessment. The next step is to evaluate whether it can improve the accuracy of intake assessment in epidemiological studies, where the conditions of the participants are less well controlled( Reference Freedman, Tasevska and Kipnis 32 ).
Acknowledgements
The present study was financially supported by Junta de Andalucía and the Spanish Ministry of Economy and Competitiveness funds (AGL2010-22319-C03-01/02) and CIBEROBN. J. R. and A.V.-Q. were supported by contracts Juan de la Cierva and FPU, respectively, from the Spanish Ministry of Science and Innovation. Junta de Andalucía and the Spanish Ministry of Economy and Competitiveness had no role in the design, analysis or writing of this article.
The authors' responsibilities were as follows: J. S.-G., R. E. and R. L.-R. designed the research; J. R. and A. V.-Q. designed the analytical approach; R. E. and R. L.-R. designed the intervention study; J. R., A. V.-Q., R. E. and R. L.-R. recruited the participants and collected the metadata; J. R. and A. V.-Q. performed the laboratory analyses; R. E. and R. L.-R. supervised the dietary interventions and sampling; J. R., A. V.-Q. and R. L.-R. performed the statistical analyses. All authors were involved in data interpretation and manuscript preparation; R.L. had primary responsibility for the final content. All authors read and approved the final manuscript.
None of the authors has any conflict of interest.


