


Fasting plasma glucose concentrations must be lowered to control fasting hyperglycaemia, but decreasing postprandial plasma glucose concentrations, i.e. control of postprandial hyperglycaemia, is also important for achieving glycosylated haemoglobin (HbA1c) targets( 1 – Reference Monnier, Colette and Dunseath 3 ). In addition, reduction of postprandial hyperglycaemia is also desirable as it is an independent risk factor for macrovascular disease in people with diabetes( 1 , Reference Cavalot, Pagliarino and Valle 4 ). Thus, the importance of lowering postprandial plasma glucose concentrations as a therapeutic target in diabetes has been recognised( 1 ).
Postprandial plasma glucose concentrations are well known to be determined mainly by the amount and type of carbohydrate present in a meal( Reference Sheard, Clark and Brand-Miller 5 ). Recently, the effects of nutrients on incretin secretion have attracted research attention. Among the incretin hormones, glucose-dependent insulinotropic polypeptide (GIP) and glucagon-like peptide-1 (GLP-1), both released from the gut, stimulate insulin secretion in a glucose-dependent manner( Reference Seino, Fukushima and Yabe 6 , Reference Schirra, Katschinski and Weidmann 7 ). The secretion of both GIP and GLP-1 is enhanced in response to the ingestion of meals or glucose( Reference Seino, Fukushima and Yabe 6 , Reference Vollmer, Holst and Baller 8 ). Furthermore, co-ingestion of protein, fat and fibre with carbohydrate reportedly affects postprandial glucose, insulin, GIP and GLP-1 responses( Reference Sheard, Clark and Brand-Miller 5 , Reference Pi-Sunyer 9 , Reference Papathanasopoulos and Camilleri 10 ). Therefore, differences among various nutrient combinations with carbohydrate have been suggested to affect postprandial glucose and incretin responses.
With regard to meal planning, Japanese patients with diabetes have been educated to prepare three dishes: one serving as their staple food, a main dish and a vegetable dish called, respectively, ‘shushoku’, ‘shusai’ and ‘fukusai’ to be eaten in one meal( 11 ). Because Japanese commonly consume carbohydrate from ‘shushoku’ consisting of grains, typically boiled white rice, the amount of ‘shushoku’ should be the major determinant of the postprandial glucose response. On the other hand, main dishes called ‘shusai’, prepared with meat, poultry, fish, egg and soyabean products, such as tofu, are rich in protein, while the ‘fukusai’ side dishes prepared with vegetables provide various vitamins, minerals and dietary fibre. These dishes can be cooked with or without oil. Therefore, combination meals comprising these three types of dishes have long been considered to be nutritionally well balanced( Reference Adachi 12 ).
Recently, the effects of side dishes rich in protein and fat( Reference Hätönen, Virtamo and Eriksson 13 ) or rich in viscous fibre( Reference Taniguchi, Yamanaka-Okumura and Nishida 14 ) on lowering of the postprandial glucose response have been reported. However, no study has examined incretin responses or evaluated the differences among combination types of meals with stepwise additions of side dishes to carbohydrate-rich foods in amounts typically eaten by Japanese people.
Therefore, in the present study, we assessed the effects of consuming shusai (main dish) and/or fukusai (vegetable side dishes) with boiled white rice (shushoku) in the same meal on postprandial glucose, insulin, GIP and GLP-1 responses in healthy Japanese men to obtain preliminary information on postprandial glucose and incretin responses to clarify the mechanism by which dietary therapy works in patients with diabetes.
Subjects and methods
Subjects
The necessary sample size, calculated by referring to blood glucose data from a prior study, using 0·05 for the α-error and 0·20 for the β-error, was seven subjects. The subjects were recruited via e-mail. Inclusion criteria were male sex, age between 30 and 49 years, and a BMI between 18·5 and 25 kg/m2. Baseline data on health and lifestyle including habitual food intake were collected using questionnaires. Subjects were excluded if a disease and/or glucose metabolism abnormalities had been detected at their most recent medical check-up or they had a family history of endocrine and/or metabolic disease. A total of nine healthy Japanese men volunteered to participate in the present study at Japan Women's University, Tokyo, Japan.
The present study was conducted according to the guidelines laid down in the Declaration of Helsinki, and all procedures involving human subjects were approved by the ethics committee of Japan Women's University (No. 48). Written informed consent was obtained from all subjects.
Test meals
In the present study, four test meals were designed using boiled white rice as a staple food, with or without side dishes (Table 1). The test meals were as follows: staple food alone (S) as a control meal; staple food and main dish (SM) as a model of a meal with a low-fat main dish; staple food, main dish and fat-rich food item (SMF) as a model of a meal containing a recommended amount of fat; staple food, main dish, fat-rich food item and vegetable dish (SMFV) as a model of a meal containing vegetables along with the other three components. Boiled white rice weighing 200 g (aseptic packed Sato Rice; Sato Foods Company Limited) heated in a microwave oven for 2 min served as the staple food. Main dishes consisted of an egg boiled for 10 min in water and tofu (soyabean curd) (momen-tofu; Takanofoods Company Limited). Mayonnaise (Kewpie Corporation) was used as the fat-rich food item. Vegetable dishes consisted of boiled spinach and boiled broccoli. Frozen spinach (Kewpie Corporation) was boiled for 1 min in water, soaked in cold water for 2 min, squeezed dry and then cut into pieces of 1 cm length. Frozen broccoli (Kewpie Corporation) was boiled for 1 min in water. Each test meal was seasoned with 3 g of soya sauce (Kikkoman Corporation) and served with 200 ml of hot water. All test meals were prepared just before the study. The detailed composition and calculated energy and nutrient contents of the test meals, based on standard tables of food components in Japan (5th edition), are given in Table 1. The SMFV meal conformed to the recommended standard meals for Japanese( 15 ).
Table 1 Composition and nutrient and energy contents of the four test meals
S, staple food; SM, staple food and main dish; SMF, staple food, main dish and fat-rich food item; SMFV, staple food, main dish, fat-rich food item and vegetable dish.
* Aseptic packed Sato Rice; Sato Foods Company Limited.
† Momen-tofu; Takanofoods Company Limited.
‡ Kewpie Corporation.
§ Kikkoman Corporation.
Protocol
The present study was conducted using a randomised, single-blind, cross-over design. All subjects consumed each type of meal, and the duration of the washout period was at least 1 week. Randomisation of the order of consuming each test meal was generated individually using random numbers. While the subjects and staff members who served the test meals were aware of the consumed test meal, data analysts and assessors were blinded to the order of test meal consumption.
The subjects were instructed to maintain their habitual diet and physical activity patterns during the study period and to record data on their daily meals, health status and physical activity. The subjects recorded data on their food intake in detail in 24 h food diaries the day before each test day. They were instructed to finish consuming the same dishes before 21.00 hours the day before each of the test days, ensuring that they fasted overnight.
On the morning of the test, the subjects arrived at Japan Women's University by 09.00 hours. Anthropometric measurements and fasting blood collection were conducted after the aforementioned overnight fast. Immediately after providing a fasting blood sample, the subjects began consuming the test meal. To exclude any influence of the order of meal consumption, the subjects were instructed to eat the boiled white rice and side dishes alternately, to masticate each mouthful of food twenty times before swallowing and to finish eating the entire amount of food in just 15 min. The test meals were consumed under supervision. Venous blood samples were drawn by venepuncture before and 30, 60, 120 and 180 min after meal ingestion. The subjects remained seated throughout the test under the supervision of research staff members.
Measurements
Height, weight and waist circumference of the subjects were measured. Visceral fat area was measured employing the dual impedance analysis method using HDS-2000 DUALSCAN (Omron Healthcare Company Limited).
Plasma glucose, serum insulin, plasma total GIP and plasma intact GLP-1 concentrations were measured at all time points. HbA1c concentration was measured only during the first visit.
At all time points, blood was collected into three tubes: one for serum separation; another for plasma glucose analysis (containing sodium fluoride and potassium oxalate); the last one for plasma incretin analysis. For plasma incretin analysis, to prevent the degradation of intact GIP and intact GLP-1 by dipeptidyl peptidase-4, blood samples were collected directly into BD P800 Blood Collection Tubes (Becton Dickinson) containing a dipeptidyl peptidase-4 inhibitor. The tubes were kept on ice until centrifugation. Blood samples were immediately centrifuged, and samples of the separated plasma and serum were stored at − 80°C until analysis.
Plasma glucose concentration was measured with the hexokinase UV method, HbA1c concentration was measured employing HPLC, and serum total cholesterol, LDL-cholesterol, HDL-cholesterol and TAG concentrations were measured using enzymatic methods in the laboratory at Saitama Social Insurance Hospital, Saitama, Japan. Serum insulin concentration was measured using RIA at Bio Medical Laboratories, Inc., Tokyo, Japan.
Total GIP concentration was measured using the Human GIP (total) ELISA Kit (Millipore Corporation) according to the manufacturer's instructions. The kit recognises both isoforms of GIP (GIP 1–42 and 3–42) at a cross-reactivity of 100 % and the detection limit is 1·6 pmol/l. The intra-assay and inter-assay CV are < 8·8 and < 6·1 %, respectively.
Intact GLP-1 concentration was measured using Glucagon Like Peptide-1 (Active) ELISA (Millipore Corporation) after solid-phase extraction of plasma using Oasis HLB extraction plates at 30 mg/ninety-six wells (Waters Corporation) in Mitsubishi Chemical Medience Corporation, Tokyo, Japan. The kit recognises GLP-1 isoforms at the following cross-reactivities: GLP-1 (1–37) – 0·2 %; GLP-1 (7–37) – 99·5 %; GLP-1 (9–37)– not detected; GLP-1 (1–36) amide – 0·2 %; GLP-1 (7–36) amide – 100 %; GLP-1 (9–36) amide – not detected. The detection limit is 0·83 pmol/l, and the intra-assay and inter-assay CV are < 14·9 and < 13·2 %, respectively.
Calculations and statistical analyses
BMI was calculated employing the following formula: BMI = weight (kg)/height (m)2. Incremental AUC (IAUC), ignoring the areas below the baseline, for glucose, insulin, GIP and GLP-1 were calculated using the trapezoidal rule.
Statistical analyses were carried out using SPSS for Windows (version 16.0J; SPSS Japan, Inc.). All values are reported as means with their standard errors. The statistical significance of differences in values obtained after fasting and consumption of each test meal were assessed using the non-parametric Friedman test followed by the Wilcoxon signed-ranks test for pairwise comparisons with Bonferroni's correction. The carry-over and period effect was evaluated using the non-parametric Friedman test. P< 0·05 was considered to be statistically significant.
Results
All subjects completed the study and consumed all test meals, entirely, without problems. No adverse events such as abdominal pain and diarrhoea were observed during the study period.
The subjects were 38·1 (sem 1·8) years of age with BMI of 23·1 (sem 0·5) kg/m2, waist circumference of 81·1 (sem 1·4) cm, visceral fat area of 54·9 (sem 6·1) cm2, HbA1c concentration of 5·3 (sem 0·1) % and normal serum lipidaemic parameters. Body weights did not change during the study period, and there were no significant differences in fasting biochemical parameters just before consumption of the four test meals (Table 2) and no carry-over and period effect was observed.
Table 2 Body weight and fasting values of plasma glucose, serum insulin, plasma total glucose-dependent insulinotropic polypeptide (GIP) and plasma intact glucagon-like peptide-1 (GLP-1) in healthy men before consumption of the four test meals containing the same amount of boiled white rice with or without side dishes* (Mean values with their standard errors, n 9)
S, staple food; SM, staple food and main dish; SMF, staple food, main dish and fat-rich food item; SMFV, staple food, main dish, fat-rich food item and vegetable dish.
* Differences in values obtained just before consumption of the four test meal values were not statistically significant (Wilcoxon signed-ranks test with Bonferroni's correction).
† 1 μU/ml = 6·0 pmol/l.
Plasma glucose responses
The postprandial responses and the IAUC of plasma glucose after consumption of each meal are shown in Fig. 1 and Table 3.
Fig. 1 Mean postprandial changes (Δ) in plasma glucose concentrations in healthy men during a 180 min period after consumption of four test meals containing the same amount of boiled white rice with or without side dishes: S meal, staple food (![]() ); SM meal, staple food and main dish (
); SM meal, staple food and main dish (![]() ); SMF meal, staple food, main dish and fat-rich food item (
); SMF meal, staple food, main dish and fat-rich food item (![]() ); SMFV meal, staple food, main dish, fat-rich food item and vegetable dish (
); SMFV meal, staple food, main dish, fat-rich food item and vegetable dish (![]() ). Values are means, with their standard errors represented by vertical bars (n 9). * Mean values were significantly different from those obtained after SM meal consumption (P< 0·05). † Mean values were significantly different from those obtained after SMF meal consumption (P< 0·05; Wilcoxon signed-ranks test with Bonferroni's correction).
). Values are means, with their standard errors represented by vertical bars (n 9). * Mean values were significantly different from those obtained after SM meal consumption (P< 0·05). † Mean values were significantly different from those obtained after SMF meal consumption (P< 0·05; Wilcoxon signed-ranks test with Bonferroni's correction).
Table 3 Incremental AUC for plasma glucose, serum insulin, plasma total glucose-dependent insulinotropic polypeptide (GIP) and plasma intact glucagon-like peptide-1 (GLP-1) in healthy men after consumption of the four test meals containing the same amount of boiled white rice with or without side dishes (Mean values with their standard errors, n 9)
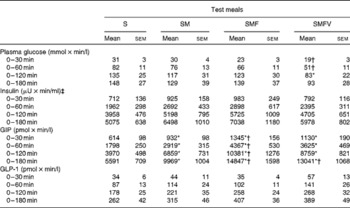
S, staple food; SM, staple food and main dish; SMF, staple food, main dish and fat-rich food item; SMFV, staple food, main dish, fat-rich food item and vegetable dish.
* Mean values were significantly different from those obtained after S meal consumption (P< 0·05; Wilcoxon signed-ranks test with Bonferroni's correction).
† Mean values were significantly different from those obtained after SM meal consumption (P< 0·05; Wilcoxon signed-ranks test with Bonferroni's correction).
‡ 1 μU/ml = 6·0 pmol/l.
Plasma glucose concentrations peaked at 30 min after consumption of all four test meals. At 30 min, the change in plasma glucose concentrations after SMFV meal consumption tended to be lower than that after S meal consumption (P= 0·077) and was significantly lower than that after SM meal consumption (P= 0·046). Thereafter, the change in plasma glucose concentrations after SMFV meal consumption remained low when compared with that after consumption of other test meals at 60 min and was significantly lower than that after SMF meal consumption at 120 min (P= 0·045).
IAUC for plasma glucose after SMFV meal consumption tended to be smaller at 0–30 min (P= 0·078) and 0–60 min (P= 0·090), being significantly smaller at 0–120 min (P= 0·046), than those after S meal consumption. In addition, IAUC for plasma glucose after SMFV meal consumption were also significantly smaller than those after SM meal consumption at 0–30 min and 0–60 min (both P= 0·046). At 0–180 min, the percentages of mean IAUC for plasma glucose after consumption of the SM, SMF and SMFV meals, against that after S meal consumption, were 87, 94 and 63 %, respectively.
Serum insulin responses
No significant differences were observed in the increases in postprandial responses or the IAUC for serum insulin after consumption of the four test meals (Fig. 2 and Table 3).
Fig. 2 Mean postprandial changes (Δ) in serum insulin concentrations in healthy men during a 180 min period after consumption of four test meals containing the same amount of boiled white rice with or without side dishes: S meal, staple food (![]() ); SM meal, staple food and main dish (
); SM meal, staple food and main dish (![]() ); SMF meal, staple food, main dish and fat-rich food item (
); SMF meal, staple food, main dish and fat-rich food item (![]() ); SMFV meal, staple food, main dish, fat-rich food item and vegetable dish (
); SMFV meal, staple food, main dish, fat-rich food item and vegetable dish (![]() ). Values are means, with their standard errors represented by vertical bars (n 9). For insulin, 1 μU/ml = 6·0 pmol/l.
). Values are means, with their standard errors represented by vertical bars (n 9). For insulin, 1 μU/ml = 6·0 pmol/l.
Plasma total glucose-dependent insulinotropic polypeptide responses
Postprandial plasma total GIP concentrations increased significantly after consumption of all four test meals when compared with those in the fasting state (Fig. 3). GIP concentrations peaked at 30 min after S meal consumption, but not until 60 min after consumption of the SM, SMF and SMFV meals. GIP concentrations gradually decreased with time, but were still higher than those in the fasting state even 180 min after meal consumption.
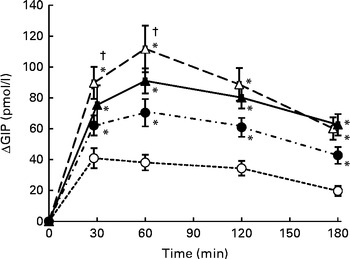
Fig. 3 Mean postprandial changes (Δ) in plasma total glucose-dependent insulinotropic polypeptide (GIP) concentrations in healthy men during a 180 min period after consumption of four test meals containing the same amount of boiled white rice with or without side dishes: S meal, staple food (![]() ); SM meal, staple food and main dish (
); SM meal, staple food and main dish (![]() ); SMF meal, staple food, main dish and fat-rich food item (
); SMF meal, staple food, main dish and fat-rich food item (![]() ); SMFV meal, staple food, main dish, fat-rich food item and vegetable dish (
); SMFV meal, staple food, main dish, fat-rich food item and vegetable dish (![]() ). Values are means, with their standard errors represented by vertical bars (n 9). * Mean values were significantly different from those obtained after S meal consumption (P< 0·05). † Mean values were significantly different from those obtained after SM meal consumption (P< 0·05; Wilcoxon signed-ranks test with Bonferroni's correction).
). Values are means, with their standard errors represented by vertical bars (n 9). * Mean values were significantly different from those obtained after S meal consumption (P< 0·05). † Mean values were significantly different from those obtained after SM meal consumption (P< 0·05; Wilcoxon signed-ranks test with Bonferroni's correction).
Changes in GIP concentrations after consumption of the SM, SMF and SMFV meals were larger than those after S meal consumption at all measurement time points (P= 0·046, respectively). Furthermore, changes in GIP concentrations after SMF meal consumption were larger than those after SM meal consumption at 30 min and 60 min (P= 0·046, respectively).
IAUC for GIP after consumption of the SM, SMF and SMFV meals were larger than those after S meal consumption, and those after SMF meal consumption were larger than those after SM meal consumption at all measurement time points (P= 0·046, respectively) (Table 3). Furthermore, IAUC for GIP after SMFV meal consumption was larger than that after SM meal consumption at 0–180 min (P= 0·046). No significant difference was observed after consumption of the SMF and SMFV meals. At 0-180 min, the percentages of mean IAUC for GIP after consumption of the SM, SMF and SMFV meals, against that after S meal consumption, were 178, 226 and 233 %, respectively.
Plasma intact glucagon-like peptide-1 responses
Postprandial plasma intact GLP-1 concentrations increased significantly after consumption of all four test meals when compared with those in the fasting state (Fig. 4). GLP-1 concentrations peaked at 30 min after consumption of the S, SM and SMFV meals, but peaked at 120 min after SMF meal consumption. At 120 min, changes in GLP-1 concentrations after SMF meal consumption tended to be larger than those after consumption of the S (P= 0·065) and SM (P= 0·091) meals. However, differences in IAUC for GLP-1 did not reach statistical significance (Table 3).
Fig. 4 Mean postprandial changes (Δ) in plasma intact glucagon-like peptide-1 (GLP-1) concentrations in healthy men during a 180 min period after consumption of four test meals containing the same amount of boiled white rice with or without side dishes: S meal, staple food (![]() ); SM meal, staple food and main dish (
); SM meal, staple food and main dish (![]() ); SMF meal, staple food, main dish and fat-rich food item (
); SMF meal, staple food, main dish and fat-rich food item (![]() ); SMFV meal, staple food, main dish, fat-rich food item and vegetable dish (
); SMFV meal, staple food, main dish, fat-rich food item and vegetable dish (![]() ). Values are means, with their standard errors represented by vertical bars (n 9).
). Values are means, with their standard errors represented by vertical bars (n 9).
Discussion
The co-ingestion of main dishes with white rice suppressed the postprandial glucose response when compared with the ingestion of white rice alone, despite the low-fat main dish and the moderate-fat main dish having extra energy contents of 619 kJ (148 kcal) and 983 kJ (235 kcal), respectively. Furthermore, addition of vegetable side dishes to a meal with a moderate-fat main dish may decrease the postprandial glucose response without excessively increasing insulin and GIP responses, when compared with meals consisting of only white rice and a main dish.
In the present study, consumption of boiled egg and tofu with white rice led to almost the same change in postprandial glucose concentrations, without a statistically significant increase in postprandial insulin concentrations, similar to the ingestion of white rice alone. Several studies have revealed that co-ingestion of protein in amounts of 60 %, or even more, relative to the amount of carbohydrate decreases the postprandial plasma glucose response concurrently with an increase in serum insulin concentrations when compared with the ingestion of carbohydrate-rich food alone( Reference Hätönen, Virtamo and Eriksson 13 , Reference Krezowski, Nuttall and Gannon 16 , Reference Westphal, Gannon and Nuttall 17 ). The small protein amount (13·1 g, 17 % to carbohydrate) may explain the lack of differences in postprandial glucose and insulin responses after consumption of the SM and S meals in the present study.
In earlier studies, the mechanisms underlying elevated insulin concentrations after co-ingestion of protein-rich foods were speculated to involve a direct effect of the ingested amino acids on β-cells or incretin. Nilsson et al. ( Reference Nilsson, Holst and Björck 18 ) reported whey-induced insulin secretion, which might occur not only via incretins but also due to increments in the concentrations of specific plasma amino acids. However, it has been pointed out that plasma amino acid responses after ingestion of the intact protein are lower in general than those after ingestion of amino acids or the protein hydrolysates( Reference van Loon, Saris and Verhagen 19 ). Furthermore, after consumption of protein-rich foods, the increase in the concentrations of amino acids in the circulation occurs reportedly later than the insulin response( Reference Krezowski, Nuttall and Gannon 16 ), and the mean gastric half-emptying time for egg protein has been reported to be 90 min( Reference Geboes, Bammens and Luypaerts 20 ). From these results, we speculate that the absorption of boiled egg and tofu would not provide enough amino acids to have influenced insulin secretion in the present study.
Earlier studies( Reference Hätönen, Virtamo and Eriksson 13 , Reference Krezowski, Nuttall and Gannon 16 , Reference Westphal, Gannon and Nuttall 17 ) focusing on protein-rich foods consumed on a daily basis did not measure incretin concentrations. While an effect of ingested purified protein on postprandial GIP release and insulin secretion has been reported, the results differed for GLP-1 responses( Reference Nilsson, Holst and Björck 18 , Reference Lan-Pidhainy and Wolever 21 , Reference Carr, Larsen and Winzell 22 ). The observed increase in the total GIP response after consumption of a main dish of recommended size was assumed to have contributed to elevating postprandial insulin concentrations in the present study. However, no association was observed between GIP and insulin concentrations. Carrel et al. ( Reference Carrel, Egli and Tran 23 ) documented that the fat, but not the protein, content of a mixed nutrient meal elicited a significant incretin effect. As the egg and tofu that we used for the main dish in the present study contained not only protein but also 9·2 g of fat, fat in the SM meal may have contributed to the postprandial glucose and incretin responses.
The consumption of high-fat foods (27·7–100 g) with carbohydrate-rich food (50 or 75 g of carbohydrate) has been reported to reduce the postprandial glucose response with no effect on the insulin response( Reference Collier and O'Dea 24 – Reference Maruyama, Kikuchi and Masuya 27 ). However, most of these studies have demonstrated the concentrations of both plasma GIP and GLP-1 to increase after ingestion of high-fat foods with carbohydrate-rich food( Reference Collier and O'Dea 24 – Reference Thomsen, Rasmussen and Lousen 26 ). To clarify the effect of additional fat in realistic amounts in a mixed meal, we added 9·4 g of fat to the SM meal; i.e. the SMF meal contained a total of 19·2 g of fat to approximately 75 g of carbohydrate. The small amount of added fat did not significantly decrease the postprandial glucose response or increase the postprandial insulin response, when compared with either the SM or the S meal. However, a remarkable increase in postprandial total GIP concentrations was observed. It is worth noting that postprandial total GIP concentrations were associated with a commensurate increase in the fat content of the meals, i.e. 0·6, 9·8 and 19·2 g in the S, SM and SMF meals, respectively. In an animal study, increasing the infusion of lipid has been found to result in dose-dependent secretion of total GIP and intact GLP-1 into lymph( Reference Yoder, Yang and Kindel 28 ). In the present study, despite the amount of additional fat being small, we found total GIP concentrations to be dose dependently increased in healthy subjects consuming meals of ordinary size.
In contrast to the GIP response, the intact GLP-1 response did not change significantly in response to the addition of fat in the present study, as was the case in prior studies( Reference Vollmer, Holst and Baller 8 , Reference Carrel, Egli and Tran 23 , Reference Yamane, Harada and Hamasaki 29 ). It has been suggested that differences in fatty acid compositions( Reference Thomsen, Rasmussen and Lousen 26 , Reference Robertson, Jackson and Fielding 30 ) are associated with changes in GLP-1 secretion, and types of proteins and amino acid compositions have also attracted attention for their roles in GLP-1 secretion( Reference Nilsson, Holst and Björck 18 , Reference Nilsson, Stenberg and Frid 31 ). However, Lan-Pidhainy & Wolever( Reference Lan-Pidhainy and Wolever 21 ) confirmed that postprandial intact GLP-1 concentrations do not increase with ingestion of a small amount of fat or a small amount of protein. One reason for the lack of a significant difference in GLP-1 responses reported herein is probably the smaller amount of fat and protein used in the present study compared with that used in earlier studies( Reference Lan-Pidhainy and Wolever 21 , Reference Carr, Larsen and Winzell 22 , Reference Collier and O'Dea 24 – Reference Thomsen, Rasmussen and Lousen 26 ).
The present results suggest that combining realistically sized shusai (main dishes) containing an optimal amount of protein and fat with white rice exerts a favourable effect on postprandial glucose responses despite the increased energy intake. Furthermore, the SMFV meal lowered the postprandial glucose response more than the meals without vegetables in the present study. Dietary fibre in the vegetable dish is probably another factor related to the inhibition of glucose absorption in the intestine. Soluble dietary fibre has been regarded as the meal component most likely to be therapeutically useful for modifying postprandial hyperglycaemia( Reference Papathanasopoulos and Camilleri 10 , Reference Jenkins, Goff and Leeds 32 ). However, very large amounts of fibre (10 g or more) were added to meals in studies in which postprandial glucose responses were found to be markedly reduced( Reference Weickert, Mohlig and Koebnick 33 – Reference Morgan, Tredger and Wright 35 ).
Many studies have focused on purified dietary fibre or fibre in grain products, and a few studies have focused on the effects of adding vegetables to carbohydrate-rich foods or a mixed meal on postprandial glucose responses( Reference Hätönen, Virtamo and Eriksson 13 , Reference Gustafsson, Asp and Hagander 36 ). Gustafsson et al. ( Reference Gustafsson, Asp and Hagander 36 ) reported a decreased postprandial glucose response with the addition of 250 g of spinach containing 7·2 g of total dietary fibre to a mixed meal containing 59 g of carbohydrate. However, in the present study, the addition of a 120 g vegetable dish containing 4·4 g of total dietary fibre and 0·9 g of soluble dietary fibre to the meal consisting of approximately 75 g of carbohydrate (SMFV meal) resulted in a decreased glucose response when compared with the meal without a vegetable dish (SMF meal). It is worth noting that the glucose-lowering effect without an increase in insulin concentrations was observed with a relatively small amount of dietary fibre derived from a vegetable serving that was more realistic than those used in former studies examining dietary fibre( Reference Weickert, Mohlig and Koebnick 33 – Reference Gustafsson, Asp and Hagander 36 ). Thus, the decreased postprandial glucose response after SMFV meal consumption might be attributable not only to a direct effect of the dietary fibre derived from vegetables but also to an effect of the concurrent fat consumption. An earlier study also showed that the addition of 1·7 g of psyllium alone to pasta did not decrease the postprandial glucose response and that the addition of 1·7 g of psyllium, 30 g of fat and 3 g of sodium propionate to pasta decreased the postprandial glucose response significantly when compared with pasta alone( Reference Frost, Brynes and Dhillo 37 ). The present results obtained using ordinary food with a small amount of fat and adequate dietary fibre are consistent with those of the prior study.
This is the first study to examine the effect of adding vegetables on the incretin response. Studies on the postprandial incretin response to purified dietary fibre or fibre in grain products have yielded inconsistent results( Reference Weickert, Mohlig and Koebnick 33 – Reference Morgan, Tredger and Wright 35 , Reference Frost, Brynes and Dhillo 37 – Reference Karhunen, Juvonen and Flander 41 ). The administration of α-glucosidase inhibitors has reportedly been shown to suppress postprandial GIP secretion and enhance postprandial GLP-1 secretion, by shifting the absorption of monosaccharides from the upper small intestine to the lower small intestine( Reference Göke, Fuder and Wieckhorst 42 – Reference Lee, Patrick and Wishart 44 ). In the present study, the addition of a vegetable dish of ordinary size to the meal with a moderate-fat main dish (SMFV meal) changed neither GIP nor GLP-1 responses when compared with the meal without a vegetable dish (SMF meal). Thus, vegetable intake in ordinary amounts cannot be expected to enhance incretin secretion. In other words, vegetable intake did not lead to a further increase in GIP response, which tends to promote obesity( Reference Seino, Fukushima and Yabe 6 ).
The present study has limitations. We measured total GIP concentrations, because a commercially available assay for intact GIP was not available at the time of the present study. As dipeptidyl peptidase-4 activity is reportedly inhibited by some types of peptides( Reference Tulipano, Sibilia and Caroli 45 ) and varies depending on nutrients( Reference Gunnarsson, Winzell and Deacon 46 ), intact GIP concentrations should be measured to reveal the influence of ingesting different meals. We did not examine factors related to gastric emptying, nutrient absorption, insulin receptor activation or glucose utilisation. Therefore, the mechanisms underlying the glucose-lowering effects of side dish co-ingestion observed in the present study could not be determined. Further study is needed to assess the effects of different amounts as well as other types and combinations of foods. However, as no prior study has examined changes in postprandial glucose, insulin, GIP and GLP-1 responses with combinations of dishes generally consumed in ordinary meals, the present study is potentially useful for designing dietary therapy for patients with diabetes. Diets with low glycaemic index and load are considered to be beneficial for improving glycaemic control( 1 , Reference Bantle, Wylie-Rosett and Albright 47 ). The present results suggest that, from the perspective of clinical management, the consumption patterns and meal content are as important for achieving postprandial glycaemic control as the carbohydrate source consumed with the meal.
In conclusion, the present study was designed to evaluate the effects of consuming recommended amounts of shusai (main dish) and/or fukusai (vegetable side dishes) with boiled white rice (shushoku) in the same meal on postprandial glucose, insulin, GIP and GLP-1 responses. The present results demonstrate the combination of main dishes containing a moderate amount of fat and vegetable dishes with boiled white rice to be beneficial for lowering postprandial glucose concentrations, without excessive increases in insulin and GIP responses, despite the greater energy intake than that with consumption of white rice alone. This finding is potentially useful for clarifying the mechanisms by which recommended combination dishes work in patients with diabetes.
Acknowledgements
The authors are grateful to the volunteers for participating in the study. They also thank Yukiko Arai, Makiko Hikichi and Karen Miwa for their help with the test meal loading.
Mayonnaise and frozen vegetables were provided by Kewpie Corporation, Tokyo, Japan. Kewpie Corporation had no role in the design and analysis of the study or in the writing of this article.
The authors' contributions are as follows: N. K. and C. M. designed the study and wrote the article; N. K., C. M., S. M., R. A. and T. M. conducted the study; N. K. performed plasma GIP measurements and conducted the statistical analyses; Y. Y. provided advice on incretin measurements; C. M. had primary responsibility for the final content; all authors read and approved the final manuscript.
None of the authors has any conflicts of interest to declare.


