


An adequate and balanced food intake is important for the maintenance of health, especially in the period of growth. In a recent study, a lower prevalence of the metabolic syndrome (defined as having three or more of the conditions waist circumference ≥ 90th percentile for age/sex, fasting blood glucose ≥ 1000 mg/l, blood TAG ≥ 1100 mg/l, HDL-cholesterol ≤ 350 mg/l, and systolic/diastolic blood pressure ≥ 90th percentile for height or taking antihypertensive drugs) has been observed among US adolescents with higher overall dietary quality(Reference Pan and Pratt1). Since consumers face an increasing range of available foods and convenience foods in particular, the human diet changes and becomes more and more complex. Individuals consume foods in combination but not single foods or nutrients. Therefore, analysing single foods or nutrients in relation to health outcomes does not reflect the complexity of the human diet. Many nutrients interact and intercorrelate and the combined effects of these interactions are important for health outcomes, for example, for blood pressure(Reference Couch and Daniels2). Furthermore, the adverse or beneficial effect of a single nutrient may be too small to detect(Reference Hu3). Therefore, judgment about the ‘healthiness’ of a diet should be based on the entire food pattern. For many epidemiological questions an overall indicator of healthy nutrition would be useful. Several attempts to summarise the comprehensive information of dietary behaviour or food intake have been proposed(Reference Haines4–Reference Drescher, Thiele and Mensink14). Some of these approaches focus on the diet quality of children and adolescents(Reference Serra-Majem, Ribas and Ngo10, Reference Feskanich, Rockett and Colditz11, Reference Kranz, Hartmann and Siega-Riz13); others on a cross-national comparison among adults(Reference Kim, Haines and Siega-Riz8). An overview of the various constructed indexes is given by Kant(Reference Kant15) and Waijers et al. (Reference Waijers, Feskens and Ocké16). Often estimates of nutrient intakes are used. However, indexes based on food consumption or numbers of servings were also constructed. Kant(Reference Kant15) mentions that there are three main approaches reported in the literature: indexes based on nutrients, indexes based on foods and food groups, and indexes based on a combination of those.
Recently, the comprehensive German Health Interview and Examination Survey for Children and Adolescents (KiGGS) was conducted. This representative survey includes a new designed FFQ(Reference Mensink and Burger17). Based on the data from this FFQ we developed a nutrition score based on comparisons with current food recommendations for children and adolescents.
Methods
Study design and study population
From May 2003 to May 2006, a total of 17 641 children and adolescents aged 0–17 years participated in KiGGS. The sample was drawn with a two-stage clustered and stratified sampling procedure. In the first stage, 167 sample points representative for German communities were selected with regard to community size and federal state. In the second stage, for every age, almost the same number of participants was randomly selected from the population registries. The study was approved by the Federal Office for Data Protection and the Charité-Universitätsmedizin Berlin ethics committee. Participants aged 14 years and over all parents provided written informed consent before the interview and examination. The overall response rate was 66·6 %. The design, methods and response analyses are described in detail elsewhere(Reference Kurth, Kamtsiuris and Hoelling18).
The present analysis is based on 7186 boys and 6919 girls aged 3–17 years for whom complete data on food intake were available. We did not consider children under the age of 3 years (n 2805) because they may have fast-changing dietary patterns and consume baby foods (for example, infant formula, jars, purées). Jars and purées often contain different food groups (for example, meat as well as vegetables). These items would need a special questionnaire to assess them appropriately. However, this is not covered in the FFQ. Furthermore, 731 participants had incomplete food-frequency data. For the comparison with biochemical parameters, additionally 1471 participants were excluded because blood samples were not available. In addition, there are specific missing values for the blood parameters, resulting from a varying number of parameters available.
Data collection and operationalising of socio-demographic variables
Parents of all participants and participants aged 11 years or older were asked to fill in age group-specific self-administered questionnaires. These included questions on socio-demographic characteristics, immigration background, living conditions, health and health-related behaviour. In addition, participants underwent a computer-assisted medical interview and a physical examination conducted by trained staff. Casual blood and urine samples were obtained and the number of hours since the last food intake was documented(Reference Kurth, Kamtsiuris and Hoelling18).
Information on parents' income, occupational status and education background was used to construct an index for socio-economic status (SES), which was then categorised into low, middle and high SES(Reference Lange, Kamtsiuris and Lange19). The participants' main residence was assessed and categorised into former West or East Germany. The degree of urbanisation was grouped into five categories: rural (under 5000 inhabitants), small town (from 5000 to under 20 000 inhabitants), middle-sized town (from 20 000 to under 100 000 inhabitants) and urban (100 000 inhabitants and more). Using information on nationality, country of birth, language spoken at home etc, an immigration background was assumed under the following conditions: the participants themselves immigrated to Germany; at least one parent was not born in Germany; both parents immigrated to Germany or had no German nationality(Reference Schenk, Ellert and Neuhauser20). Due to the large number of children and adolescents of either Turkish or Russian German (German resettlers from Russia) descent, we further characterised participants with an immigration background as Turkish, Russian German, other immigrant (other than Turkish or Russian) or non-immigrant (German).
Dietary assessment und nutritional score construction
The self-administrative semi-quantitative FFQ was developed based on an adult version. Several institutes with experience in children's dietary assessment were consulted to expand the items to the most relevant food groups for children and adolescents(Reference Alexy, Sichert-Hellert and Kersting21). The FFQ was initially integrated in the general health questionnaire which was pretested among 1630 children and adolescents in 2001 to 2002. After this study it was decided to separate the FFQ from the general health questionnaire. The design of the FFQ was adopted according to criteria of the US National Institutes of Health diet history questionnaire(Reference Subar, Thompson and Kipnis22). The FFQ has not been validated yet. However, in a second pilot study among seventeen parents of younger children and eleven adolescents the questionnaire was tested including a cognitive debriefing. The questionnaire, in conclusion, was very well understood by the respondents and the duration of completion was acceptable (about 15–20 min). The development of the FFQ is described in detail elsewhere(Reference Mensink and Burger17).
In KiGGS, the self-administered semi-quantitative FFQ covering fifty-four food items was sent by postal mail several weeks before the interview and examination visit. Parents of children aged 1–10 years and participants aged 11–17 years were asked to complete the FFQ and to return it on the examination visit. During the survey period a telephone hotline was offered for any support in completing the questionnaire. In the study centre, the FFQ were checked for completeness. For forty-five of the fifty-four food items covered, the FFQ asked the average food frequency in ‘the last few weeks’ as well as the average consumed portion size. The remaining nine food items cover habits such as general consumption of supplements, fortified foods, light products, convenience food and probiotic products. Categories for frequencies were identical for all food items: never; once per month; 2–3 times per month; 1–2 times per week; 3–4 times per week; 5–6 times per week; once per d; 2–3 times per d; 4–5 times per d; more than 5 times per d. Food-specific portion sizes were given often with illustrations or standard household measures (cups, spoons, etc) always with five categories which were equal for all ages.
For the Healthy Nutrition Score for Kids and Youth (HuSKY), information regarding food frequencies was recoded into times of servings per month (where 1 month was set equal to 4 weeks, for example, once per week = 4, once per d = 28, more than five times per d = 168). For frequency bands such as one or two times per d the arithmetic mean was used. Portion sizes were converted into g amounts using the given standard portion sizes in the FFQ. The average food intake (I) was then calculated by multiplication of recoded frequency and portion size (intake (I) = food frequency × portion size (g)).
Not all of the reported foods were included in the score because some foods were not mentioned in the dietary guidelines for an optimised mixed diet (OMD) for children and adolescents(Reference Kersting, Alexy and Clausen23, 24). Furthermore, some FFQ items could not be allocated to a specific food group of the OMD recommendations or had a low variation in consumption and would therefore not contribute to the variation of the score. Thus, thirty-eight food items were aggregated into eleven food groups corresponding to the food groups issued in the OMD guidelines which include recommended food intakes in g per time unit (Appendix 1). The food groups are beverages, fruit, vegetables, pasta/rice/potatoes, bread/cereals (food groups for which a high consumption is recommended); milk/dairy products, eggs, meat, fish (moderate consumption is recommended); fats, sweets/fatty snacks/sugar-rich soft drinks (sparing consumption is recommended). For every food group the observed intake was then related to the OMD recommendations by calculating the ratio (I/R)x = intake (I) of food group x/recommendation (R) for food group x. For this comparison, observed food intake in the numerator was expressed in the same units as in the OMD recommendations (for example, fruit (g/d), fish (g/week), eggs in pieces per week, sweets, fatty snacks, and soft drinks in portions per d). Next, the ratio (I/R)x was allocated with points, relating to the age- and sex-specific percentage recommended intake of the single food group ((I/R)x → scorex) and considering the three basic OMD messages for food consumption(Reference Kersting, Alexy and Clausen23). The single components and scoring are shown in Table 1.
Table 1 Components and assessment of the Healthy Nutrition Score for Kids and Youth (HuSKY)

I/R, intake (I)/age- and sex-specific recommendation (R) ratio for the food group.
* Only the meat content from the FFQ item ‘fast food’ was considered here.
† This FFQ item includes curry sausage, fried sausage, hamburger, doner kebab.
For most food groups (except meat, fats, sweets/fatty snacks/sugar-rich soft drinks) an intake below the recommendation was assessed proportionally (for example, if a participant consumed 70 % of the daily recommend consumption, 70 points were given).
For beverages, fruit, vegetables, and fish, 100 points were given if the participant reached or exceeded the recommended intake (implementation of the recommendation to 100 %). For fish (as an animal product) moderate intake is recommended. Since the overall fish consumption in Germany is low and fish can be classified as a favourable food, it is assessed in analogy to beverages, fruit, and vegetables.
For the food groups pasta/rice/potatoes and bread/cereals, full points (100) were given if the intake reached or exceeded the recommendation up to the double recommended amount. When more than twice as recommended was consumed, points were proportionally subtracted from 100, because of the potential high energy contribution (for example, if a participant consumed 230 % of recommended amount, 70 points were given).
For the food groups eggs and milk/dairy products, points were proportionally subtracted from 100 when a participant exceeded the recommended intake.
If the intake of meat, fats, and sweets/fatty snacks/sugar-rich soft drinks was below or equal to the tolerable consumption, 100 points were given. If it exceeded the recommendation, points were proportionally subtracted from 100, since intakes above the recommendation level for these foods are considered unfavourable.
Finally, the single points were added together and standardised to a scale from zero to 100 (HuSKY = Σscorex/number of scorex). A higher score value implies a better overall dietary quality.
For the score calculations, missing values in the FFQ were handled as follows. If the food frequency was available but information on portion size was missing, the middle category of portion size presented in the FFQ (which predominantly reflected the age- and sex-specific mode) was imputed. If both the food frequency and the portion size were missing, the food item was considered to be not consumed (amount zero). If no food frequency but a portion size was given, the food item was considered as a missing value. Total energy intake was calculated summarising the specific products of amount and mean energy contents of the FFQ items.
Since experts recommend constructing a food-based instead of a nutrient-based index to consider the diet as a whole, as well as to take into account current recommendations, and to consider diet variety(Reference Waijers, Feskens and Ocké16, Reference Waijers and Ocké25), we decided to construct the score as described above, which appears to be the best way within the bounds of possibility of the data available.
Laboratory assays
Casual venous blood samples were obtained from participants aged 1 year and older, only if the accompanying parent or caregiver provided consent. Serum was separated and transported by car on dry ice to a central laboratory according to a highly standardised protocol(Reference Thierfelder, Dortschy and Hintzpeter26). Samples were kept at − 50°C until analysed. Vitamin B12 and folate were analysed using electrochemiluminescence-immunoassay. During the survey, the manufacturer (Roche, Mannheim, Germany) changed the method for measuring folate. Therefore, separate analyses for both periods were performed. Homocysteine was measured with fluorescent particle immunoassay (Abbott, Wiesbaden, Germany). Fe (ferritin) was analysed using electrochemi luminescence immunoassay. Ca was measured with the ortho-cresol phthalein-complexon method (Roche). For the analysis of Mg the xylidyl blue assay (Roche) was used(Reference Kurth, Kamtsiuris and Hoelling18, Reference Thierfelder, Dortschy and Hintzpeter26). In the first year of the survey, serum 25-hydroxyvitamin D (25(OH)D) was measured by enzyme immunoassay. However, quality assessment revealed stability problems requiring a change in the method, and a LIAISON chemiluminescence immunoassay (CLIA; DiaSorin Inc., Stillwater, MN, USA) was chosen. In the present analysis we only use the measurements based on CLIA, which were obtained during the second and third year of the survey(Reference Hintzpeter, Scheidt-Nave and Müller27).
Statistical analysis
Since the sample is based on a clustered and stratified design, all analyses (except the partial correlation analysis) were performed with the complex sample procedures of SPSS 14.0 (SPSS, Inc., Chicago, IL, USA)(28). Arithmetic means of the HuSKY with 95 % CI were calculated and univariable linear regression models were used to detect statistically significant differences. A multiple linear regression model was implemented to analyse determinants of dietary behaviour with the HuSKY as the dependent variable. In this model, we included age, sex, total energy intake, SES, immigration background, residence in West or East Germany, and grade of urbanisation (rural, small town, middle-sized town, urban) as independent variables. In order to investigate the association between the HuSKY and selected biochemical measures associated with a healthy, well-balanced diet and available from the KiGGS study (serum concentrations of Fe, Ca, Mg, 25(OH)D, vitamin B12, folate and homocysteine), partial Pearson's correlation coefficients (adjusted for age, sex and total energy intake, and additionally season for 25(OH)D) were calculated. To enhance the representativeness of the sample, all statistical analyses were weighted. The weighting factor for each participant was calculated in two steps. In the first step, adjustment for the sampling design was made. In the second step, the deviations between the net sample and actual German population structure in terms of age, sex, residence in West or East Germany, and nationality based on 31 December 2004 were corrected. The weighting scheme is described in more detail elsewhere(Reference Kamtsiuris, Lange and Schaffrath Rosario29). All tests were performed two-sided and a P value less than 0·05 was considered to indicate statistical significance.
Results
HuSKY score values followed a normal distribution. The overall weighted mean of the HuSKY was 55 with a minimum of 20 and a maximum of 94 points. The interquartile range extended from 48 to 63 (Fig. 1). Table 2 shows the crude mean values of the HuSKY by socio-demographic characteristics. Younger participants had a higher (better) average score than older ones. Average scores were also higher among girls (56·4 (95 % CI 56·0, 56·8)) than boys (54·5 (95 % CI 54·1, 54·8)). Children and adolescents with a high SES had a better score than participants with a middle or low SES. Children and adolescents without an immigration background scored higher than those from immigrant families. Among immigrants, Russian Germans had the lowest score value on average. Furthermore, participants from former East Germany had significantly better mean score values than those from the Western part. Participants living in a rural region or small town had a lower average score value than those living in an urban region. All these findings are statistically significant. No statistically significant association was observed with regard to BMI adjusted for age and sex (data not shown).
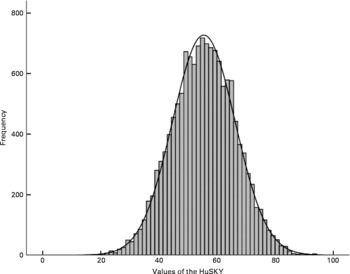
Fig. 1 Histogram of the Healthy Nutrition Score for Kids and Youth (HuSKY). HuSKY values are as follows: mean, 55·4; sd, 11·0; sem, 0·09; median, 55·5; 10th percentile, 41·1; 25th percentile, 47·9; 75th percentile, 63·1; 90th percentile, 69·6; minimum, 19·9; maximum, 94·0.
Table 2 Mean Healthy Nutrition Score for Kids and Youth (HuSKY) values by socio-demographic variables
(Mean values and 95 % confidence intervals)
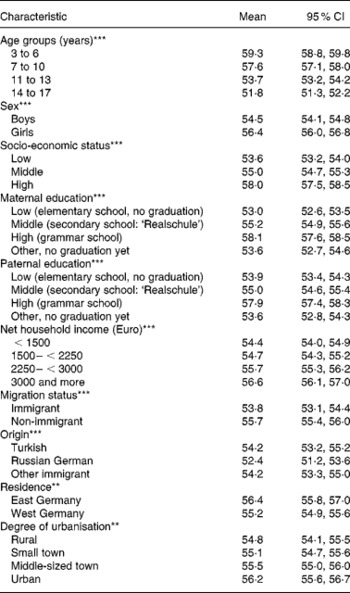
Significance from univariable linear regression model: ** P ≤ 0·01, *** P ≤ 0·001.
The results of the multiple linear regression analysis are summarised in Table 3. A lower (less favourable) HuSKY was independently and significantly associated with an increasing age, male sex, a lower SES, having an immigration background (in particular immigration from Russia), residence in former West v. East Germany, and residence in less urbanised areas. The crude Pearson's correlation coefficients showed a statistically significant association between the HuSKY and serum concentrations of Fe (r − 0·054; P < 0·001), Mg (r 0·036; P < 0·001), vitamin B12 (r 0·147; P < 0·001), folate (r 1 0·108, P < 0·001; r 2 0·126, P < 0·001) and homocysteine (r − 0·197; P < 0·001). There was no statistically significant association with Ca and 25(OH)D. After adjusting for age and sex, only positive correlations between the HuSKY and folate (r 1 0·066, P < 0·001; r 2 0·063, P < 0·001) and a negative correlation with homocysteine (r − 0·066; P < 0·001) remained statistically significant (Table 4). Additionally adjusting for energy intake only marginally changed these results.
Table 3 Determinants of the Healthy Nutrition Score for Kids and Youth (HuSKY): results of the linear regression analysis
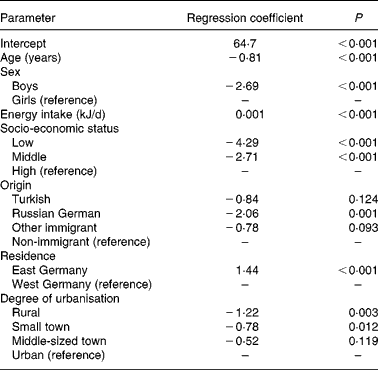
R 2 0·126.
Table 4 Correlation between the Healthy Nutrition Score for Kids and Youth (HuSKY) and nutritional related biomarkers from laboratory analysis*
(Crude and partial Pearson's correlation coefficients)
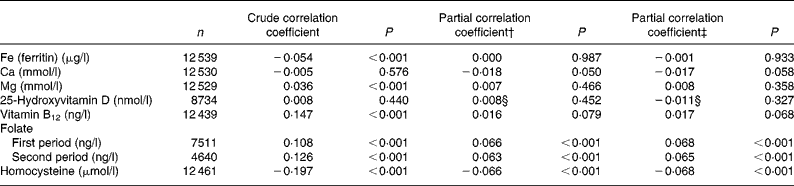
* Unweighted n, children under 3 years, and participants with no valid FFQ and no blood samples were excluded.
† Adjusted for age and sex.
‡ Adjusted for age, sex and energy intake.
§ Additionally adjusted for season (winter, November–April; summer, May–October).
Discussion
National and international food-based dietary guidelines recommend a balanced diet with a high consumption of fruit, vegetables and cereals(24, 30–32). The HuSKY offers a valuable instrument to evaluate overall eating habits in a population. We observed independent and statistically significant relationships between the HuSKY and age, sex, SES, immigration background, level of urbanisation and residence in former East v. former West Germany. Most of the observed associations were in the expected direction: a better overall dietary behaviour was related to a younger age, female sex, higher SES and higher degree of urbanisation. On the other hand, a higher or better HuSKY was present among participants with main residence in former East than West Germany. The HuSKY showed no significant association with BMI. However, it was significantly related to several biochemical measurements, including serum concentrations of homocysteine (inverse association) and serum concentrations of folate (positive associations).
As observed in the present study for the HuSKY, Serra-Majem et al. observed the highest (best) score value of a diet quality index for children and adolescents in cities and in the group with the highest SES(Reference Serra-Majem, Ribas and Ngo10). Results from cross-sectional studies of the relationship between relative body weight and dietary indices have been generally conflicting. Feskanich et al. reported a weak unadjusted association between a dietary index and BMI among children and adolescents(Reference Feskanich, Rockett and Colditz11). In contrast, there was no significant association between a dietary index and BMI in the Kiel Obesity Prevention Study(Reference Danielzik, Czerwinski-Mast and Langnäse33) or between the HuSKY and BMI in the present analysis. The latter purpose would also have to include additional information on long-term eating habits, as well as energy expenditure and energy intake which was not gathered in KiGGS. Obesity often develops gradually, and the process is very complex and influenced by many factors. The HuSKY was constructed to capture ‘healthy eating habits’ and to reflect the agreement with the recommendations. However, preventing obesity is not the primary objective of those recommendations. For the development of obesity a long-term positive energy balance is crucial (rather than an unhealthy food pattern). However, this cannot be measured using a FFQ in a cross-sectional setting like ours. In addition, cross-sectional analyses of relative body weight and dietary habits are prone to bias due to systematic under-reporting, in particular of fatty foods among individuals with weight problems(Reference Heitmann and Lissner34), as well as higher probability of dieting. We also cannot rule out bias resulting from missing observations. However, considering missing values in FFQ as non-consumption is an acceptable method(Reference Willet35).
Most previous studies of nutritional indexes used biochemical parameters to validate their construct(Reference Weinstein, Vogt and Gerrior36, Reference Hann, Rock and King37). Others also considered nutrient intake(Reference Drescher, Thiele and Mensink14, Reference Newby, Hu and Rimm38). However, as information on nutrient intake is often based on the same instrument used for constructing the indexes, this approach has methodical limitations. The HuSKY showed a significant and independent correlation with serum concentrations of folate and homocysteine. There was a crude positive association between the HuSKY and vitamin B12 as well as a negative association with Fe. The latter could be explained by the strong correlation of Fe intake and meat consumption, since high meat consumption contributed to a lower score. The correlation coefficients in our analysis were very small as may be expected among young individuals. However, the strengths of the associations are comparable with those from other investigations(Reference Weinstein, Vogt and Gerrior36). There were no data on the status of vitamin C, fibre or nutrient intake available in KiGGS, so that our validation is limited at the current stage. An explanation why there was no association with 25(OH)D could be that sunlight exposure has a much higher impact on 25(OH)D status than food intake, even among children and adolescents. The overall contribution of diet on 25(OH)D status is rather small and there is only a small inter-individual variability(Reference Hintzpeter, Scheidt-Nave and Müller27).
The construction of a healthy nutrition score appears to be useful for several reasons. With the usual methods of collecting dietary data, an abundance of information on single food items is gathered. Our score can be used to summarise this information to a single measure for an overall impression of dietary behaviour of individuals or groups. This can be useful to detect certain risk groups. Furthermore, the score can be used to compare subgroups or to observe behavioural trends. If the focus of interest is another exposure than dietary behaviour, the score may be used in multivariate statistical models to control for the overall dietary behaviour as a potential confounder.
In this context and for special questions it could be beneficial to adapt the score by using only a partial aspect, for example, to reflect a fat- and sugar-rich diet. For example, we observed a weak but significant positive association between the intake of fruit and vegetables and folate status (crude: r 0·024 (P < 0·001) and r 0·028 (P < 0·001); age- and sex-adjusted: r 0·038 (P = 0·001) and r 0·038 (P = 0·008); age-, sex- and energy intake-adjusted: r 0·046 (P < 0·001) and r 0·045 (P = 0·002) for the first and second period, respectively) as well as a positive association between the intake of meat and Fe status (crude: r 0·149 (P < 0·001); age- and sex-adjusted: r 0·097 (P < 0·001); age-, sex- and energy intake-adjusted: r 0·102 (P < 0·001)). However, in the HuSKY a high consumption of meat reduces the score and this partially causes the negative association with Fe status. As we intend to follow KiGGS participants for health outcomes, spin-off scores of the HuSKY may be developed in the future. Gao et al. (Reference Gao, Beresford and Frank39) modified the healthy eating index by incorporating the energy needs specified in the current Dietary Guidelines for Americans. Those changes appear to better predict obesity outcomes in a longitudinal multi-ethnic study(Reference Gao, Beresford and Frank39).
The presented score based on data of the KiGGS FFQ is not apt to assess specific aspects of dietary behaviour in detail. All index approaches are subjective and limited by current knowledge, the selection of components, assessment methods and available information(Reference Hu3). For instance, it is a subjective decision that all food groups are weighted equally in the HuSKY. However, a decision for different weights still would be subjective. The judgment of the relationship between intake and recommendation is based on three basic messages of the OMD recommendations to consume beverages and plants in high amounts, animal foods moderately and high-fat, high-sugar foods sparingly(Reference Kersting, Alexy and Clausen23). However, the entire interpretation of the OMD recommendations remains subjective to a certain extent. Even with an explorative approach, such as cluster or factor analysis, subjective decisions have to be made. Furthermore, portion size options in the FFQ are similar for every age group. This was a conscious decision because with the same portion size options for all ages, a standardised instrument is available and this is more appropriate to compare different age groups. Since the lowest category for portion size always reflects very small portions there is a wide spectrum to estimate the consumed portion size. In addition, the allocation of scoring points of the HuSKY is dependent on age and sex. It is also observed in a previous study that individual portion size adds limited information on variance in food intake(Reference Noethlings, Hoffmann and Bergmann40). Furthermore, preparation methods and specific fat contents are not considered in the HuSKY. For some FFQ items there was the opportunity to address preparation methods or fat levels. However, they are not specified in detail in the OMD recommendations. Since in the FFQ preparation methods and fat levels were asked categorical this information was not apt for adequate quantification in relation to the amounts consumed.
We constructed several preliminary versions of the index with nearly identical results. For example, there is only a marginal change among all estimators and CI, when points are not subtracted during the assessment of carbohydrate-rich foods such as pasta/rice/potatoes. This indicates the robustness of the algorithm chosen and lends credence to the observed associations between the HuSKY and other health-related parameters. Some experts argue that it is not possible to develop a complex index to assess dietary quality objectively and validly(Reference Waijers and Ocké25). They recommend developing an instrument which takes into account the ‘extent to which intake of several dietary components meets recommendations’. Waijers et al. (Reference Waijers, Feskens and Ocké16) formulated further recommendations for the general index construction: the index scores should be adjusted for energy intake, the index should be food based instead of nutrient based because of the idea of considering the diet as a whole, it should be taken into account that diet is culturally determined, diet variety should be considered, it may be preferable to design scoring ranges instead of simple cut-off points, and there should be a relative contribution of the individual index components to the total score. Our score meets most of these recommendations. Adjusting for total energy intake reduced the strength of some (for example, age, sex, SES) but not all (for example, immigration background) of the observed associations between the HuSKY and socio-demographic variables. However, the overall results did not change with only marginal changes to the 95 % CI.
In conclusion, the construction of a healthy nutrition score appears to be useful for several reasons. For instance, the HuSKY can be used to summarise an abundance of dietary information to a single measure, to get an overall impression of diets of individuals or groups, which can be useful to detect certain risk groups. The HuSKY is independently and statistically significantly associated with age, sex, SES, immigration background, level of urbanisation, and residence in former East v. former West Germany. Furthermore, the HuSKY is related to serum concentrations of homocysteine (inverse association) and folate (positive associations).
Acknowledgements
KiGGS was funded by the German Federal Ministry of Health, the German Federal Ministry of Education and Research (grant number 01EH0201) and the Robert Koch Institute.
C. K. and G. B. M. M. had the idea for the paper. C. K. performed the statistical analyses, interpreted the results and wrote the manuscript. G. B. M. M. contributed to the interpretation of data and revision of the manuscript. C. S. N. and B. M. K. revised the manuscript critically.
None of the authors had any conflict of interest.
Appendix 1 Optimised mixed diet (OMD) recommendation*
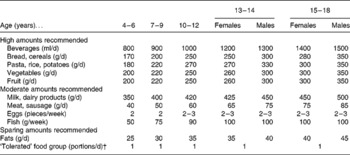
* Modified based on the OMD recommendation(24).
† This food groups includes high-sugar high-fat foods such as sweets, fatty snacks and soft drinks. In the OMD recommendations, this food group should contribute to a maximum of 10 % of total energy intake per d.


