


1. Introduction
In this study, we conduct a cost-effectiveness analysis of recent regulations issued by the Office of Air and Radiation of the U.S. Environmental Protection Agency (EPA). These regulations will reduce exposures to airborne concentrations of fine particles and other pollutants, reducing the risk of morbidity and premature mortality, and providing other benefits, such as improved visibility. The economic effect of such regulations is significant. Regulations issued exclusively by the EPA account for 63%–82% of the total monetized benefits of all federal regulations, and 45%–56% of their total costs, with regulations having a primary or significant goal to improve air quality accounting for 98%–99% of these benefits (Office of Management and Budget, 2014).
The cost and consequences of regulations that reduce mortality risks, including those targeting air pollution, have drawn the attention of academic researchers, policy makers, and stakeholders.Footnote 1 Two issues have been considered. The first is whether lifesaving regulations allocate resources cost-effectively.Footnote 2 A second question concerns the effects of exposures to fine particulate matter on mortality risks, and whether these uncertainties are adequately reflected in regulatory benefit estimates.Footnote 3 Reducing exposures to fine particulate matter often account for more than 90% of the monetized benefits of EPA’s air regulations (Office of Management and Budget, 2014).
The second question has been the subject of an enormous literature, the implications of which will be discussed in a later section of the article that presents an uncertainty analysis of the mortality risk reductions associated with air regulations.Footnote 4 The first question has been addressed by a more limited literature which is useful to review here. In this regard, a study by John Morrall computed the cost-effectiveness of 76 federal regulations promulgated from 1967 to 2001, measured as net resource cost per statistical life saved (Morrall, Reference Morrall2003). The numerator of this ratio subtracts from compliance costs all of the benefits other than those related to mortality risk. Using this measure, a break-even ratio is defined at which the net resource cost of the regulation is equal to the value of a statistical life (VSL) it saves.Footnote 5 Cost-effectiveness ratios beneath this threshold will yield benefits greater than their costs. A “health–health” cutoff point is also identified. This is a cost-effectiveness ratio at which the regulation has no effect on aggregate mortality risks, owing to the opportunity cost of the resources the regulation diverts from other risk-reducing alternatives (see Lutter, Morrall & Viscusi, Reference Lutter, Morrall and Viscusi1999). Regulations with cost-effectiveness ratios beneath this threshold will reduce mortality risks in society, on net. It turns out that 58% of the rules had a net cost per statistical life saved less than the VSL, giving positive net benefits, while 65% of the rules passed the health–health test, yielding societal mortality risk reductions, on net. There is wide variation in the cost-effectiveness ratios of the regulations, with a six order of magnitude difference between the minimum and maximum.
Tengs et al. (Reference Tengs, Adams, Pliskin, Safran, Siegel, Weinstein and Graham1995) conducted a cost-effectiveness analysis of 500 private and public interventions reducing the risk of premature mortality. They used a net resource cost measure in the numerator, but statistical life years rather than lives saved in the denominator.Footnote 6 Although the cost-effectiveness metric and sample used in Tengs et al. (Reference Tengs, Adams, Pliskin, Safran, Siegel, Weinstein and Graham1995) differed from that in Morrall (Reference Morrall2003), the results were broadly consistent. Again, there were significant differences in cost-effectiveness among different interventions. In 2013 dollars, the median net cost per statistical life year saved was $61,981; with the median for medical interventions at $28,039 and those for toxin control of $4.1 million.Footnote 7 These discrepancies, and those found in Morrall (Reference Morrall2003), are likely to be partially explained by the lumpy non-continuous nature of some of the investment options (making it difficult to equate incremental costs at the margin). But the magnitude of the differences are also likely to indicate significant inefficiencies in resource allocation (Tengs & Graham, Reference Tengs and Graham1996).
There has been limited cost-effectiveness analysis of regulations using the “quality-adjusted life year” (QALY) outcome measure commonly used in the health evaluation literature (Drummond, O’Brien, Stoddart & Torrance, Reference Drummond, O’Brien, Stoddart and Torrance2005).Footnote 8 The QALY is based on a utility measure for morbidity outcomes that can be combined with mortality impacts into a single index. Over the past decade, published cost-effectiveness analyses in the health evaluation field using the QALY measure (known as “cost–utility” analysis) have grown rapidly (Thorat, Cangelosi & Neumann, Reference Thorat, Cangelosi and Neumann2012).Footnote 9 In 2003, the OMB recommended the use of cost–utility analysis for the assessment of federal health, environmental, and safety regulations (Office of Management and Budget, 2003).Footnote 10 In 2006 an expert panel of the Institute of Medicine of the National Academy of Sciences was commissioned to study the feasibility and relevance of cost-effectiveness analysis, including cost–utility analysis, for the assessment of regulatory interventions (Institute of Medicine, 2006). The panel concluded that cost-effectiveness analysis was feasible and potentially informative for regulatory evaluation, and the tool was illustrated in several case studies, including an application to EPA’s off-road diesel rule (Robinson et al., Reference Robinson, Black, Cropper, Burnett, Hammitt, Krupnick and Williams2005).Footnote 11 At the same time, EPA was assessing its experience with cost–utility analysis, begun in regulatory impact assessments in 2003, and studying how to adapt cost–utility analysis for the economic evaluation of air pollution regulations (U.S. EPA, 2006).Footnote 12 Cost–utility analysis has also seen some limited application in the academic literature on air pollution-reducing interventions, e.g., Cohen, Hammitt and Levy (Reference Cohen, Hammitt and Levy2003).
The cost-effectiveness analysis in this study extends the literature in several ways. First, and consistent with the recommendations in the report by the Institute of Medicine, the analysis is based on multiple cost-effectiveness metrics. This framework allows an assessment of the sensitivity of results to the different measures, and comparisons to other studies of federal regulations using the different metrics. Our study is also the first to apply cost–utility analysis to a group of federal regulations.Footnote 13 This extension allows a comparison of the cost-effectiveness of the regulatory interventions studied to those evaluated in the health literature, where cost–utility analysis is standard practice. Third, the analysis focuses on recent air regulations. This application is particularly policy relevant given the cost and consequences of these regulations. Finally, because there are significant uncertainties associated with federal regulatory interventions (see Krupnick et al., Reference Krupnick, Morgenstern, Batz, Nelson, Burtraw, Shih and McWilliams2006), and in particular, regulations to reduce air pollution exposures, our study considers the major uncertainties in the analysis and conducts a formal uncertainty analysis of the concentration–response relationship between fine particle exposures and mortality risks. This formal analysis integrates the expert judgments derived from an elicitation study to compute 90% confidence intervals for the statistical lives that the regulations are expected to save. A 90% confidence interval is then computed for all of the cost-effectiveness measures for each of the regulations in the study.
We begin in the next section with a description of the criteria used to select the regulations, and offer some perspective about their characteristics and the regulatory program that includes them. The following section describes the data and methods used to construct the cost-effectiveness ratios. The results of the analysis are then presented, followed by a discussion of the methodology implications and suggestions for future research.
2. Sample selection and characteristics
This section describes the criteria used to select the rules in the study, and then describes some of their characteristics. We also report the range of estimated statistical lifesavings for each of the rules based on estimates for relative risk reduction commonly used in the Regulatory Impact Analyses (RIAs) of the regulations.Footnote 14 We also indicate cost-effectiveness ratios, defined as gross compliance costs per life saved, that correspond to these estimates. In combination, this information provides the context for understanding the air quality regulations in the study and their costs and effects as the EPA estimates them. This information provides the point of departure for the analysis that follows.
Table 1 Air quality regulations in the study.

2.1. Sample selection
The analysis is based on a sample of EPA rules that meet two criteria. Rules had to target stationary source emitters, and have promulgation dates between 2011 and 2013. Additionally, rules had to be deemed “significant,” and have a RIA completed sometime from August 2010 to December 2013. Table 1 shows the complete list of the rules included in the study.
The time period was chosen for two reasons. First, the analysis is based on secondary sources, and most significantly, on the RIAs themselves. The methods for preparing RIAs continue to evolve, so basing the analysis on the relatively recent period offers a sample of RIAs reflecting reasonably current practices. Secondly, as Table 1 shows, this time frame coincides with a period of significant regulatory activity. This rulemaking reflects the somewhat fortuitous confluence of a series of administrative reconsiderations and legal actions largely resolving a backlog of contested and delayed rulemakings dating back over several administrations. These rulemakings principally, though not exclusively, regulate the emission of hazardous air pollutants (HAPs).Footnote 15
The National Ambient Air Quality Standards (NAAQS) for fine particulate matter is a notable exclusion from our study. Characteristics of NAAQS limit the usefulness of their cost estimates for comparative analysis. States have the flexibility to choose different compliance strategies in multiple sectors to attain ambient standards, and this flexibility reduces the predictability of future costs. The RIA for the NAAQS for particulate matter describes the situation as follows:
The setting of a NAAQS does not compel specific pollution reductions and as such does not directly result in costs and benefits. For this reason, NAAQS RIAs are merely illustrative. The NAAQS RIAs illustrate the potential costs and benefits of additional steps States could take to attain a revised air quality standard nationwide beyond the rules already on the books (U.S. EPA, 2012, pdf pp. 36).Footnote 16
2.2. Characteristics of air regulationsFootnote 17
The rules in this study require national emission standards for hazardous air pollutants (NESHAPs) with just two exceptions: the regulation targeting petroleum refineries, and the Cross State Air Pollution Rule (CSAPR). New Source Performance Standards (NSPS) for the conventional criteria pollutantsFootnote 18 are also required in the rulemakings with just two exceptions: the CSAPR and the rule that reduces hazardous pollutants from large boilers, known as the “Boiler MACT.” In short, NESHAPs in conjunction with NSPS is the modal regulatory approach for the group of regulations in the study.Footnote 19
The regulations target different sources of emissions (see Table 1). The stringency and scope of the regulations differs for these sources, reflecting differences in the size of regulated combustion units and the fuels they use. In general, the Clean Air Act requires major sources of hazardous air pollutants – boilers or process heaters used in electric generating units or in heavy industry – to install “Maximum Achievable Control Technology” (MACT).Footnote 20 Smaller boilers or sources defined as “area” sources, (for example, those used to provide heat in commercial establishments, schools, and hospitals), face less stringent standards consistent with the use of “Generally Available Control Technology” (GACT). Energy efficiency assessments and regular maintenance scheduling are the kinds of actions that might be taken to meet this category of standards.
Table 2 EPA estimates of costs and discounted lives saved, air regulations in the study.

All estimates in table rounded to two significant figures.
* Subtracts out energy savings, with the exception of the Petroleum Refinery Rule. Energy savings for the petroleum refinery rule are larger than the rule’s compliance costs.
** EPA analyses assume that lifesavings are distributed in the periods following the implementation of the regulation according to a “cessation lag.” The discount factor used to convert these future distributed lifesavings into a present value at a 3% discount rate (used here for illustrative purposes) is 0.9061. For the 7% discount rate, the factor is 0.8160. Multiplying the ratios in the table by 1.1036 will convert them to costs per undiscounted lives saved. Multiplying the ratios by 0.9006 will give cost per discounted lives saved at 7%.
*** Totals may not equal summations due to rounding.
Given this regulatory framework, the rulemakings targeting the utility sector are the most costly and are estimated to save the most lives, with Mercury and Air Toxic Standards (MATS) the most costly rule in the study. Indeed, the MATS is one of the most costly rules that the EPA has ever issued, having estimated compliance costs of around $11 billion, or 60% of the total costs of all of the rules in our study. The EPA also estimates that the controls installed to reduce emissions from utility generators will save between about 3,800 and 10,000 statistical lives annually, discounted at 3% (see Table 2). These control devices reduce fine particles as a side effect, and it is the effects of reducing fine particles that give rise to these estimates. The figures shown are from the coefficient estimates from reducing fine particles from two cohort-based epidemiological studies: the American Cancer Society Study and the Harvard Six Cities Study. These studies, which provide updated relative risk estimates with the passage of time, give the benchmark estimates for reduced mortality risks for all air regulations from the EPA.Footnote 21
The CSAPR is the other rule that targets utilities. This rulemaking replaces the Clean State Air Pollution Rule (CAIR), regulating the cross state transport of ozone and fine particle precursors (SO x and NO x ) from electric generating units in 28 states. The CSAPR costs in the neighborhood of $2.6 billion per year and, according to the benchmark EPA estimates, saves 12,000 to 31,000 lives annually from reducing fine particle exposures (see Table 2). These estimates of discounted lives saved are three times larger than those for the MATS, and constitute 60% of the total estimated lives saved for all of the rules in the study.
Rules regulating major boilers (The Boiler MACT) and portland cement plants each cost over a one billion annually and save lives from the reduction of fine particles (again discounted at 3%) from around 2,800 to 7,200 (in the case of the Boiler MACT) and 870 to 2,300 (for the portland cement plants). The Boiler MACT targets larger industrial boilers, while the Portland Cement Rule regulates approximately 158 kilns at 100 facilities.
The regulation targeting hazardous pollutants from solid waste incinerators costs around $280 million per year, and is estimated by EPA to save 43–110 lives annually. The remaining rules target smaller sources, with lower costs and lifesaving effects. They include a regulation targeting smaller “area source” boilers of the type that provide heat in commercial establishments, and the two rules regulating stationary reciprocating internal combustion engines (RICE). These engines are used to power pumps and compressors, and also to power backup generators.Footnote 22
The final rule specifies NSPS for NO x emitted from process heaters in refineries, and provides a flare management and monitoring plan designed to reduce hydrogen sulfide emissions. This is the smallest rule in the study, with an annual compliance cost of around $110 million, and lifesavings from 24 to 60 per year.Footnote 23
Table 2 combines the cost and lifesaving estimates indicated into cost-effectiveness ratios (columns (4) and (5)). These figures can be compared to the VSL for the analytical reference year of the rules. These VSLs range between $9.0 and $10.0 million in $2013.Footnote 24 Thus, the gross compliance cost per discounted statistical life saved is always less than the VSL for all of the rules in the study but two: the rule regulating Area Source Boilers, and the rule regulating Spark-Ignited Reciprocating Internal Combustion Engines (SIRICE). This implies that, with the exception of these two rules, the benefits of reducing fine particles, estimated from either of the cohort epidemiological studies represented in Table 2, are large enough to cover compliance costs without considering any other benefits.
In sum, recent regulations to reduce the emission of hazardous air pollutants, as well as the criteria pollutants, cost around $18 billion per year in aggregate.Footnote 25 Using the estimation methods and data in EPA’s regulatory impact assessments, the mean lifesaving estimates for these rules in combination are over 20,000 to over 55,000 lives per year, discounted at 3%. The benefit estimates associated with these lifesavings are larger than the compliance cost of the regulations for all of the rules but two.
3. Methods and data
This section describes the methods and information sources underlying the several cost-effectiveness metrics used in the study. We first consider the compliance costs of the rules, before turning to the uncertainty analysis of the lifesavings resulting from the regulations. Next we consider the sources and methods for computing net cost numerators, and then turn to an explanation of two additional denominators: life years and QALYs. In combination, this development provides the necessary information for computing probability distributions for the cost-effectiveness metrics.
There are many uncertainties associated with regulatory impact evaluation (see Krupnick et al., Reference Krupnick, Morgenstern, Batz, Nelson, Burtraw, Shih and McWilliams2006). While it is not possible to address them fully in this analysis, it is important to consider the bigger picture briefly to provide some perspective on the scope of our study. One key uncertainty is the emissions baseline. Future emissions will be influenced by difficult-to-anticipate market conditions, including changes in the price of fuel and other inputs, rates of economic growth, and technology trends. The estimation of emissions reductions that the regulation brings about also has uncertainties. The degree of compliance and the scope of the rule’s impact may not be known with certainty, and rulemaking delays and reconsiderations often end up changing the structure of the rule. Uncertainties in the emissions baseline and the effect of the regulation will affect both compliance costs and mortality risks; hence, both the numerator and denominators of the cost-effectiveness ratios.Footnote 26
Modeling the chemical transport and dispersion processes that translate emission reductions into local concentration changes also has uncertainties. Air quality models are subject to extensive validation tests (see Fann et al., Reference Fann, Lamson, Anenberg, Wesson, Risley and Hubbell2012a ), but atmospheric chemistry is complex. Recent research, for example, has found that interactions between NO x emissions and ozone and ammonia can give non-convexities in the formation of ozone and fine particulates – resulting in negative damages in some urban locations from increased nitrogen oxide emissions (Fraas & Lutter, Reference Fraas and Lutter2011, Reference Fraas and Lutter2012).
Once the effects of emissions changes on concentrations have been estimated, the concentration changes are mapped to demographic characteristics at particular locations, and concentration–response models are used to estimate health effects. There are likely to be uncertainties in future demographic conditions, but the main uncertainty discussed in the literature concerns concentration–response modeling.
To make the analysis tractable, we take the reductions in emissions and exposure risks represented in the RIAs as given, abstracting from many of the uncertainties just described. This approach has the important implication that uncertainties about costs and lives saved can be treated independently, and channels the uncertainty analysis into particular areas. On the cost side, the analysis has to focus on uncertainties around the compliance cost per emission or exposure risk reduced, or “unit cost” as described in the literature on retrospective evaluation (Harrington, Morgenstern & Nelson, Reference Harrington, Morgenstern and Nelson2000; Kopits et al., Reference Kopits, McGartland, Morgan, Pasurka, Shadbegian, Simon and Wolverton2014). In terms of outcomes, the assumption that exposures can be taken as given implies that uncertainty about the mortality risks per unit of exposure reduction is the relevant issue. We abstract from possibly relevant demographic uncertainties, and focus on the concentration–response relationship. We now turn to the estimation of unit costs and the concentration–response relationship between exposures and mortality risks.
3.1. Uncertainty in unit compliance costsFootnote 27
There are significant uncertainties associated with regulatory cost estimation. Owing to the difficulty in formally modeling cost distributions, however, we chose not to conduct a formal uncertainty analysis. Rather, we use the cost estimates in the RIAs as the basis for the cost-effectiveness measures, while providing some qualitative perspective about them.
It is important to recognize two categories of uncertainties around compliance costs. The first is uncertainty about compliance strategies, engineering cost components, or market conditions which are known to analysts, and therefore, are measured and represented in the RIAs. Initial assumptions about these factors often prove to be in error, and are reported in retrospective evaluations. As an example, initial assumptions about per unit compliance costs for the 1998 Locomotive Emissions Standard were found to be half of what the cost turned out to be, due to inaccurate assumptions about the usage rates of different control strategies, and rising fuel prices (Kopits, Reference Kopits2014). On the other hand, ex ante estimates of compliance costs for the “Cluster Rule” were subsequently found to be 30%–100% higher than actual costs (Morgan, Pasurka & Shadbegian, Reference Morgan, Pasurka and Shadbegian2014).Footnote 28 Cleaner technology and flexible compliance options reduced costs beneath the level initially expected.
Another uncertainty concerns cost categories not generally recognized in the RIAs. Research in the energy conservation literature offers relevant insight. Individuals often do not undertake energy conservation investments that an outside assessment based on engineering cost estimates would show to be profitable (Gillingham & Palmer, Reference Gillingham and Palmer2014), suggesting that the engineering cost estimates are leaving out relevant information. In fact, this context arises in our study: the energy savings associated with the NSPS for petroleum refineries alone are larger than the regulatory compliance costs. A reason that compliance is not voluntary, given this fact, could be unrecognized transaction costs arising from organizational or managerial constraints, information barriers, or administrative burdens (Krutilla & Krause, Reference Krutilla and Krause2011; Martin, Muuls, de Preux & Wagner, Reference Martin, Muuls, de Preux and Wagner2010). Not being identified in the RIAs, uncertainties about these types of costs will not be picked up in retrospective evaluations.
We briefly consider uncertainties of one or both of these types for the following: compliance strategies, engineering costs, the regulatory implementation schedule and cost allocation, political transaction costs, and modeling frameworks.
3.1.1. Compliance strategies
Firms have choices about compliance options, and this flexibility reduces the certainty of unit cost estimations. The fact that compliance takes place over time adds uncertainty, as market conditions and technology that affect the relative cost of different compliance alternatives change over time. The recent declines in natural gas prices, for example, have encouraged significantly more fuel switching to natural gas in the utility sector than initially anticipated (Burtraw, Palmer, Paul & Woerman, Reference Burtraw, Palmer, Paul and Woerman2012).
Compliance options are greatest for incentive-based instruments, like tradable permits, and as noted previously, for ambient standards. But even for performance standards based on technology benchmarks, firms have significant compliance flexibility. To comply with MACT-based standards prescribed in the MATS, for example, firms can retrofit pollution controls, switch from coal to natural gas at existing generating units, or accelerate the retirement of coal-fired units and the planning for new plant constructions. To the extent that these compliance options cannot be fully anticipated, ex post compliance costs are likely to be different than the initial cost estimates in the RIAs (McGarity & Ruttenberg, Reference McGarity and Ruttenberg2001; McCarthy & Copeland, Reference McCarthy and Copeland2011; McCarthy, Reference McCarthy2012).
3.1.2. Engineering costs
If firms choose to install pollution controls, uncertainties about control costs become relevant for cost estimation. EPA must sometimes choose between higher estimates made by the regulated industry and lower cost estimates submitted by the suppliers of equipment and other inputs to the regulated industry. Unit charges are included in EPA’s cost estimation manual, which indicates that cost estimates are accurate within ±30% (U.S. EPA, 2002). Assuming that estimation errors are randomly distributed, total industry compliance cost estimates should be relatively accurate. However, EPA’s cost manual is significantly out of date. In response to the 2014 Omnibus Bill, the manual is being revised over the next three years to reflect the evolution of materials prices, the component costs of pollution control systems, and the price of labor.Footnote 29
Installed costs must also be considered, and may not be fully reflected in compliance cost estimates in the RIAs. The enactment of the multiple overlapping rules that has recently taken place can make retrofitting additional pollution controls relatively difficult (Chicanowicz, Reference Chicanowicz2011). On the other hand, compliance with multiple rules might also present opportunities for scale economies that would lower unit costs.
3.1.3. Regulatory timing and cost allocation
All of the rules in the study have faced implementation delays, due to administrative reconsiderations and/or legal actions. Such delays can increase unit costs by altering the timing of capital investments. Interrupted implementation also makes it difficult to accurately discount the temporal path of investment, and to allocate costs and effects across rulemaking phases. The CSAPR provides a notable example. In 2008, the District of Columbia Circuit Court of Appeals vacated CSAPR’s predecessor, the Clean Air Interstate Rule (CAIR), but the ruling allowed EPA to administer the CAIR pending future regulation. By EPA estimates, industry incurred $1.6 billion in annual costs to comply with the CAIR by the end of 2011. The replacement of the CAIR with the CSAPR added another $0.8 billion in compliance costs. EPA’s RIA uses the $0.8 billion cost figure, but includes the lifesaving estimates from the incremental change in emissions from the 2005 emissions baseline. In contrast, the 2012 OMB report to Congress included 30% of the total benefits in the RIA for the CSAPR, an amount estimated to correspond with the incremental regulation of the CSAPR beyond the CAIR rule it replaced (Office of Management and Budget, 2012). Our study takes a third approach: both the lifesaving estimates and the compliance costs are taken as the difference between the 2005 baseline and 2013 analytical reference year.
3.1.4. Political costs
Contested regulatory implementation imposes resource costs that stakeholders incur to try to influence outcomes. These costs are not included in conventional economic cost estimates of regulatory actions, but can be tractably modeled and reflected in a modified benefit-cost standard that incorporates lobbying costs and regulatory uncertainty (Krutilla & Alexeev, Reference Krutilla and Alexeev2012). The presence of transfer payments, such as pollution taxes or subsidies, also influences lobbying costs and regulatory outcomes (Krutilla & Alexeev, Reference Krutilla and Alexeev2014). Lobbying costs over policies with the rights structure of regulatory standards can amount to as much as 68% of total compliance costs.
3.1.5. Modeling methods
Engineering cost estimation and partial equilibrium modeling are the methods used to determine compliance costs in the RIAs in our study. Economists often make arguments for general equilibrium modeling, or dynamic market models, to better reflect the market adjustments associated with rulemakings. A well-known dynamic general equilibrium assessment of the Clean Water Act found that social cost estimates could be higher or lower than engineering cost estimates (Hazilla & Kopp, Reference Hazilla and Kopp1990). A recent dynamic econometric model of the effects of regulating hazardous pollutants in the portland cement industry found that social costs were significantly higher than engineering cost estimates (Ryan, Reference Ryan2012).Footnote 30 A caveat is that the welfare effects in these models are driven by adjustments in input usage, output, and consumption – owing to changes in the equilibria in factor and commodity markets that the regulation brings about. In both the models mentioned, for example, prices rise, and output and consumption drop. These market responses can cause emissions to drop; thus, increasing benefits. Without holding the benefit side constant, it is hard to cleanly attribute the welfare effects demonstrated in these models to the cost side of the equation.
3.1.6. Conclusions
There are a number of factors that can cause realized unit compliance costs to vary from the estimates given in the RIAs, and the difference between initial estimates and realized costs can be significant. It is not uncommon for retrospective evaluations to find unit costs to be less than 50% to more than double the estimates in RIAs. Although the retrospective evaluation literature is spotty, there does not seem to be a directional bias in unit cost estimates (Harrington et al., Reference Harrington, Morgenstern and Nelson2000; Kopits et al., Reference Kopits, McGartland, Morgan, Pasurka, Shadbegian, Simon and Wolverton2014). However, transactions costs will impose a downward bias to unit cost estimates in the RIAs, and are not measured in retrospective evaluations. The significance of these costs in the measurement of regulatory opportunity costs has received only limited research.
3.2. Lives saved and uncertainty analysis
The core of EPA’s analysis of mortality risks is based on two families of cohort studies. The first, using the ACS’s Cancer Prevention Study II cohort (“ACS Study”) involves approximately 500,000 adults. The second, the Harvard Six Cities Study (“SCS study”), develops its own cohort involving a little over 8,000 adults.Footnote 31 Both the ACS and the SCS studies follow individuals over time, estimating the relative risk of dying prematurely based on a Cox proportional hazards model. Both the initial ACS and SCS studies are regarded as being well done but rely on somewhat different variation in fine particulate concentrations to identify their estimates.
The 2002 National Academies’ National Research Council (NRC) review of EPA’s uncertainty analysis recommended, among other things, that the EPA include expert judgment about the state of knowledge in its analysis (NRC, 2002). Other approaches to synthesize the state of knowledge include either meta-analysis of studies or integrated exposure response assessment (see for example, Fann, Gilmore & Walker, Reference Fann, Gilmore and Walker2013). Recent research by Smith and Gans (Reference Smith and Gans2014) and Fraas and Lutter (Reference Fraas and Lutter2013a ) suggests that EPA focuses only on aleatory uncertainty and should do more to address epistemic uncertainty. The debate and following comments (Fann, Lamson, Anenberg, and Hubbell Reference Fann, Gilmore and Walker2013; Fraas & Lutter, Reference Fraas and Lutter2013b ; Fann, Lamson, Luben & Hubbell, Reference Fann, Lamson, Luben and Hubbell2015) suggest that the issue remains controversial.Footnote 32
One way to address epistemic uncertainty is with expert elicitations. In 2006 EPA conducted an expert elicitation study on the mortality risks associated with exposure to fine particulates (Industrial Economics, Inc., 2006; Roman et al., Reference Roman, Walker, Walsh, Conner, Richmond, Hubbell and Kinney2008).Footnote 33 The central values of the benefit estimates that follow from these expert judgments are reported in every RIA. This expert elicitation study could also be used to address epistemic uncertainties about impacts for the concentration–response functions, including uncertainties about causality; uncertainties about thresholds or nonlinearity in the concentration–response function; and uncertainties about differential toxicity of the ambient mix of fine particulate constituents. In our study, we use expert elicitation studies to address the first two of these uncertainties. Assessment of the third uncertainty requires speciation of the fine particulate mix and source attribution of emissions and is beyond the scope of this article. The effects of differential toxicity of particles are not a small uncertainty and have been discussed qualitatively in Smith and Gans (Reference Smith and Gans2014).
To provide further context for this analysis, some background on uncertainty analysis in EPA RIAs is given, and we describe the way the information in expert elicitation studies can be used to shed additional light on uncertainties around lifesaving estimates.
3.2.1. Background
In its RIAs, EPA addresses aleatory uncertainty (i.e., confidence intervals which captures uncertainties about the data), while treating epistemic uncertainties about the model in sensitivity analyses. The predominate approach is to include the latest coefficient estimate for mortality risk from the ACS studies (for example either Pope et al., Reference Pope, Burnett, Thun, Calle, Krewski, Ito and Thurston2002 or Krewski et al., Reference Krewski, Jerrett, Burnett, Ma, Hughes and Shi2009) and the latest estimate from the SCS studies (for example Laden et al., Reference Laden, Schwartz, Speizer and Dockery2006 or Lepeule, Laden, Dockery & Schwartz, Reference Lepeule, Laden, Dockery and Schwartz2012), with their associated confidence intervals. These studies extend the sample, adding additional precision to estimates because of the increased sample sizes and more sophisticated techniques, but whatever biases, mismeasurements, and omitted variables there are in original studies tend to persist, as will the reliance on cross-sectional variation or temporal variation in exposure levels for the identification of estimates.
To address the broader question of epistemic uncertainty, results from the 2006 expert elicitation study are summarized in the following sections. These expert elicitations allow experts to examine the evidence and to use their “mental models” to combine and adjust that evidence. Researchers using expert elicitations must decide whether to provide anonymity to their experts. Anonymity can potentially elicit evidence that better reflects the experts’ opinions. On the other hand, not providing anonymity might lead to a better understanding of the reasons for the experts’ perceptions (e.g., toxicologists might view the evidence differently than epidemiologists). Ultimately, both of the expert studies used in our study opted for anonymity, making nuanced interpretations of meanings less possible. While some may question our approach of aggregating information over experts as opposed to leaving them separate, we think both approaches have merit. Given our objective of comparing multiple EPA rules and multiple measures of cost-effectiveness, however, leaving the expert opinions disaggregated is not useful.
3.2.2. Causality
The original report on the elicitation (Industrial Economics, Inc., 2006) provides rich detail about how the individual experts viewed the causality issue and their reasoning for their probability statements. All of the experts initially started off with ranges of estimates for the probability of causality, most quite wide. All experts ultimately ended with a point estimate near the top of their range for the probability of causality. Only the point estimates for this probability of causality appear in Roman et al. (Reference Roman, Walker, Walsh, Conner, Richmond, Hubbell and Kinney2008).
In Roman et al. (Reference Roman, Walker, Walsh, Conner, Richmond, Hubbell and Kinney2008), four of the twelve experts ultimately attached nontrivial probabilities to the hypothesis that the association between PM2.5 and mortality was not causal. Those four non-causal probability statements ranged from 65% to 10% at some exposure concentrations; three experts placed the probability of non-causality at 5%. The remaining five experts placed the probability of non-causality at 2–0%. Only one of the experts placed the probability of non-causality at 0. If a typical statistical hypothesis criteria based on a 95% confidence interval were used, seven out of twelve of the experts would not reject a null hypothesis of non-causality. The elicitation also allowed the experts to refine their assessments about causality to depend on concentration. The average assessment of non-causality at the lowest concentration below 7 μg∕m3 was 13% while the average non-causality assessment was 9% for concentrations above 16 μg∕m3.
EPA’s BenMAP maps the air quality model concentrations to the demographics at a particular location and applies information about the concentration–response model to identify benefits. The BenMAP program incorporates these non-causality probabilities in the assessment of the benefits for each of the twelve experts.Footnote 34
EPA’s Particulate Matter Integrated Science Assessment (PM ISA) provides another approach for assessing the concentration–response function (U.S. EPA, 2009). Unlike the expert elicitation where the variation across experts can be preserved, this group’s deliberation is designed to achieve consensus. The consensus opinion in the PM ISA is that a causal relationship between fine particulates and mortality exists at a high probability.
Based on their 2009 PM ISA, the EPA incorporates no adjustment for non- causality in the estimates from the ACS and SCS cohort studies, assuming causal relationships. Additionally, in those RIAs where EPA incorporates the uncertainty around the individual expert central values, it appears that EPA leaves the uncertainty associated with non-causality out of the confidence intervals.
The issue of non-causality should not necessarily be viewed as an all or nothing proposition. Indeed several of the experts chose not to separate the question about non-causality from the magnitude of the concentration–response impact. Clearly, the ACS and SCS families of studies cannot both be correct. When considering how to evaluate these studies the Industrial Economics, Inc. study (2006) provided details about what the experts viewed as weaknesses in the studies, suggesting departures from the true causal concentration–response relationship for each study. Chief among these were weaknesses in the measurement of fine particulate concentrations at specific locations, weak controls for smoking behavior and the tendency to include more highly educated individuals in cohorts. Fraas and Lutter (Reference Fraas and Lutter2013a ) point out that the cohort studies do not control for systematically time varying variables such as advances in medical treatments. None of the experts raised this as an issue. This issue is potentially important for a number of reasons. Both medical advances and reductions in fine particulates tend to be correlated with time, suggesting that at least some of what the ACS and SCS attribute to fine particulate reductions could be due to this lack of control. And further, that because the SCS has less spatial variation than the ACS studies, it is more susceptible to spurious correlation bias.
On the basis of evaluating the causality judgment in the EPA expert elicitation, a 95% confidence interval for the mortality impact of reducing PM2.5 will include 0 for concentrations greater than 16 μg∕m3. For concentrations of less than 10 μg∕m3, a 90% confidence interval will also include 0.
3.3. Nonlinearity and thresholds
Starting with the RIA for the Portland Cement Rule in 2010, EPA stopped using a threshold value of 10 μg∕m3 in RIAs, and replaced it with their lowest measured level (LML) methodology.Footnote 35 This approach identifies the lowest measured fine particulate concentration level in the most recent of the ACS or SCS cohort studies and allows the reader to decide what fraction of benefits can be relied on when extrapolating impacts far from the sample means, and even beyond the limits of the sample. EPA notes that these out-of-sample benefit ranges have considerably more uncertainty associated with them than within sample ranges, but they include these extrapolations in their analysis without an uncertainty analysis beyond the aleatory uncertainty associated with the standard errors of ACS and SCS impact coefficients. In this latest set of air quality rules, benefit reductions at levels below 10 μg∕m3 constitute a much larger fraction of benefits compared to prior rules, and suggest a reliance on these more uncertain benefits.
No studies provide much information about low-concentration extrapolation of benefits. EPA’s experts (Industrial Economics, Inc., 2006) were given the opportunity to evaluate the studies and express their judgments about causality and impact at low concentrations. To represent these nonlinearities, experts were given the opportunity to specify a break point greater than 4 μg∕m3 where they thought that the concentration–response function would be different. Four of the twelve experts expressed either a lower probability of causality or a lower health impact for exposures at the lower concentration levels. None expressed an expectation of a supralinear impact (the impact increases as the concentration is lowered). Some experts suggested that there was not much evidence for a threshold or nonlinearity but continued that it was unlikely that long-term exposure studies would be able to adequately estimate a threshold even if one existed.
We combine the expert judgments about nonlinearities and causality, weighting the judgments equally. The resulting distribution is shown in Figure 1.Footnote 36 The blue distribution (probability distribution for mortality effect per 1 μg∕m3 reduction in fine particulates) has a higher spike at 0 (indicating the judgments of non-causality) than the red distribution. The blue distribution represents the probability distribution for reductions less than 7 μg∕m3 while the red distribution represents the probability distribution for reductions at higher ambient levels over 16 μg∕m3. The experts, on the whole, expect some non-causality/nonlinearity at lower concentrations, but not large nonlinearities.Footnote 37

Figure 1 Simulated distribution of epistemic and aleatory uncertainty for 12 US experts on the impact of a 1 μg∕m3 increase in PM2.5 at high- and low-concentration levels.
3.4. Performance weighting and additional expert elicitations
The expert elicitation in Cooke et al. (Reference Cooke, Wilson, Tuomisto, Morales, Tainio and Evans2007) and Tuomisto, Wilson, Evans and Tainio (Reference Tuomisto, Wilson, Evans and Tainio2007) provided six more expert judgments about health effects associated with the American ambient mix of fine particulate species.Footnote 38 These judgments also addressed the possibility of differential toxicity and provided additional information about performance weighting of the judgments based on the experts’ ability to answer 12 seed questions (see Cooke (Reference Cooke1991) for the performance-weighting approach). To capture more detail about these distributions we fit a four parameter Johnson distribution to the percentiles for each of their distributions since there were no specific statements available about the parametric distribution that most represented the experts’ perceptions of health effects of fine particulates. This distribution is based on the sinh transformation of the normal and has the ability to represent either positive or negative skewness or kurtosis that differs from the normal. Our distributions fit quite well for all six experts. As shown in Figure 2, these are aggregated using either equal weighting (blue) or performance weighting (red). In general, experts who supplied more informative answers on the seed questions tended to express lower central estimates of mortality impacts of fine particulates and a lower degree of dispersion.

Figure 2 Performance weighting of simulated distributions for six European experts on the impact of a 1 μg∕m3 increase in PM2.5 concentrations in the United States.
Performance weighting can offer the potential to reduce epistemic uncertainty by placing more weight on the distributions from more knowledgeable experts. This is illustrated by the smaller variation in the red distribution (performance weighted) than the blue distribution (equally weighted) shown in Figure 2. While the inclusion of performance weighting was discussed in the Industrial Economics, Inc. (2006) elicitation, ultimately they decided not to use the procedure, and no seed questions are available for us to construct the weighting. Because the questions asked in the European study were somewhat different than in the EPA elicitation, the European study experts are not combined with the EPA experts. However, the equally weighted unconditional distributions are very comparable so that our results would not change importantly if all eighteen experts were integrated with equal weighting. Performance weighting of the experts does reduce the variation in the distribution, suppressing some perspectives and emphasizing others. Whether performance weighting is useful depends on the quality of the seed questions, which may be difficult to assess a priori.
The distributions from Figure 1, along with the intermediate distributions at concentrations between 7 and 16 μg∕m3 are used to generate a distribution of premature deaths avoided by each rule.Footnote 39 In turn, the distributions for lifesavings are used to construct confidence intervals for the different cost-effectiveness metrics used in the study.
3.5. Cost-effectiveness measures
In this section, we discuss the cost-effectiveness ratios used in the study. Numerators are constructed by subtracting some of the benefits other than lifesavings from compliance costs, giving a “net cost,” while denominators are represented as lives saved, life years saved, or QALYs gained. The methods used to derive the various cost-effectiveness measures follow the standard practice for cost-effectiveness analysis in the health evaluation field (Robinson & Hammitt, Reference Robinson and Hammitt2013), and in the extensions made to the assessment of air quality regulations (Robinson et al., Reference Robinson, Black, Cropper, Burnett, Hammitt, Krupnick and Williams2005; U.S. EPA, 2006; Hubbell, Reference Hubbell2006; Cohen, Hammitt & Levy, Reference Cohen, Hammitt and Levy2003).
The categories of health benefits that are typically monetized in EPA RIAs are shown in Table 3, with an example valuation based on central estimates from the CSAPR. The pattern displayed is typical for the rules in the study. Mortality benefits are significantly larger than morbidity benefits. For the morbidity category, chronic bronchitis and non-fatal heart attacks are the largest components.Footnote 40 The RIAs derive estimates of the effects of air regulations and their valuation from a variety of sources. Avoided cases of chronic bronchitis and non-fatal heart attacks are derived respectively from health impact functions from Abbey, Hwang, Burchette, Vancuren and Mills (Reference Abbey, Hwang, Burchette, Vancuren and Mills1995) and Peters, Dockery, Muller and Mittleman (Reference Peters, Dockery, Muller and Mittleman2001). A willingness to pay study by Viscusi, Magat and Huber (Reference Viscusi, Magat and Huber1991) is the starting point for the valuation of chronic bronchitis.Footnote 41 A cost of illness (COI) valuation with two components – medical costs and work productivity – is used to value non-fatal myocardial infarctions. A study by Wittels, Hay and Gotto Jr. (Reference Wittels, Hay and Gotto1990) provides the estimates for the medical costs, while Cropper and Krupnick (Reference Cropper and Krupnick1990) is used to value lost earnings. A variety of mostly COI studies are used to determine values for the other morbidity categories shown in Table 3.
Table 3 Health endpoints and their evaluation for the Cross State Air Pollution Rule.

1 Estimates from American Cancer Society Study and Harvard Six Cities Study respectively.
2 3% discount rate.
Energy savings and diminished carbon emissions are sometimes valued in the RIAs, and visibility benefits are monetized for the CSAPR. We use the central benefit estimates given in the RIAs for the monetary valuation of these categories, and also for the morbidity benefits.Footnote 42
From the benefits monetized in the RIAs, two “net cost” numerators are constructed. The first subtracts all benefits from the rule’s compliance costs other than the value of avoided mortality. We denote the result as the “low net cost boundary.” It is possible for this subtraction to yield a negative number, implying that the non-mortality benefits alone are sufficient to cover the compliance costs of the rule. In this case, the regulation is denoted as “cost saving,” and no further computation is conducted.
When QALYs are used to represent outcomes, a second net cost numerator is computed. Two adjustments are made to the first measure. The productivity part of the COI estimate for non-fatal heart attacks is excluded, rather than subtracted, in the numerator computation. This adjustment reflects the common point of view in the health evaluation literature that productivity is represented in the QALY measure in the denominator.Footnote 43 The morbidity estimate for chronic bronchitis is also excluded from the numerator. In theory, the medical cost part of the estimate should be subtracted from the compliance cost while the other components should be removed on the assumption that productivity and utility gains are represented by the QALY measure in the denominator (Institute of Medicine, 2006). However, there is no empirical basis to make this discrimination. Consequently, chronic bronchitis is fully excluded. This results in a high net cost boundary. These two net cost measures bracket the formats discussed in the literature on cost–utility analysis.
Table 4 Two net costs (gross compliance cost less benefits) for numerators.

* Estimates are rounded to two significant figures. The difference between the 3% and 7% discount rates is sometimes not apparent at two significant figures.
Table 4 shows the two net cost numerators. Two of the rules, the CSAPR and NSPS for Petroleum Refineries, are cost savings in all of the permutations. The visibility benefit and the value of avoided bronchitis for the CSAPR rule are each above $4 billion, while compliance costs are $2.6 billion. As noted before, the negative net cost for the Petroleum Refinery rule comes from energy savings. The Boiler MACT rule is also cost saving at 3% for the low-bound numerator. This rule significantly reduces chronic bronchitis and myocardial infarctions, and the associated benefits lower net costs. For the other rules, the benefits are less than the compliance costs, so they have positive net cost numerators.Footnote 44
Turning to the outcome side, none of the RIAs in our study provided estimates of lives saved by age class. This information is necessary for estimating life years gained. Additionally, for the six rules in our study using the “benefit per ton” approach, there is no information on the fine level geographic detail that would show how pollutant concentrations might be correlated with age class. To deal with this informational constraint, we assume that age distributions are independent of concentrations and use fairly course state level information about mortality incidence rates to estimate life year savings. This approach may not lead to significant biases given the need for spatial aggregation for benefit analysis (see Smith & Gans, Reference Smith and Gans2014). As a point of comparison, our estimates of undiscounted life years per life saved are 15.31, 15.49, and 15.31 using age-class mortality incidence data for the eastern states covered by the CSAPR, the 32 states covered by the NSPS for Petroleum refineries, and the entire United States. These figures compare with estimates given in the RIA for the NAAQS for PM of 15.0 using the ACS study and 16.0 using the SCS study. In short, our method gives life year estimates in the neighborhood of those that EPA has estimated in an RIA based on air quality modeling.Footnote 45
Following the Institute of Medicine (2006) and U.S. EPA (2006), QALYs were computed for the avoided incidences of chronic bronchitis and myocardial infarctions. Incidence of these morbidity categories by age group were taken from data compiled by the U.S. Department of Health and Human Services (2012, 2014) and the National Hospital Discharge Survey (Hall, DeFrances, Williams, Golosinskiy & Schwartzman, Reference Hall, DeFrances, Williams, Golosinskiy and Schwartzman2010). Following U.S. EPA (2006), individuals with chronic bronchitis were assumed to have normal lifespans.Footnote 46 For non-fatal heart attacks, assumptions about life spans and the probability of various health conditions after heart attacks were taken from U.S. EPA (2006, pdf pp. 20–24). With utility weights, this information gives the expected QALYs saved from reducing non-fatal heart attacks.
Preference-based EQ-5D scores are used for utility weights, as recommended by the Institute of Medicine (2006). These scores are taken from a regression study by Sullivan and Ghushchyan (Reference Sullivan and Ghushchyan2006), based on data from the Medical Expenditure Panel Survey. Coefficient estimates from this regression give the marginal changes in EQ-5D scores as a function of various health conditions. The Sullivan and Ghushchyan study also gives age-based EQ-5D utility weights for baseline health status. We adjust baseline health status to reflect age, as recommended by the Institute of Medicine (2006).
The weights used in our study are shown in Tables 5 and 6. Notice that the decline in utility associated with the change in health status from aging is larger than the decline in utility from the health state change associated with any one category of morbidity, holding all else constant.
Table 5 Age related EQ-5D score.
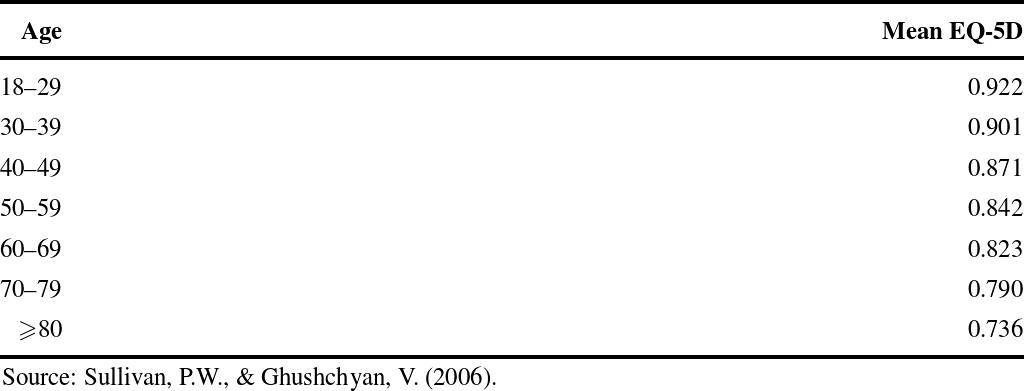
Source: Sullivan, P.W., & Ghushchyan, V. (2006).
Table 6 Mean change in EQ-5D score (holding other covariates constant).

Source: Sullivan, P.W., & Ghushchyan, V. (2006).
4. Results
Cost-effectiveness ratios are displayed in Tables 7–11. For illustrative purposes, the ratios are shown for the 3% discount rate. With the exception of the Boiler MACT rule, the difference between the 3% and 7% rates does not significantly affect results. (Again see Table 4).
Table 7 Gross cost per discounted life saved.

* Estimates rounded to two significant figures.
** Corresponds to no lives saved.
Table 8 Net cost per discounted life saved.

* Estimates rounded to two significant figures.
** Corresponds to no lives saved.
For comparative purposes, Table 7 reproduces the gross cost per discounted life saved ratios shown in Table 2 that correspond to those derived from the ACS cohort study, and also presents the mean and 90% confidence intervals for the cost per discounted life saved ratios from the simulation of expert judgments. The simulated mean estimates are always lower than the estimates derived from the ACS study, because the expert judgments on relative risk tend to lie between those in the ACS and SCS cohort studies. The simulated means for the cost per life saved ratios are therefore lowered by the expert judgments closer to the SCS estimates. The lower confidence limit for the cost per life saved ratios is pulled down further by the variability around the judgments about the risk coefficient estimates. The lower limit for the confidence interval are less than the VSL (again between $9.0 and $10.0 million in $2013 for the analytical reference years) for all of the rules in the study, indicating that lifesaving estimates alone are sufficient to cover the cost of the rules for this part of the cost-effectiveness distribution.
For the mean estimates, the cost-effectiveness ratios are less than the VSLs for all of the rules except for the Area Source Boiler Rule, and the SIRICE rule. On the other hand, the greater variability that comes from combining all of the information in the expert elicitations raises the cost-effectiveness ratios at the upper end of the confidence interval – to infinity. This upper 5% limit corresponds to the “no lives” saved part of the probability distribution for lifesavings. This outcome illustrates a stark dichotomy. Within a simulated 90% confidence interval, there is both the possibility that benefits from lifesavings alone are sufficient to cover the costs of all of the air quality regulations in the study, and the possibility that no lives will be saved and the cost-effectiveness ratios will be infinite for any of the regulations.
Table 9 Net cost per discounted life year saved.

* Estimates rounded to two significant figures.
** Corresponds to no lives saved.
Table 8 shows the 90% confidence interval for the net cost per discounted life saved. Given the results in Table 7, it is not surprising that the ratios at the lower confidence limit are lower than the VSL for all the rules in the study. For the mean estimates, the ratios are less than the VSL with the exception of the Area Source Boiler Ruler and the SIRICE rule. These results are again consistent with those in Table 7, and are also consistent with the sign of the net benefits estimated for these rules in the RIAs. The upper confidence interval for the net cost per lives saved again is infinity for the rules that are not cost saving.
Table 10 Net cost per discounted QALY saved, low-bound net cost (estimates rounded to two digits).

* Estimates rounded to two significant figures.
** Corresponds to no lives saved.
Table 11 Net cost per discounted QALY saved, high-bound net cost.

* Estimates rounded to two significant figures.
** Corresponds to no lives saved.
Of course, the general pattern is similar when life years are represented in the denominator (see Table 9). For the rules that are not cost saving, the ratios at the lower 5% confidence limit range from $14,000 for the Portland Cement Rule to $490,000 for the Area Source Boiler rule. The means for the corresponding cases vary from $32,000 per life year saved to $1,100,000 per life year saved. However, the cost-effectiveness ratios for the six rules that are not cost saving are infinite at the upper 5% confidence interval. Tengs et al. (Reference Tengs, Adams, Pliskin, Safran, Siegel, Weinstein and Graham1995) provides one benchmark against which to compare these results. As mentioned before, the median cost-effectiveness ratio in that study was $61,981, with the median for medical interventions at $28,039 and those for toxin control of $4.1 million. It seems unlikely that the median estimates in our study would be less than the $61,981 figure for any of the rules but for portland cement manufacturing (which has a mean estimate of $32,000). Thus, if lower than the median in Tengs et al. (Reference Tengs, Adams, Pliskin, Safran, Siegel, Weinstein and Graham1995) is taken as a metric for relative cost-effectiveness, some regulations in our study having positive net benefits (having net cost per life saved less than the VSL) will not meet this standard – suggesting that different ratio formats can have different normative implications. Regardless, uncertainty about the lifesaving effects of the regulations reconciles the normative standards at the upper confidence limit in which no lives are saved and the regulations with positive net costs are not cost-effective by any measure.
Table 10 indicates the net cost per QALY saved by each of the rules using the low-bound numerator (Again see Table 4). At the lower 5% confidence limit, the net cost per QALY of all of the rules is less than $200,000 except for the Area Source Boiler rule, and the SIRICE rule. At the mean, only the MATS and the Portland Cement Rule have net cost per QALY less than $200,000. At the upper 5% limit, the net cost per QALY ratios are finite, reflecting the utility gains from reducing cases of chronic bronchitis and non-fatal heart attacks even without any lifesavings. But the net cost per QALY ratios at this point are relatively high. At the upper 5% limit, all of the rules with positive net cost ratios have net cost per QALY values above $200,000.
Table 11 shows the boundary case for the high net cost numerator. In this case, the Boiler MACT rule is not cost saving, but it is the lowest cost rule of any of the rules that have positive net costs. The 90% confidence for the net cost per QALY for this rule runs from $9,000 to $220,000. For the group of other rules having positive net costs, the ratios are marginally higher than those reported for the high net cost bound in Table 10, with the overall pattern being consistent.
In the health evaluation literature, $50,000–$100,000 per QALY gained has been a traditional benchmark for gauging cost-effectiveness (Grosse, Reference Grosse2008). More recently, thresholds from $100,000 to $200,000 have been suggested (Neumann, Cohen & Weinstein, Reference Neumann, Cohen and Weinstein2014). Although widely used, cost-effectiveness benchmarks have been criticized as arbitrary (Neumann et al., Reference Neumann, Cohen and Weinstein2014), and for not reflecting relevant WTP measures very well (Grosse, Reference Grosse2008). Even with these criticisms, these benchmarks provide another reference point for how the cost-effectiveness of air regulations might be regarded in the health evaluation literature. The ratios that are cost savings are cost-effective by definition. For those regulations with positive net costs, the air quality interventions would not be regarded as cost-effective for ratios at the upper 5% limit. With the exception of the Boiler MACT for the low net cost boundary, none of the net cost per QALY figures is close to $200,000 per year at the upper 5% limit. This suggests that, without mortality risk reductions, the values now monetized in RIAs are not alone likely to make air regulations look cost-effective by the conventional standards of cost–utility analysis.
On the other hand, mortality risk reductions occurring at the mean and lower 5% confidence limits significantly lower the net cost per QALY figures. As noted above, all rules have net cost per QALY lower than $200,000 at the lower 5% confidence limit with the exception of the Area Source Boiler rule and the SIRICE rule. For the mean estimates, the picture is more mixed. The mixed picture at the mean again shows that the normative conclusions drawn from different cost-effectiveness metrics – cost–utility analysis in this case – may not dovetail with benefit-cost analysis. Specifically, while the mean estimates for net cost per QALY in Tables 10 and 11 do not necessarily fall under the $200,000 benchmark, the means for the ratios in Table 8 are less than the VSL – again with the exception of the SIRICE and Area Source Boiler rules – indicating that they pass the benefit-cost test.
5. Discussion and conclusion
We have studied recent EPA regulations targeting stationary source air emissions, and have simulated a 90% confidence interval for the premature deaths avoided by each regulation. These simulations are based on the combined judgments of experts concerning the relationship between airborne particulate exposures and mortality risks. Adding estimates for compliance cost and morbidity benefits gives 90% confidence intervals for cost-effectiveness ratios.
Two of the rules in the sample, the CSAPR and the NSPS for Petroleum Refineries, are “cost saving” in all permutations. That is, the non-mortality benefits that these rules provide are sufficient to pay off the compliance costs of the rules. The Boiler MACT is also cost saving for the 3% discount rate and lower bound estimate for its net cost numerator. Of the rules having positive net costs, the net cost-effectiveness ratios differ significantly between the lower and upper confidence limits. Most of the rules are cost-effective by most metrics at the lower 5% confidence bound, while most of the rules are not cost-effective measured by any metric at the upper 5% confidence limit. In particular, all rules with positive net costs have infinite cost-effectiveness ratios at the upper 5% limit when the denominators are lives or life years saved. At the mean, the picture is more varied.
Structural aspects of air regulation explain the width of the 90% confidence intervals for cost-effectiveness ratios. Air pollution creates exposure risks for virtually everyone. Small changes in the estimates of relative risk will therefore give large changes in estimated mortality risk reductions. The sensitivity of predictions about total lives saved to minor differences in relative risk estimates suggests the importance of resolving informational uncertainty about the effects of fine particle exposures on mortality risks.
Our work has focused on particular aspects of epistemic and aleatory uncertainty in concentration–response models, but not on others such as the toxicity of different fine particulate species. To include these uncertainties would have widened the confidence intervals further. At the same time, it should be recognized that the existing expert elicitation studies are more than eight years old and could overstate, as well as understate, uncertainties about causality, magnitudes of impacts, and nonlinearities. As a result, updated elicitations should be conducted reflecting information from recent research, including extensions of the ACS and SCS cohort studies as well as the integrated science assessment sponsored by the EPA (U.S. EPA, 2009). Experience in the use of expert elicitations has increased, allowing for better assessments of uncertainty to more refined questions. An updated elicitation study could complement EPA’s ongoing efforts to integrate scientific knowledge about the consequences of fine particulate mortality.
We believe our results also contain insights relevant for the larger cost-effectiveness literature. The confidence intervals for cost-effectiveness ratios around the rules in our study are substantially wider than the differences between the means. However, uncertainties for air regulations are highly correlated, reflecting lives saved estimates generated from the same relative risk coefficients. In the more common context of cost-effectiveness analysis, effects across interventions are not likely to be so strongly correlated. In that case, the results of our study serve as a reminder that confidence intervals are important for cost-effectiveness comparisons. Standard “league tables” that compare cost-effectiveness ratios usually contain point estimates. That begs the question of how much uncertainty there is in the estimates given in these tables, and suggests that interpretations about cost-effectiveness based on comparisons of point estimates be made cautiously. The presentation of confidence intervals for cost-effectiveness ratios would also allow an expanded analysis that compares trade-offs in means and variances for different interventions.
Acknowledgments and Disclaimer
The authors want to thank the Electric Power Research Institute for financial support, and to acknowledge the thoughtful oversight of their technical advisory board – Susan Dudley, John Evans, Art Fraas, James K. Hammitt, and Charles Poole. They also appreciate exchanges with EPA’s air quality group – Susan Anenberg, Neal Fann, and Bryan Hubbell – and especially Amy Lamson, who offered informative responses to numerous queries and a technical review of the article. Ron Wyzga, Lisa Robinson, Anne Smith, Elisabeth Gilmore, Kevin Boyle, James Barnes, and Dan Cole offered knowledgeable perspectives on various aspects of the work, while Ed Chicanowicz and Mark Menefee provided useful information about compliance costs. Yu Zhang, Gabriel Piña, Michelle Hoover, and Tyler Kerr provided capable research assistance. Finally, Glenn Blomquist and an anonymous reviewer provided perceptive and detailed comments on an initial submission of the article, and Mary Kokoski gave the article a necessary editing. While indebted to all of these individuals, the authors are entirely responsible for the execution of the study, its results and conclusions, and the final written article.
Appendix A. Federal register publication of the rules in the study
A.1. Utility rules
U.S. EPA, “National Emission Standards for Hazardous Air Pollutants From Coal- and Oil-Fired Electric Utility Steam Generating Units and Standards of Performance for Fossil-Fuel-Fired Electric Utility, Industrial-Commercial- Institutional, andSmallIndustrial-Commercial-InstitutionalSteamGeneratingUnits;FinalRule,” 77 Federal Register 9304, February 16, 2012. http://www.gpo.gov/fdsys/pkg/FR-2012-02-16/pdf/2012-806.pdf
U.S. EPA, “Revisions to Federal Implementation Plans To Reduce Interstate Transport of Fine Particulate Matter and Ozone; Final Rule,” 77 Federal Register 34830, June 12, 2012. http://www.gpo.gov/fdsys/pkg/FR-2012-06-12/pdf/2012-14251.pdf
A.2. Boilers and incinerators
U.S. EPA, “National Emission Standards for Hazardous Air Pollutants for Major Sources: Industrial, Commercial, and Institutional Boilers and Process Heaters; Final Rule,” 78 Federal Register 7138, January 31, 2013. http://www.gpo.gov/fdsys/pkg/FR-2013-01-31/pdf/2012-31646.pdf
U.S. EPA, “National Emission Standards for Hazardous Air Pollutants for Area Sources: Industrial, Commercial, and Institutional Boilers; Final Rule” 78 Federal Register 7488, February 1, 2013. http://www.gpo.gov/fdsys/pkg/FR-2013-02-01/pdf/2012-31645.pdf
U.S. EPA, “Commercial and Industrial Solid Waste Incineration Units: Reconsideration and Final Amendments; Non-Hazardous Secondary Materials That Are Solid Waste; Final Rule,” 78 Federal Register 9112, February 7, 2013. http://www.gpo.gov/fdsys/pkg/FR-2013-02-07/pdf/2012-31632.pdf
A.3. Portland cement
U.S. EPA, “National Emission Standards for Hazardous Air Pollutants for the Portland Cement Manufacturing Industry and Standards of Performance for Portland Cement Plants; Final Rule,” 78 Federal Register 10006, February 12, 2013.http://www.gpo.gov/fdsys/pkg/FR-2013-02-12/pdf/2012-31633.pdf
A.4. RICE rules
U.S. EPA, “National Emission Standards for Hazardous Air Pollutants for Reciprocating Internal Combustion Engines; New Source Performance Standards for Stationary Internal Combustion Engines; Final Rule,” 78 Federal Register 6674, January 30, 2013. http://www.gpo.gov/fdsys/pkg/FR-2013-01-30/pdf/2013-01288.pdf
A.5. Petroleum refineries
U.S. EPA, “Standards of Performance for Petroleum Refineries for Which Construction, Reconstruction, or Modification Commenced After May 14, 2007; Final Rule,” 77 Federal Register 56422, September 12, 2012. http://www.gpo.gov/fdsys/pkg/FR-2012-09-12/pdf/2012-20866.pdf
Appendix B. Regulatory impact analyses
B.1. Utility rules
U.S. EPA, “Regulatory Impact Analysis for the Final Mercury and Air Toxics Standards,” December 2011. http://www.epa.gov/ttnecas1/regdata/RIAs/matsriafinal.pdf
U.S. EPA, “Regulatory Impact Analysis for the Federal Implementation Plans to Reduce Interstate Transport of Fine Particulate Matter and Ozone in 27 States; Correction of SIP Approvals for 22 States,” June 2011. http://www.epa.gov/airtransport/pdfs/FinalRIA.pdf
B.2. Boilers and incinerators
U.S. EPA, “Regulatory Impact Results for Reconsideration Final Rule for National Emission Standards for Hazardous Air Pollutants for Industrial, Commercial, and Institutional Boilers and Process Heaters at Major Sources,” December 2012. http://epa.gov/airquality/combustion/docs/boilerreconfinalria121220.pdf
U.S. EPA, “Regulatory Impact Results for the Reconsideration Final Rule for Standards of Performance for New Stationary Sources and Emission Guidelines for Existing Sources: Commercial and Industrial Solid Waste Incineration Units,” December 2012. http://epa.gov/airquality/combustion/docs/boilerreconfinalria121220.pdf
U.S. EPA, “Regulatory Impact Analysis: National Emission Standards for Hazardous Air Pollutants for Industrial, Commercial, and Institutional Boilers and Process Heaters,” February 2011. http://epa.gov/airquality/combustion/docs/ciswireconfinalria.pdf
B.3. Portland cement
U.S. EPA, “Regulatory Impact Analysis: Amendments to the National Emission Standards for Hazardous Air Pollutants and New Source Performance Standards (NSPS) for the Portland Cement Manufacturing Industry,” August 2010. http://www.epa.gov/ttnecas1/regdata/RIAs/portlandcementfinalria.pdf
B.4. RICE rules
U.S. EPA, “Regulatory Impact Analysis for Reconsideration of Existing Stationary Spark Ignition Rice NESHAP,” January 2013. http://www.epa.gov/ttnecas1/regdata/RIAs/NESHAP_RICE_Spark_Ignition_RIA_finalreconsideration2013_EPA.pdf
U.S. EPA, “Regulatory Impact Analysis for the Reconsideration of the Existing Stationary Compression Ignition Engines NESHAP,” January 2013. http://www.epa.gov/ttnecas1/regdata/RIAs/RICE_NESHAPreconsideration_Compression_Ignition_Engines_RIA_final2013_EPA.pdf
B.5. Petroleum refineries
U.S. EPA, “Regulatory Impact Analysis Petroleum Refineries New Source Performance Standards,” June 2012. http://www.epa.gov/ttnecas1/regdata/RIAs/refineries_nsps_ja_final_ria.pdf


