


There is recent evidence that adequate nutritional intake by children and adolescents is associated with a lower risk of youth( Reference Villa, Yngve and Poortvliet 1 , Reference Tucker, Seljaas and Hager 2 ) and adult obesity( Reference Guo, Wu and Chumlea 3 ) as well as of subsequent nutrition-related morbidities in adulthood such as CVD( Reference Amati, Chiloiro and Jirillo 4 , Reference Baker, Olsen and Sorensen 5 ), several cancers( Reference Must, Spadano and Coakley 6 , Reference Law 7 ) and type 2 diabetes( Reference Biro and Wien 8 , Reference Morrison, Glueck and Daniels 9 ).
Adolescents experience pubertal hormonal changes regulating appetite, satiety and body fat distribution( Reference Lustig 10 ) and increasingly assert independence from their parents, all of which may affect their eating behaviour( Reference Lytle and Kubik 11 ). Thus adolescence is a critical period( Reference van Lenthe, Kemper and van Mechelen 12 , Reference Dietz 13 ) in which poor dietary practices may constitute an increased risk for several adult chronic diseases( Reference Biro and Wien 8 ). Furthermore, dietary habits which have been established in childhood or adolescence may track into adult life( Reference Mikkila, Rasanen and Raitakari 14 ). Improving the nutritional intake of children and adolescents is therefore a goal for global public health( 15 , Reference Moreno 16 ).
Several surveys have been conducted on the nutritional intake of European adolescents; however, they have mostly been conducted on national, regional or in non-representative samples( Reference Hoppu, Lehtisalo and Tapanainen 17 – Reference Royo-Bordonada, Gorgojo and Martin-Moreno 20 ). For instance, compared with nutrient intake recommendations, the average intake of sucrose was higher and the average intakes of fibre, Fe, folate and vitamin D were lower in 14-year-old Finnish adolescents( Reference Hoppu, Lehtisalo and Tapanainen 17 ). German adolescents aged 11–19 years had a slightly higher proportion of energy intake from fat, while the intakes of micronutrients were in line with the recommendations, except for folate, Fe and Ca in girls( Reference Libuda, Alexy and Buyken 18 ). In 10- to 18-year-old Italian teenagers and 6- to 7-year-old Spanish pupils, the proportion of energy from fat was higher than recommended and the proportion from carbohydrates was lower( Reference Royo-Bordonada, Gorgojo and Martin-Moreno 20 , Reference Sette, Le Donne and Piccinelli 21 ). Both the Italian and the Spanish adolescents met the recommended intakes for micronutrients( Reference Royo-Bordonada, Gorgojo and Martin-Moreno 20 , Reference Sette, Le Donne and Piccinelli 21 ).
However, these surveys differ in methodology, population groups and age categories, and thus the available information is insufficient for a comprehensive conclusion about the nutritional status of adolescents at a pan-European level( Reference Lambert, Agostoni and Elmadfa 22 ). The Healthy Lifestyle in Europe by Nutrition in Adolescence (HELENA) Cross-Sectional Study (HELENA-CSS) gathered, for the first time, representative data about the health and nutritional status of a large sample of adolescents across European countries assessed with standardized, harmonized and validated instruments and procedures.
The purpose of the present analysis was to describe and evaluate the nutritional intake by means of the recommendations of the nutrition societies of Germany, Austria and Switzerland (D-A-CH)( 23 ), which are based on a public health-oriented concept and set recommended intakes at a level intended to prevent nutrient-specific deficiency symptoms, but also achieve optimal nutrition and avoid oversupply with energy or certain nutrients( Reference Prentice, Branca and Decsi 24 ). In a further step, the nutrient intake data of the European adolescents were condensed to a single parameter, the Nutritional Quality Index (NQI), to assess overall diet quality( Reference Thiele, Mensink and Beitz 25 ). The NQI was constructed on the basis of nutritional recommendations as evaluation criteria( Reference Gedrich and Karg 26 ) and was used as a summary measure of the degree to which the adolescents’ diet conformed to the D-A-CH recommendations.
Methods
Study design and sample
The HELENA-CSS was conducted between 2006 and 2007 in ten European cities (Athens, Heraklion (Greece), Dortmund (Germany), Ghent (Belgium), Lille (France), Pecs (Hungary), Rome (Italy), Stockholm (Sweden), Vienna (Austria) and Zaragoza (Spain)). Detailed information about the study has been reported elsewhere( Reference Moreno, De Henauw and Gonzalez-Gross 27 , Reference Moreno, Gonzalez-Gross and Kersting 28 ). The main objective of HELENA-CSS was to obtain reliable and comparable data on a variety of nutritional and health-related parameters in a representative sample of 3528 European adolescents (boys and girls aged 12·5–17·5 years)( Reference Moreno, Gonzalez-Gross and Kersting 28 , Reference Beghin, Huybrechts and Vicente-Rodriguez 29 ). The ethical committee of each centre approved the study and signed informed consent was obtained from the adolescents as well as from the parents( Reference Beghin, Castera and Manios 30 ).
For the present analysis, data on nutritional intake from Heraklion and Pecs (n 678) could not be included because of incomplete data. Furthermore, specific inclusion criteria (complete energy and nutrient intake data on two days obtained by the HELENA-DIAT 24 h recall and data on anthropometry) were defined for the present analysis, which were fulfilled by 1804 adolescents. Finally, adolescents with plausible dietary recalls were ascertained by relating their reported total energy intake to their BMR, as described below. Hence, the cohort analysed here included 1590 adolescents (54 % female).
Dietary intake assessment
Dietary intake data were obtained using a self-administered, computerized 24 h recall, named HELENA-DIAT, which was based on the Young Adolescents’ Nutrition Assessment on Computer (YANA-C)( Reference Vereecken, Covents and Matthys 31 ), a tool validated in Flemish adolescents. The basic version was improved and culturally adapted by adding national dishes to reach a European standard( Reference Vereecken, Covents and Sichert-Hellert 32 ). The dietary data collection is organized in six meal occasions, i.e. breakfast, morning snack, lunch, afternoon snack, evening meal and evening snack. The participants can select from about 400 predefined food items and are free to add non-listed foods manually. Special techniques are used to allow a detailed description and quantification of foods, e.g. pictures of portion sizes and dishes. Amounts eaten could be reported as grams or by common household measures. After a short introduction by a trained researcher, the adolescents completed the HELENA-DIAT 24 h recall during school time while a research staff member was present in the classroom to assist the adolescents if necessary. They completed the HELENA-DIAT twice on non-consecutive days within a time span of 2 weeks, to achieve information closer to habitual food intake than assessing food intake on consecutive days. The two 24 h recalls thus comprised weekdays and weekend days, but not necessarily a weekday and weekend day for each individual.
To calculate energy and nutrient intake, data of the HELENA-DIAT were linked to the German Food Code and Nutrient Database (BLS (Bundeslebensmittelschlüssel) version II·3·1, 2005)( Reference Dehne, Klemm and Henseler 33 ). For this purpose, culture-specific composite dishes were disaggregated into their basic food components, all of which were available in the German database. In addition to energy, a total of thirty-two nutrients (macronutrients, vitamins and minerals) were assessed. The Multiple Source Method was used to adjust the intake data taking into account both between- and within-individual variability of the dietary intake( Reference Haubrock, Nothlings and Volatier 34 ). However, table salt, fortified foods and supplement consumption were not assessed in HELENA-DIAT.
The daily intakes of each nutrient as well as total daily energy intake were calculated for each participant from the mean of the two 24 h recalls. Total daily energy intake was used to exclude potentially implausible recalls by comparing it with BMR estimated using the equations of Schofield( Reference Schofield 35 ). Using the approach of Goldberg et al. ( Reference Goldberg, Black and Jebb 36 ), fifty-one (47 % male and 53 % female) adolescents were considered as under-reporters (ratio of energy intake to BMR <0·99) and 163 (61 % male and 39 % female) adolescents were considered as over-reporters (ratio of energy intake to BMR rate >2·40) and were therefore excluded from the analysis.
The purpose of the present data analysis was to comprehensively describe the nutritional intake of European adolescents and to evaluate it in the light of recommended intakes. We used the age- and sex-specific reference values for nutrient intake provided by the nutrition societies of Germany, Austria and Switzerland (D-A-CH)( 23 ), since these recommendations provide data for all thirty-two nutrients in HELENA( Reference Prentice, Branca and Decsi 24 ) and are used in two of the eight HELENA cities. The individual percentage achievement of the recommendations for the particular nutrients was ascertained, since the D-A-CH values do not include a specific value to compare mean intakes of groups with the recommended value.
In order to assess the overall health-related quality of dietary habits as a summary measure, Gedrich and Karg developed the Nutritional Quality Index (NQI)( Reference Gedrich and Karg 26 ). For this analysis we calculated two approaches of the NQI, one based on absolute values and one based on nutrient densities. The NQI is based on the proportional intake as compared with the reference values. In order to calculate the NQI, the nutrients are classified into two groups: (i) those which should not exceed the recommended level; and (ii) those which should not fall below the recommended level. Intakes that meet the corresponding reference values are rated with an intake quality score (IQS) of 100. For nutrients of the first group the exceeding portion is subtracted from 100 to form the IQS, e.g. SFA intake of 130 % of the recommendation results in an IQS of 70. For the second group the portion that is below the recommendation is subtracted from 100, e.g. a vitamin C intake of 80 % of the recommendation results in an IQS of 80. In a further step, the NQI is calculated as the harmonic mean of all IQS values for each individual. Thus, the NQI scores range from 0 to 100, with a higher score indicating better diet quality( Reference Gedrich and Karg 26 ).
Anthropometric measurements
Measurements were performed by trained staff in a standardized way( Reference Nagy, Vicente-Rodriguez and Manios 37 ), with the adolescents barefoot and in underwear. Weight was measured with an electronic scale to the nearest 0·1 kg, and height was measured with a telescopic stadiometer to the nearest 0·1 cm. BMI was calculated from height and weight (kg/m2). Sex- and age-independent BMI standard deviation scores (SDS) were calculated using Z-values for BMI, calculated via the LMS method by Cole et al. ( Reference Cole, Bellizzi and Flegal 38 ). Overweight was defined according to age- and sex-standardized BMI cut-off points based on data of Cole et al.( Reference Cole, Bellizzi and Flegal 38 ). Skinfold thicknesses were measured three times on the left side of the body with a Holtain calliper to the nearest 0·2 mm. Body fat percentage (BF%) was calculated from triceps and subscapular skinfold thicknesses using Slaughter et al.'s equations( Reference Slaughter, Lohman and Boileau 39 ).
Socio-economic characteristics
Socio-economic characteristics were assessed with a self-reported questionnaire( Reference Iliescu, Beghin and Maes 40 ). The adolescents reported whether their parents were overweight (yes/no) and their parents’ educational level (lower education/lower secondary or higher secondary/higher education/university degree)( 41 ). The familial affluence scale (FAS), previously validated( Reference Currie, Molcho and Boyce 42 ), was used as an indicator of the adolescents’ material affluence. It was based on information about family car ownership, having an own bedroom, Internet availability and computer ownership. Furthermore, migration status (born outside the country in which they lived during the study: yes/no) was assessed.
Health-related characteristics
Physical activity was assessed with the self-administered International Physical Activity Questionnaire for Adolescents (IPAQ-A) covering questions about physical activity during the last 7 d( Reference Hagstromer, Bergman and De Bourdeaudhuij 43 ). The IPAQ-A validity was tested by comparing its results with accelerometer data( Reference Ottevaere, Huybrechts and De Bourdeaudhuij 44 ). Total minutes per week (min/week) were computed and assigned to moderate-to-vigorous physical activity according to the guidelines for data processing( 45 ). Additionally, smoking status (ever smoked: yes/no) was assessed.
Nutritional knowledge characteristics
To assess the nutritional knowledge of the adolescents, a validated nutritional knowledge test was used( Reference Kersting, Sichert-Hellert and Vereecken 46 ). For evaluation, the percentage of correct answers to the twenty-three multiple-choice questions was calculated.
Statistical analysis
SAS procedures (SAS statistical software package version 9·13) were used for data analysis. A P value <0·05 was considered statistically significant. Sample weights were applied to adjust for exclusion of study participants due to insufficient data. The sampling weight calibrates the sample so that it matches the theoretical sample with regard to sex and age group.
Differences in characteristics between included and excluded participants and NQI values between boys and girls were tested using ANOVA for normally distributed variables, Kruskal–Wallis tests for non-normally distributed variables and χ 2 tests for categorical variables. Values are presented as weighted frequencies, means and standard deviations, or medians with 25th and 75th percentiles.
Weighted intakes of nutrients by the adolescents were calculated as medians (25th and 75th percentiles). The percentage intake of the reference value was calculated and presented as medians (25th and 75th percentiles) of the respective percentages of each individual's achievement compared with the D-A-CH recommendations.
Results
The present data analysis included 731 (46 %) boys and 859 (54 %) girls. Characteristics regarding anthropometry, socio-economic status, health status and nutritional knowledge for the included and excluded participants are presented in Table 1. The included had a lower BMI-SDS, percentage of overweight and BF% (all P < 0·0001). Differences between the included and excluded regarding socio-economic characteristics were also statistically significant (P values <0·0001 or <0·0005) except for migration status, although percentages of parental overweight and education status as well as familial affluence were comparable. The included furthermore reported significantly less to have ever smoked (P < 0·0001) and significantly less physical activity (P = 0·02) compared with the excluded.
Table 1 Characteristics† of the study sample: 1590 included and 1938 excluded European adolescents from the Healthy Lifestyle in Europe by Nutrition in Adolescents (HELENA) study
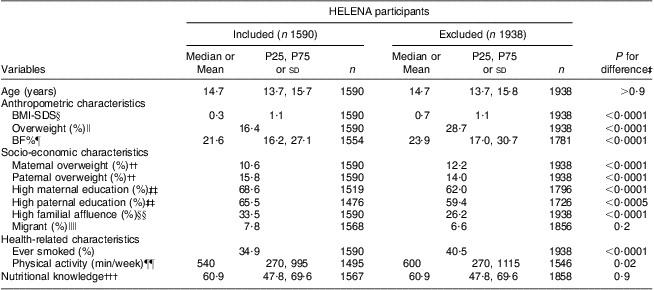
P25, 25th percentile; P75, 75th percentile; SDS, standard deviation score; BF%, body fat percentage.
†Values are presented as weighted median with P25 and P75, mean and standard deviation, or frequency.
‡Significant differences between groups tested using the Kruskal–Wallis test for non-normally distributed variables, ANOVA for normally distributed variables and the χ 2 test for categorical variables.
§BMI-SDS calculated using Z-values for BMI, calculated via the LMS method by Cole et al. ( Reference Cole, Bellizzi and Flegal 38 ).
∥Derived from the sex- and age-specific cut-offs proposed by the International Obesity Taskforce, which correspond to an adult BMI cut-off of 25 kg/m2( Reference Cole, Bellizzi and Flegal 38 ).
¶Estimated according to the equations of Slaughter et al. ( Reference Slaughter, Lohman and Boileau 39 ).
††Obtained from questions about adolescents’ perception.
‡‡Higher secondary education and higher education or university degree.
§§Based on information about family car ownership, having an own bedroom, Internet availability and computer ownership.
∥∥Participant was born outside the country in which they lived during the study.
¶¶Moderate-to-vigorous physical activity.
†††Percentage of correctly answered questions in the nutritional knowledge test.
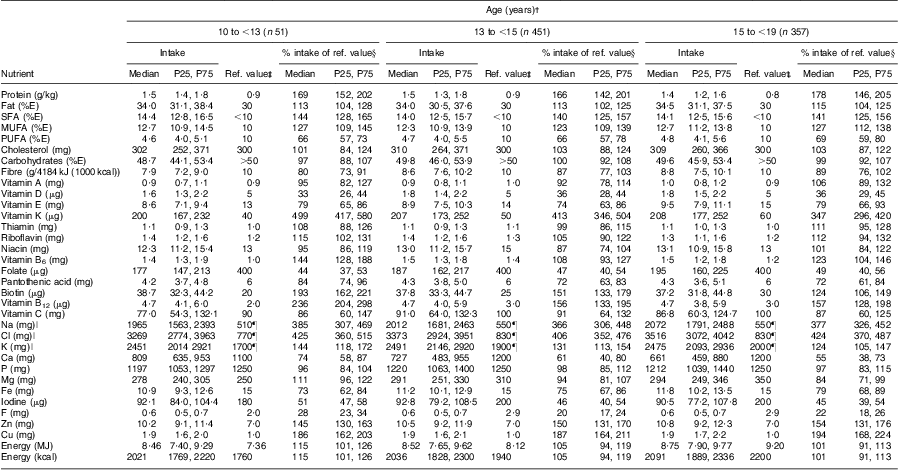
The weighted dietary intakes of nutrients and energy of the European boys and girls, stratified by age group, compared with the recommendations are shown in Tables 2 and 3. The fulfilment of the recommendations for both genders is additionally illustrated in Fig. 1. The recommendations for daily nutrient intake were designed to meet the nutrient requirements of nearly all healthy individuals( 47 ), i.e. the recommended values are about 20–30 % above the average requirement( 23 ). Thus, we considered an intake of 75–125 % of the recommended values as acceptable.
Table 2 Weighted dietary nutrient and energy intakes in comparison with the D-A-CH reference values for nutrient intake, stratified by age group, of 731 European boys aged 12·5–17·5 years from the Healthy Lifestyle in Europe by Nutrition in Adolescents (HELENA) Study

P25, 25th percentile; P75, 75th percentile; %E, percentage of energy intake.
†Values are presented as median with P25 and P75.
‡D-A-CH reference values for nutrient intake of the German Nutrition Society, Austrian Nutrition Society, Swiss Society for Nutrition Research and Swiss Nutrition Association( 23 ).
§Median (P25, P75) of the respective percentages of each individual's intake compared with the D-A-CH reference values.
∥Discretionary salt intake was not included.
¶Estimated values for minimum intake.
Table 3 Weighted dietary nutrient and energy intakes in comparison with the D-A-CH reference values for nutrient intake, stratified by age group, of 859 European girls aged 12·5–17·5 years from the Healthy Lifestyle in Europe by Nutrition in Adolescents (HELENA) Study
P25, 25th percentile; P75, 75th percentile; %E, percentage of energy intake.
†Values are presented as median with P25 and P75.
‡D-A-CH reference values for nutrient intake of the German Nutrition Society, Austrian Nutrition Society, Swiss Society for Nutrition Research and Swiss Nutrition Association( 23 ).
§Median (P25, P75) of the respective percentages of each individual's intake compared with the D-A-CH reference values.
∥Discretionary salt intake was not included.
¶Estimated values for minimum intake.
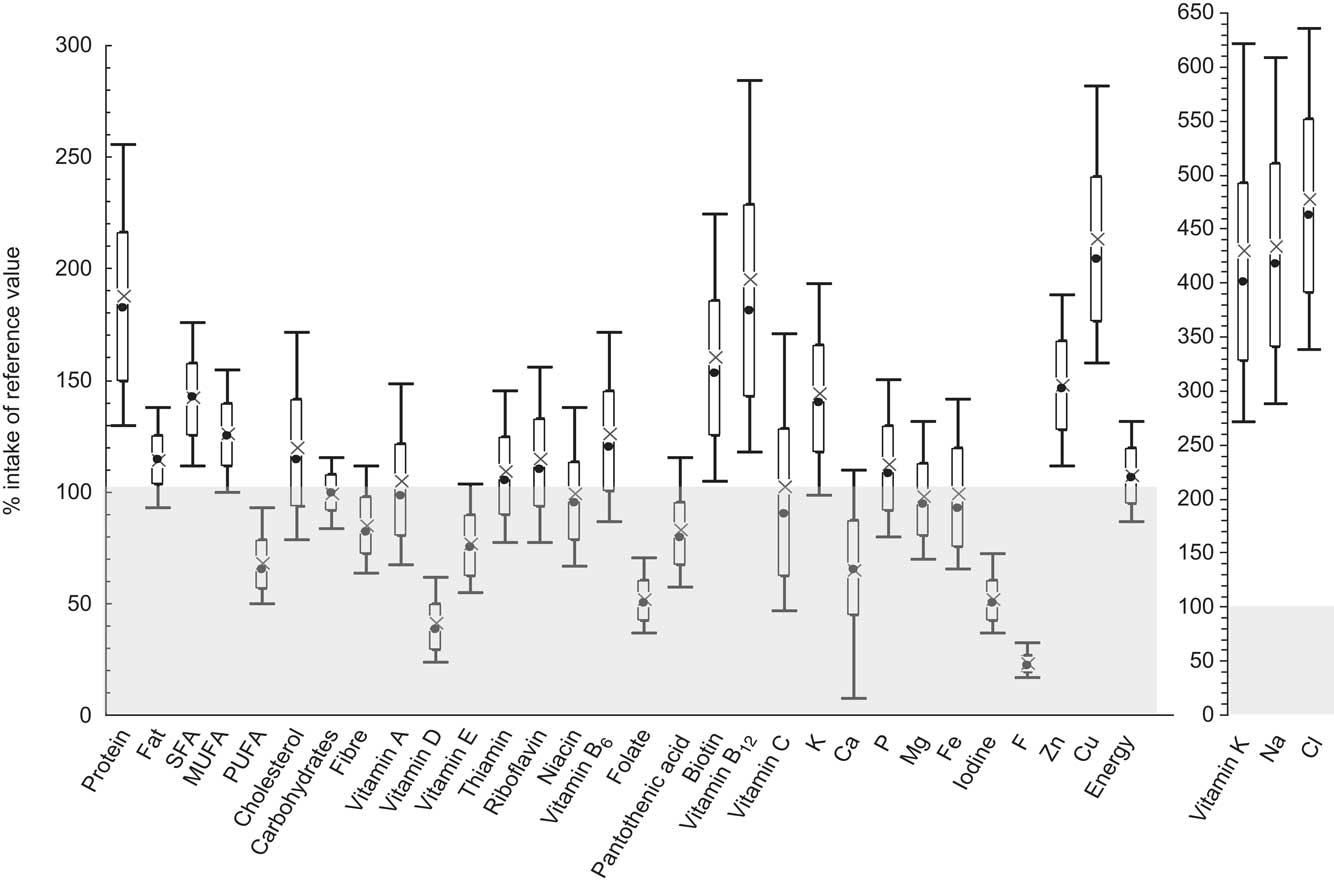
Fig. 1 Dietary nutrient and energy intakes in comparison with the D-A-CH reference values for nutrient intake among 1590 European adolescents aged 12·5–17·5 years from the Healthy Lifestyle in Europe by Nutrition in Adolescents (HELENA) Study. Data are presented as box-and-whisker plots in which the bottom and top of the box represent the 25th and 75th percentile (quartile 1 and quartile 3), respectively; the bottom and top of the whisker represent the 10th and 90th percentile, respectively; × represents the mean; and ● represents the median; ![]() represents intake inadequacy compared with the reference value
represents intake inadequacy compared with the reference value
Regarding protein, the intake was about twice as high as the recommendation, i.e. about 200 and 170 % of the nutrient reference value in boys and girls of all age groups, respectively. While cholesterol intake and fat intake in general were approximately in line with the recommendations in both genders, the intake of SFA was about 40 % higher than recommended, whereas the intake of PUFA was about 40 % lower than the nutrient reference value. Intake of carbohydrates was in line with the recommendations in both genders and all age groups and also fibre intake was within the acceptable range of the reference values with a slightly higher intake among girls compared with boys.
The fat-soluble vitamins A and E were found to be within the acceptable range, with the exception of vitamin E in boys of the two younger age groups whose intake was only about 70 % of the recommendation. However, the intake of vitamin D was far below the acceptable range with only about 40 % and 35 % of the recommended intake in boys and girls, respectively. In contrast, vitamin K intake was about three to five times higher than the nutrient reference value.
Intakes of the water-soluble vitamins thiamin, riboflavin, niacin, vitamin B6, pantothenic acid, biotin, vitamin B12 and vitamin C met or exceeded the recommendations among the European adolescents. Only folate failed to reach approximately 50 % of the recommended intake.
Regarding minerals, the intakes of Na and Cl were about three to five times higher than the recommended values in boys and girls among all age groups. Furthermore, the intakes of K, P, Mg, Zn and Cu were sufficient. With respect to Ca, boys aged 10–15 years had an acceptable intake of about 80 % of the recommended minimum value, whereas the intake of the older boys was lower (about 70 %). For girls, Ca intake reached the lower acceptable level of about 75 % of the recommendation in the youngest group, but only 55 % of the recommended intake for the oldest age group. The intake of Fe was within the acceptable range among both genders, with only slightly lower values among girls of the youngest age groups. In contrast, iodine and F intakes were insufficient, as intakes did not reach more than about 55 % of the recommendation for iodine and no more than 30 % for F.
Energy intakes of both genders were in line with the recommendations.
Finally, the weighted NQI derived from both absolute values and densities of the European adolescents, stratified by age group, are presented in Table 4. The median NQI was approximately 72 in absolute value and 71 in terms of nutritional density (of a maximum value of 100). The NQI values were highest in 10- to 13-year-old boys (about 77 and 75 for absolute and density values, respectively) and lowest for 13- to 15-year-old girls (about 70 and 69 for absolute values and density values, respectively). Significant differences between boys and girls existed regarding the NQI density in the youngest age group (10–<13 years) and regarding both NQI absolute and NQI density in the middle age group (13–<15 years), with consistently higher values for boys. Since there is no specific cut-off for the NQI indicating an ‘adequate’ diet, the same cut-off as for evaluating single nutrient intake was used, i.e. 75 %. Thus, the overall nutritional quality was rather low among the European adolescents.
Table 4 Weighted nutritional quality index derived both from absolute values and from densities, stratified by age group, of 1590 European adolescents aged 12·5–17·5 years from the Healthy Lifestyle in Europe by Nutrition in Adolescents (HELENA) Study
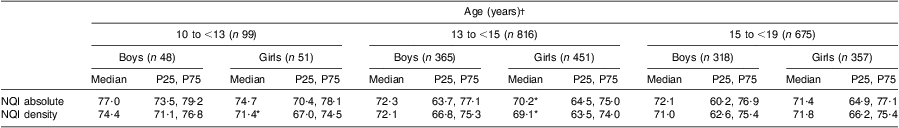
P25, 25th percentile; P75, 75th percentile; NQI, Nutritional Quality Index.
Median values were significantly different from those of boys (tested using the Kruskal–Wallis test): *P < 0·05.
†Values are presented as median with P25 and P75.
Discussion
The present analysis provides for the first time detailed and comprehensive data from a standardized dietary assessment of the energy and nutrient intakes of adolescents across Europe. Compared with widely used nutrient reference intakes, the energy intake and the proportions of energy intake from carbohydrates, fat and protein are sufficient. However, the quality of fat intake needs to be improved in the European adolescents. For the micronutrients as well as for dietary fibre, the intake levels are mostly within an acceptable range, with the exceptions of vitamin D, folate, iodine and F across the study population and Ca in older girls. However, regarding the nutritional quality as a whole, the European boys and girls have a rather low overall diet quality with a median NQI of about 72 and 71 for absolute and density values, respectively.
These results from the HELENA Study are generally concordant with earlier regional studies in several European countries. In comparison with the D-A-CH reference values (or with the similar US recommended daily allowance( 48 )), the protein intake of the HELENA adolescents was about twice as high. These findings are in line with the results of other European studies( Reference Lambert, Agostoni and Elmadfa 22 , Reference Elmadfa, Meyer and Nowak 49 , Reference Parizkova 50 ). Although an increase in protein intake may have negative effects on bone health( Reference Barzel and Massey 51 ), no long-term studies have revealed adverse effects of protein intake above the recommended amount( Reference Ginty 52 ), i.e. at levels such as those in our sample. Moreover, in 6- to 18-year-old German( Reference Alexy, Remer and Manz 53 ) and 17-year-old Danish( Reference Budek, Hoppe and Ingstrup 54 ) children and adolescents, protein intake was positively associated with bone strength and mineralization. Thus, the described protein intake of the European adolescents might not be of concern.
The total intakes of fat and cholesterol in the HELENA sample are well in line with the guidelines. However, the proportions of energy from SFA and PUFA among the European adolescents are in need of improvement, since the intake of SFA exceeded the recommendations by about 40 % and the intake of PUFA was found to be 40 % lower. This pattern – which has also been described in other studies among European adolescents( Reference Elmadfa, Meyer and Nowak 49 , Reference Elmadfa and Freisling 55 – Reference Rolland-Cachera, Bellisle and Deheeger 58 ) – may not only negatively influence present health but may also increase the risk for diabetes, dyslipidaemia or CVD later in life( 15 , 59 ). Associations between fat intake during childhood and the quality of the adult diet two decades later have been reported( Reference Mikkila, Rasanen and Raitakari 60 ), and so it is of importance in the prevention of diet-related diseases to improve the dietary fat quality already in adolescence( Reference Spinneker, Egert and Gonzalez-Gross 61 ).
Regarding micronutrients, most vitamins and minerals were consumed in accordance with the D-A-CH reference values used here. Some smaller deviations, e.g. a lower intake of vitamin E intake in younger boys, of Ca among older boys or of Fe in younger girls, might be attributed to the specific recommendations used here or to the skewed distribution of recommendations. Since the deviations do not exceed 30 % and the recommended intakes are designed to be 20–30 % higher than the average requirement, this might not be an indication of deficiencies( 23 ). Unfortunately, at the moment a diversity of nutrient reference values is used across Europe with considerable differences in the stated nutritional requirements. The nutritional quality of the diet of European adolescents based on nutrient intake would thus be estimated differently depending on what recommendations are used( Reference Tabacchi, Wijnhoven and Branca 62 ). While some of the disparities can be attributed to physiological and environmental differences between populations, most are due to methodological differences( Reference Prentice, Branca and Decsi 24 ).
However, compared with the D-A-CH reference values, and also in comparison with the recommendations of most other European countries( Reference Prentice, Branca and Decsi 24 ), the intakes of vitamin D, folate, iodine and F were insufficient among European adolescents, as was the intake of Ca in 13- to 19-year-old girls. As shown in various publications( Reference Lambert, Agostoni and Elmadfa 22 , Reference Elmadfa, Meyer and Nowak 49 , Reference Samuelson 56 ), vitamin D intake often reaches only about 40 % of the recommended level. This is due to the fact that vitamin D is found naturally in only a few foods and even fortification – which is a widely used technique to increase vitamin D intake in many industrialized countries – has only modest effects on vitamin D status( Reference Ovesen, Andersen and Jakobsen 63 ) and could not be considered in the HELENA Study. Of greater importance is the endogenous synthesis of vitamin D when the skin is exposed to sunlight. However, skin synthesis may not fully compensate for the low nutritional intake among all adolescents throughout Europe, because Europe is located over many degrees of latitude and skin production of vitamin D varies considerably at different latitudes( Reference Kimlin, Downs and Parisi 64 ).
The intake of folate reached only about 50 % of the recommendation in this sample. Other nutritional surveys describe intakes at a similar level( Reference Lambert, Agostoni and Elmadfa 22 , Reference Elmadfa and Freisling 55 ), with slightly higher values in Southern Europe( Reference Cruz 57 ). Folate intake is difficult to assess because neither cooking losses nor food fortification were accounted for in HELENA-DIAT. Since folate deficiency is not only important for the prevention of neural tube defects in pregnancy but also of CVD and some malignancies( Reference Molloy 65 ), the low folate intake among the European adolescents is of concern.
The intakes of iodine and F were also very low, reaching only about 50 % and 20 % of the recommendations, respectively. While the intake of F is not reported in other European surveys among adolescents, iodine intake has repeatedly been found to be below the recommended intakes( Reference Lambert, Agostoni and Elmadfa 22 ). Again these minerals are difficult to assess with HELENA-DIAT, since a major part of the iodine and F intake stems from fortification of e.g. table salt( 66 , Reference Delange 67 ) and – in the case of F – swallowed toothpaste( Reference Oganessian, Ivancakova and Lencova 68 ). However, deficiencies of these minerals can result in thyroid diseases( Reference Delange 67 ) and dental caries and should thus be prevented by comprehensive fortifications.
On the other hand, there are some micronutrients that were ingested in much higher amounts among the HELENA adolescents than recommended, i.e. vitamin K, Na and Cl. However, the toxicity of vitamin K is extremely low and no upper level has been established( 47 ). The Na and Cl intakes equate to about 6 g of salt and thus around the accepted amount of daily salt intake( 23 ). However, this value is certainly highly underestimated since table salt is not considered in HELENA-DIAT and might be not completely assessed in processed or convenience food. Therefore, the actual salt intake – which includes table salt – might be critically high.
Furthermore, the median energy intake of adolescents participating in the HELENA study was about 11 046 kJ/d (2640 kcal/d) for boys and about 8619 kJ/d (2060 kcal/d) for girls and is therefore in the range presented in the European Nutrition and Health Report (9498–14 518 kJ/d (2270–3470 kcal/d) for boys, 6820–9707 kJ/d (1630–2320 kcal/d) for girls)( Reference Elmadfa, Meyer and Nowak 49 ).
Nutritional indices are a way to assess overall diet quality with a single parameter( Reference Thiele, Mensink and Beitz 25 ). However, most indices are calculated based on the arithmetical mean, which is known to balance data, i.e. deficiencies of a few nutrients are compensated for by adequate intakes of other nutrients( Reference Madden and Yoder 69 – Reference Waijers, Feskens and Ocke 71 ). Such a mathematical compensation is not, however, physiologically possible. The NQI is therefore based on the harmonic mean. In this, a low intake of one nutrient is weighted more heavily and decreases the overall nutritional quality disproportionately( Reference Gedrich and Karg 26 ). Compensation is thus reduced, corresponding more to metabolic pathways. The HELENA adolescents had a median absolute and density NQI of about 72 and 71, respectively. Unfortunately, the interpretation of these values is not straightforward, since specific cut-offs indicating an ‘adequate’ diet are not determined for most indices and are difficult to justify in the absence of an overall biomarker. Some studies have used the assumption that values below 67 % of the optimum might indicate a suboptimal state of nutrition( Reference Madden and Yoder 69 ), while others used the indices only to compare sub-samples( Reference Thiele, Mensink and Beitz 25 , Reference Basiotis, Guthrie and Bowman 70 , Reference Waijers, Feskens and Ocke 71 ). We used the same cut-off as for single nutrients, i.e. 75 %, and found a rather low overall nutritional quality. Since the harmonic mean was used in this data analysis, the noticeable low intakes of folate, vitamin D, iodine and F might have affected the NQI of the adolescents excessively. Under these considerations, the overall nutritional quality seems to be close to adequate among the HELENA sample.
Before giving any recommendation for supplementation of specific nutrients, the nutrient status of the European adolescents should be established( Reference Al-Tahan, Gonzalez-Gross and Pietrzik 72 ) and potential country- or population-specific situations should be taken into account. Some biomarker evaluations of nutritional status have already been executed or are in process in a HELENA sub-sample( Reference Gonzalez-Gross, Valtuena and Breidenassel 73 ).
Since the 24 h recall used in HELENA was identified to have substantial under-reporting bias( Reference Vereecken, Covents and Matthys 31 , Reference Vereecken, Dohogne and Covents 74 ), 214 (12 %) under- and over-reporters were excluded from the analysis. The groups differed significantly in their adherence to the D-A-CH recommendations in nearly all nutrients (except for carbohydrates and fat) and in their NQI (data not shown). Furthermore, the included adolescents differed significantly from the rest of the whole HELENA sample regarding their anthropometric, socio-economic and health related characteristics (Table 1). These results point to the fact that data of the excluded adolescents were biased. Therefore, it can be assumed that the data obtained in the present analysis from the included participants only are more reliable and allow meaningful information about nutrient intake among European adolescents.
Some limitations of the study need to be mentioned. To begin with, the HELENA-CSS cohort is not a fully representative European sample, since due to the selection procedure of classes from all schools in the chosen cities representativeness can be at best achieved on the city level. However, this procedure was anticipated to give a fair approximation of the average situation, if the objective was to only describe the adolescents’ characteristics, as was the case in the present study( Reference Moreno, De Henauw and Gonzalez-Gross 27 ). Furthermore, the 24 h recall used in the HELENA Study has been shown to be prone to under-reporting in a validation study( Reference Vereecken, Covents and Sichert-Hellert 32 , Reference Vereecken, Dohogne and Covents 74 ). Nevertheless, due to the exclusion of over- and under-reporters in the present sample, systematic bias due to inadequate reporting should have been reduced. On the other hand, the exclusion might have induced selection bias since the misreporters might have a special food choice or eating behaviour. Furthermore, large within-person variation might be of concern, given that dietary data were assessed only by two 24 h recalls. However, the large size of the sample (nearly 1600 adolescents) should have alleviated large within-person variations( Reference van ‘t Veer 75 ). Additionally, sample weights that were constructed for the sample after over- and under-reporters were excluded calibrated the sample so that it matched the European population with regard to sex and age group. Another limitation is the fact that the 24 h recalls were all completed during school days (about the dietary intake of the previous day) and thus did not include information about the adolescents’ diet on Fridays and Saturdays or on holidays. Moreover, a 24 h recall like HELENA-DIAT might not be an adequate tool to estimate some minerals like Na, Cl, iodine and F stemming mostly from (fortified) table salt, as well as the amount and quality of additional fat for meal preparation.
One of the major strengths of the present study, besides the large sample size, is the geographical spread over eight European cities. The sample consists of adolescents assessed using highly standardized and validated procedures; for example, all countries used the same 24 h recall (HELENA-DIAT) and the same food composition database (BLS). Another strength is the use of the Multiple Source Method taking into account both between- and within-individual variability of the dietary intake data. Moreover, the current study is one of the first examining the overall nutrient intake and not just specific nutrients among adolescents at a pan-European level. We evaluated the overall nutritional quality of the adolescents with the NQI. Nutritional indices can be used to some extent to evaluate a diet's adequacy( Reference Waijers, Feskens and Ocke 71 ). However, they are not appropriate to derive specific recommendations to improve nutritional quality, since the intake of single nutrients has to be considered. This has been conducted here extensively by the use of public health-oriented reference values( Reference Prentice, Branca and Decsi 24 ).
Conclusion
The present analysis of the HELENA Study provides new, reliable and comprehensive insight into the intake of a large number of nutrients among European adolescents. Compared with the D-A-CH reference values the intakes of most nutrients can be assumed to be adequate. However, further studies using suitable criteria to assess nutrient status are needed and further research should also investigate the high protein and salt intakes found in the HELENA adolescents.
Overall, public health initiatives should educate children and adolescents regarding balanced food choices (possibly with the addition of fortified foods or supplements for some critical nutrients, if evidence dictates), since health behaviour adopted in childhood and adolescence might be carried over into adulthood and may thus play an important role in the prevention of nutrition-related diseases.
Acknowledgements
Sources of funding: The HELENA Study took place with the financial support of the European Community Sixth RTD Framework Programme (Contract FOOD CT-2005-007034). The contents of this paper reflect only the authors' views and the rest of HELENA Study Members and the European Community are not liable for any use that may be made of the information contained herein. Ethics: The ethical committee of each city approved the study. Conflicts of interest: The authors have no conflicts of interest. Authors' contributions: L.M. coordinated the project. L.M., M.G.-G. and M.K. designed and carried out the HELENA project. K.D. carried out the data analyses and drafted the manuscript. M.K. provided critical input on the data analyses and on earlier versions of the manuscript and supervised the study. I.H., S.D.H., Y.M., L.B., M.G.-G., C.L.D., M.C.-G., M.J.C., K.W. and E.P. contributed to interpretation of the data of the submitted manuscript. Each author has seen and approved the contents of the submitted manuscript. Acknowledgements: The participation of all adolescents in the HELENA Study is gratefully acknowledged.


