


Vascular diseases (VD) including CHD, stroke, hypertension and peripheral artery disease (PAD) are major health and economic problems in Western countries(Reference Leal, Luengo-Fernandez and Gray1). CHD, stroke and PAD share many common risk factors: non-modifiable risk factors, such as age and gender, and modifiable risk factors, such as smoking, dyslipidaemia, obesity and diabetes. Over the past few years, diet and lifestyle have been identified as modifiable risk factors in VD, especially in VD due to atherosclerosis(Reference Fung, Rexrode and Mantzoros2–Reference Chiuve, McCullough and Sacks4). Many studies have shown that dietary patterns play a major role in the development and prevention of VD, as in CHD(Reference Knoops, de Groot and Kromhout5–Reference Mozaffarian, Micha and Wallace10). Dietary patterns also seem to play a role in ischaemic stroke(Reference Chiuve, Rexrode and Spiegelman3, Reference Fung, Stampfer and Manson11) and increase the prevalence of PAD(Reference Lane, Magno and Lane12). Thus, both dietary assessment and dietary management appear to be essential to limit the impact of VD due to atherosclerosis(Reference Kahn, Robertson and Smith13).
Unfortunately, dietary assessment remains a difficult challenge. First, physicians often have insufficient knowledge about food composition and how to give dietary advice(Reference Wood, De Backer and Faergeman14). Furthermore, most of the available tools (diet interviews, diet records, large FFQ) used to evaluate an individual diet are too complicated and time consuming for routine clinical practice and population screening. However, the first step to take preventive action is to develop useful validated tools for measuring risk factors in clinical practice. Many authors have suggested using short FFQ to evaluate characteristic food groups known to play roles in specific diseases(Reference Svilaas, Strom and Svilaas15–Reference Carsin and Mahe17). Laviolle et al. (Reference Laviolle, Froger-Bompas and Guillo16) previously validated a fourteen-item FFQ for atherosclerosis VD prevention in a French population. This FFQ did not assess an exhaustive diet but evaluated dietary patterns known to be associated with CHD, ischaemic stroke and carotid atherosclerosis(Reference Laviolle, Froger-Bompas and Guillo16, Reference Mahé, Ronzière and Laviolle18). It provides scores for characteristic food groups involved in atherosclerosis diseases (scores for SFA, MUFA, n-3 PUFA and for fruit and vegetables (F&V)) as well as a global nutritional score(Reference Laviolle, Froger-Bompas and Guillo16). For a given subject, this global nutritional score is named the ‘vascular dietary score’ (VDS)(Reference Carsin and Mahe17). Based on the calculation method(Reference Laviolle, Froger-Bompas and Guillo16) and the literature(Reference Chiuve, Rexrode and Spiegelman3, Reference Knoops, de Groot and Kromhout5, Reference Kromhout, Menotti and Bloemberg6), a high score means a favourable diet against VD, whereas a low score means a diet associated with VD considered as a risky vascular diet(Reference Laviolle, Froger-Bompas and Guillo16, Reference Mahé, Ronzière and Laviolle18). Such specific diet screening for VD could be useful not only for each subject at the individual level but also for large national recommendations about nutrition and VD prevention(Reference Kahn, Robertson and Smith13, Reference Carsin and Mahe17).
Previous epidemiological studies, but not in a general practitioner's (GP) office, showed that socio-economic, demographic and behavioural factors in part explained lifestyles and dietary patterns(Reference Naska, Fouskakis and Oikonomou19–Reference Estaquio, Druesne-Pecollo and Latino-Martel22). However, they did not study the relationship of these factors with a specific diet involved in VD, which precludes screening the population that had a risky vascular diet. A better knowledge of these factors may help to improve global information and political action about nutrition and VD.
The aim of the present study was first to assess, in clinical practice, the dietary pattern of a population of French subjects (VDS) using a previously validated FFQ(Reference Laviolle, Froger-Bompas and Guillo16). Second, we investigated the relationship of socio-economic, demographic and behavioural factors with the VDS. Finally, we evaluated the acceptance and the interest of subjects in this dietary assessment.
Materials and methods
Population
A cross-sectional study was conducted in a French GP’s office. Subjects over 18 years of age were consecutively included. An investigator invited each subject when they attended for their regular check-up to answer a dietary questionnaire before consultation. All of the participants were Caucasian residents and gave their informed consent. The present study was performed in accordance with French medical laws and received the ethics committee agreement of the University Hospital of Angers.
Dietary assessment
We used a short FFQ developed for food assessment in CHD prevention and in ischaemic stroke(Reference Laviolle, Froger-Bompas and Guillo16). This FFQ was previously validated against biomarkers and a 7d dietary history, which reflect long-term dietary intake(Reference Laviolle, Froger-Bompas and Guillo16). This semi-quantitative FFQ is constructed with fourteen questions selected to give information about the intake of food groups likely to influence CHD risk. Six questions explored the SFA intake from ‘cheese’, ‘red meat’, ‘delicatessen’, ‘salted pies and pizzas’, ‘cookies, cakes and pastries’ and ‘butter’. Five questions explored the vegetable MUFA, the n-6 and n-3 PUFA intakes from vegetable fats, fish and nuts. Three questions explored the F&V intake. A specific score was calculated for SFA, MUFA, n-6 PUFA, n-3 PUFA and F&V. A negative score of 17 points was attributed to SFA consumption, which represents an unfavourable consumption for VD(Reference Kromhout, Menotti and Bloemberg6, Reference Mead, Atkinson and Albin9). A positive score of 19 points was achieved with vegetable MUFA, n-3 PUFA and F&V, which represent favourable food groups against VD(Reference Knoops, de Groot and Kromhout5, Reference Kromhout, Menotti and Bloemberg6, Reference Trichopoulou, Costacou and Bamia23). The score for vegetable MUFA (0–4 points) corresponded to a reported consumption ranging from <6 to >24 g/d with an increment of 6 g/score point. The score for n-3 PUFA (0–8 points) corresponded to a reported consumption ranging from <0·30 to >2·4 g/d with an increment of 0·3 g/score point. The score for F&V ranged from 0 to 7 points. Eight points (1·5 g/score point) were attributed to n-6 PUFA consumption, which was not included in the VDS but was used to estimate the n-6 PUFA:n-3 PUFA ratio. Lastly, a global dietary score called VDS was calculated as (MUFA + n-3 PUFA + F&V) − (SFA) scores (Fig. 1). It gives an estimation of the dietary pattern graded from −17 to +19. The higher the score, the more favourable was the dietary pattern.

Fig. 1 Calculation method of the vascular dietary score (VDS)
The validity against dietary history was previously assessed with Spearman’s correlation coefficients, which ranged from 0·47 (F&V) to 0·63 (PUFA/SFA; all P < 0·05), with a mean value of 0·54. The biomarker-based validity using Spearman’s correlation coefficients varied from 0·21 (SFA) to 0·53 (n-3 PUFA; all P < 0·05), with a mean value of 0·35. Reproducibility assessed by the intra-class correlation coefficient ranged from 0·71 (MUFA) to 0·93 (VDS), with a mean value of 0·81(Reference Laviolle, Froger-Bompas and Guillo16). Please refer to the validation paper for more information and access to the whole questionnaire(Reference Laviolle, Froger-Bompas and Guillo16). The administration of this FFQ needed 5–10 min. We used a computerized questionnaire version (Microsoft® Excel 2000; Microsoft Corp, Redmond, WA, USA) to limit errors of data capture and immediately give scores and dietary advice to subjects. Although a clinical cut-off has not yet been determined, based on the results of previous studies(Reference Laviolle, Froger-Bompas and Guillo16, Reference Mahé, Ronzière and Laviolle18), a VDS of ≥8 was considered as a favourable vascular diet and a VDS of <8 was considered as a diet that needed improvement(Reference Laviolle, Froger-Bompas and Guillo16, Reference Froger-Bompas, Laviolle and Guillo24). Indeed, a VDS of ≥8 can be considered as a favourable diet against VD due to the score calculation method(Reference Laviolle, Froger-Bompas and Guillo16) and the literature(Reference Chiuve, Rexrode and Spiegelman3, Reference Knoops, de Groot and Kromhout5, Reference Kromhout, Menotti and Bloemberg6, Reference Iqbal, Anand and Ounpuu8, Reference Trichopoulou, Costacou and Bamia23). A VDS of ≥8 corresponds to a high consumption of F&V, MUFA, n-3 PUFA and a low consumption of SFA(Reference Laviolle, Froger-Bompas and Guillo16). Furthermore, a VDS of +7 was previously found in patients between 6 months and 3 years after completing a cardiovascular rehabilitation programme (during which they had received nutritional advice)(Reference Froger-Bompas, Laviolle and Guillo24). A VDS ≤−1 was considered a risky vascular diet because a VDS of −1 was previously found to be associated with acute CHD and a worse VDS was found in ischaemic stroke patients and carotid atherosclerosis(Reference Laviolle, Froger-Bompas and Guillo16, Reference Mahé, Ronzière and Laviolle18, Reference Froger-Bompas, Laviolle and Guillo24).
Statistics
All data were expressed as the mean with their standard errors for continuous variables or number and percentage for categorical variables. A step-by-step multivariate linear regression analysis with stepwise selection was performed using the VDS as the dependent variable. Dummy variables were used to treat the qualitative variables(Reference Suits25). The P value for explanatory parameters to enter and stay in the model was set at 0·10. All variables presented in Table 1 were tested with univariate analysis for association with the VDS. According to the literature(Reference Drewnowski, Fiddler and Dauchet20, Reference Estaquio, Druesne-Pecollo and Latino-Martel22) and after univariate regressions(Reference Sun, Shook and Kay26), the fifteen explanatory parameters included in the model were: age, gender (men), BMI, physical activity represented by ‘walking 20 min/d’ and by ‘sport ≥1 h/week’, alcohol consumption represented by ‘alcohol 10 g/d’ and ‘alcohol ≥20 g/d’, smoking status represented by ‘former smoker’ and ‘smoker’, educational level represented by ‘primary school’ and by ‘university or equivalent’, marital status represented by ‘living in a couple’, fact of ‘having child or children’, history of previous nutritional advice and ‘treatment taking’. The occupational categories represented by ‘farmers’, ‘craftsmen, self-employed, storekeepers’, ‘executives, intellectuals’, ‘intermediate professions’, ‘employees’, ‘manual workers’, ‘retired’ and ‘unemployed’ were not included in the model because there was collinearity with educational status and few subjects in some categories. In a multivariate analysis, a positive or negative β value means a positive or inverse relationship between the dependent variable and an explanatory parameter, respectively. β coefficients were normalized to percentage values when significant, and are an estimation of the relative participation of the explanatory parameter to the variable to be explained by the model. A probability level of P <0·05 was used to indicate statistical significance. The Statistical Package for Social Sciences statistical software package version 16·0 (SPSS Inc., Chicago, IL, USA) was used for all statistical analyses.
Table 1 General characteristics of the population

‘Walking 20 min/d’ meant ‘light-to-moderate physical activity’. ‘Sport ≥1 h/week’ meant ‘moderate-to-vigorous physical activity’. Data are expressed as mean with their standard errors for continuous variables. Number of subjects (n) and percentages are reported for categorical variables.
*Variable reference for univariate analysis.
Sample size estimation
To test different variables in a multivariate linear regression, ten subjects for each of the variables that were tested were needed. In the present study, fifteen variables were tested. Therefore, a minimum of 150 subjects was required(Reference Harrell, Lee and Califf27).
Results
During the inclusion period, fourteen subjects did not agree to answer the questionnaire. Two hundred and fifty subjects (18–84 years old) were included in the present study with a majority of women (63·6 %). The mean age was 53 (se 16) years in men and 49 (se 18) years in women. Subject characteristics are summarized in Table 1.
Figure 2 presents the distribution of the VDS in the studied population. Mean VDS was 3·3 (se 4·8). Positive dietary scores were 4·6 (se 1·7) for F&V, 1·1 (se 0·9) for MUFA, 2·1 (se 1·7) for n-3 PUFA. The negative dietary score represented by SFA score was 4·5 (se 2·6). The n-6 PUFA:n-3 PUFA ratio was 8·3 (se 8·1).

Fig. 2 Distribution of the vascular dietary score (VDS) in the studied population (250 subjects). Need of vascular dietary improvement is defined by a VDS <8. Optimal dietary score is a VDS ≥8. Risky vascular dietary is a VDS ≤−1
Fifty-three subjects (21 %) had a favourable vascular diet with a VDS of 10·0 (se 0·2), whereas fifty-three had a risky vascular diet with a VDS of −3·3 (se 0·3). Dietary habits of both groups are detailed in Table 2.
Table 2 Dietary characteristics of subjects with a favourable diet against vascular disease and subjects with a risky vascular diet

F&V, fruit and vegetables; VDS, vascular dietary score calculated as (MUFA + n-3 PUFA + F&V) − SFA.
Results for the multivariate linear regression model found eight variables for which β reached significance. A positive significant association was found for five variables: age (β = 0·495, P < 0·0001), ‘sport ≥1 h/week’ (β = 0·253, P = 0·001), ‘walking 20 min/d’ (β = 0·161, P = 0·012), ‘former smoker’ (β = 0·118, P = 0·029) and previous nutritional advice (β = 0·105, P = 0·049). A negative significant association was found for three variables: men (β = −0·282, P < 0·0001), ‘alcohol ≥20 g/d’ (β = −0·216, P < 0·0001) and primary school (β = −0·156, P = 0·010). The R 2 coefficient of the model with these eight variables was 0·347 (P < 0·0001). None of the other variables reached statistical significance for β (‘living in a couple’, ‘having a child or children’, ‘treatment taking’, ‘smoker’, BMI, ‘university or equivalent’, ‘alcohol 10 g/d’). The histogram of normalized significant β values estimated from the model is presented in Fig. 3.
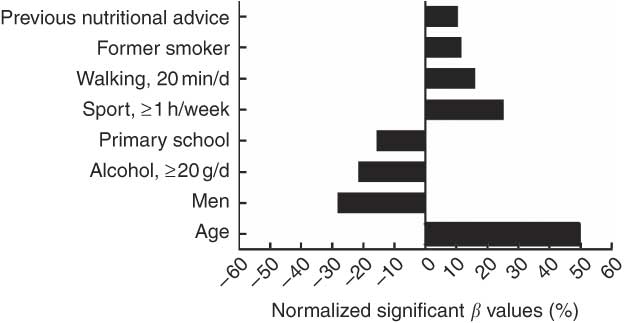
Fig. 3 Normalized significant β values (%) resulting from the model to explain the vascular dietary score (VDS). A positive β value means a positive association with a high VDS. A negative β value means an inverse association with a high VDS. Significant β value: P < 0·05. ‘Walking 20 min/d’ meant ‘light-to-moderate physical activity’; ‘sport ≥1 h/week’ meant ‘moderate-to-vigorous physical activity’; non-significant β values are not presented
None of the subjects found the dietary assessment with this FFQ uninteresting. Twenty-eight subjects (11·3 %) found it mildly interesting and 221 (88·7 %) found it very interesting (one datum missing). Two hundred and twenty-four subjects (89·6 %) estimated that dietary assessment should be performed by the GP, whereas twenty-six others (10·4 %) thought that other medical professionals should perform it, such as nurses or nutritionists.
Discussion
To the best of our knowledge, the present study is the first dietary evaluation for VD prevention using an extremely short validated FFQ performed in a GP’s office. We show that this FFQ with its calculated scores is a simple and fast tool to perform vascular dietary assessment for subjects in clinical practice. Moreover, the different scores representing different food groups give a rapid and global view of dietary habits for each subject and for each food group (SFA, MUFA, F&V, n-3 PUFA and n-6 PUFA) known to be associated with VD due to atherosclerosis(Reference Chiuve, Rexrode and Spiegelman3, Reference Knoops, de Groot and Kromhout5, Reference Kromhout, Menotti and Bloemberg6, Reference Mead, Atkinson and Albin9, Reference Trichopoulou, Costacou and Bamia23). The GP or physician who performs the assessment can immediately evaluate (and communicate to the subject) every subject’s scores, especially the VDS that could be considered as ‘the nutritional risk of atherosclerosis VD’. Then, the physician can give specific nutritional advice on bad scores without wasting time. The subject additionally receives his scores, which motivates him to improve his diet. A follow-up can easily be performed with such a tool because this FFQ had good reproducibility as previously shown(Reference Laviolle, Froger-Bompas and Guillo16).
In the present population, only 21 % had a favourable vascular diet represented by a VDS of ≥8. Drewnowski et al.(Reference Drewnowski, Fiddler and Dauchet20) found that only 3 % of the SU.VI.MAX population had ‘good diets’ applying the original 1995 Health Eating Index (HEI) developed by the United States Department of Agriculture(Reference Kennedy, Ohls and Carlson28). Although the mean age of the SU.VI.MAX population (49 years old) was quite similar to our population (51 years old), these differences can be explained by different reasons. First, the HEI did not evaluate specific diet for VD due to atherosclerosis(Reference McCullough and Willett29). Moreover, the SU.VI.MAX population had fewer women (56·7 %) than our population (63·6 %) and women are known to have better eating habits than men(Reference Prattala, Paalanen and Grinberga30). To complete these explanations, data of the SU.VI.MAX population were approximately collected 15 years ago. During this period, dietary habits and food composition patterns have changed(Reference Martin31). Furthermore, since 2001, a nutrition and health programme, Programme National Nutrition Santé (PNNS), including diet and physical activity recommendations has been carried out in France and disseminated widely to the general population(Reference Hercberg, Chat-Yung and Chaulia32). This can also explain why we found that 79 % of our population needed to improve their diet as opposed to 89 % of the SU.VI.MAX studied population. We also showed that 21 % of the present population had a VDS that was previously found to be associated with CHD, ischaemic stroke and carotid atherosclerosis(Reference Laviolle, Froger-Bompas and Guillo16, Reference Mahé, Ronzière and Laviolle18, Reference Froger-Bompas, Laviolle and Guillo24). People classified as having a risky vascular diet consumed 73 % more SFA on average than those classified as having a favourable vascular diet. A high consumption of SFA has been found to be associated with a higher risk of atherosclerosis VD(Reference Mead, Atkinson and Albin9, Reference Fung, Chiuve and McCullough33). Moreover, lower consumptions of protective food groups (F&V, MUFA, n-3 PUFA) was found in the risky vascular diet. These protective food groups have been repeatedly involved in the risk reduction of atherosclerosis VD(Reference Iqbal, Anand and Ounpuu8, Reference Lane, Magno and Lane12, Reference Fung, Chiuve and McCullough33, Reference He, Rimm and Merchant34). Fung et al.(Reference Fung, Stampfer and Manson11) suggested that a dietary habit typified by higher intakes of red and processed meats, refined grains and sweets and desserts may increase ischaemic stroke risk, whereas a diet higher in F&V, fish and whole grains may protect against stroke. These results were confirmed in the INTERHEART Study by Iqbal et al.(Reference Iqbal, Anand and Ounpuu8). These authors observed an inverse association between a ‘prudent diet’ characterized by a diet high in F&V and acute myocardial infarction, with higher levels being protective(Reference Iqbal, Anand and Ounpuu8). Moreover, Lane et al.(Reference Lane, Magno and Lane12) found that improved nutrition is associated with a reduced prevalence of PAD in the US population. Indeed, a higher consumption of specific nutrients, including antioxidants (vitamins A, C and E), vitamin B6, fibre, folate and n-3 PUFA, has a significant protective effect, irrespective of traditional cardiovascular risk factors(Reference Lane, Magno and Lane12). In secondary prevention of CVD, meta-analyses and systematic reviews found that reducing SFA associated with the addition of Mediterranean dietary advice reduces morbidity in patients with CVD(Reference Mead, Atkinson and Albin9). Lastly, Mozaffarian et al.(Reference Mozaffarian, Micha and Wallace10) have even suggested that consuming PUFA in place of SFA reduces CHD events in randomized control trials.
According to the nutritional recommendations of the French PNNS, our study confirmed the results of two other French studies in which subjects recruited through a media campaign had an unsatisfactory diet(Reference Castetbon, Vernay and Malon35, Reference Estaquio, Kesse-Guyot and Deschamps36). In our study, only 11·6 % had an F&V score corresponding to five servings per day. Estimations of MUFA, n-3 PUFA and n-6 PUFA intake for the whole studied population were 6·6, 0·6 and 3·4 g/d, respectively. This protective intake was lower than that expected in the French population(Reference Martin37).
Many factors were found to affect the VDS. Being a young man, consuming ≥20 g of alcohol per day, without doing regular physical activity and only with a primary-school level of education was associated with a poor vascular diet (low VDS). In contrast, being an old woman practising sports with no alcohol consumption and a university-level education was associated with a better vascular diet (high VDS). Previous studies have shown that aged subjects consume less red meat and more F&V, not only in France but also in other European countries(Reference Drewnowski, Fiddler and Dauchet20, Reference Drewnowski and Shultz21, Reference Westenhoefer38, Reference Inelmen, Toffanello and Enzi39), whereas young people eat more takeaway foods and refined products and sweets(Reference Volatier and Verger40–Reference Smith, McNaughton and Gall42). Furthermore, ageing induces physiological modifications (slower gastric emptying, changes in the chemosensory perceptual systems with a decline in gustatory and olfactory functions)(Reference Chatard-Pannetier, Rousset and Bonin43) and is related to increased health consciousness(Reference Naska, Fouskakis and Oikonomou19, Reference Johansson, Thelle and Solvoll44). Women are also known to have a better diet because they attach more importance to their weight and have better knowledge about healthy diet(Reference Westenhoefer38, Reference De Vriendt, Matthys and Verbeke45). Moreover, men eat more meat and less F&V. As previously shown by many studies, high alcohol consumption and low educational level are often associated with poor dietary quality(Reference Agudo and Pera46, Reference Padrao, Lunet and Santos47). Low educational level induces difficulties in understanding information about health and nutrition. Former smokers are also inclined to adopt a better diet because subjects may have modified their lifestyle, including dietary patterns, confirming another study(Reference Estaquio, Kesse-Guyot and Deschamps36). In addition, our results on physical activity are in accordance with previous studies(Reference Chiuve, McCullough and Sacks4, Reference Drewnowski, Fiddler and Dauchet20). High physical activity is associated with a higher VDS. Finally, previous nutritional advice leads to an improved diet(Reference Froger-Bompas, Laviolle and Guillo24). BMI was not found as an explanatory factor, but this FFQ evaluates the quality and not the quantity of food intakes. Furthermore, using this FFQ, snack intake was not taken into account. Most of the explanatory factors found for the VDS in the present study are similar to many others that studied non-specific diets(Reference Drewnowski, Fiddler and Dauchet20, Reference Estaquio, Kesse-Guyot and Deschamps36).
The last interesting contribution of our study concerned the subjects’ acceptance of dietary assessment, which was found to be very high. This invites us to extend this type of dietary screening to a larger population.
The present study has some potential limitations. First, it was a monocentric study performed in a GP’s office in only one French region, and thus the external validity of our results could be called into question. It should be kept in mind that the present study tried to show the interest of such a questionnaire in clinical practice and not to define the whole diet of the French population. Regarding the external validity of our results, it is important to note that the city where the GP’s office is located is semi-rural. In this type of city, 20–40 % of the population work in urban areas and the rest work in rural areas. Thus, the differences in dietary patterns between rural and urban areas were limited(Reference Holcomb48, Reference Scali, Richard and Gerber49). Although the present study was conducted in France, we could suppose that this useful questionnaire is also applicable to other Western countries because it evaluates specific food groups which are consumed in most other Western countries(Reference Iqbal, Anand and Ounpuu8). Second, the VDS score value we used to consider the diet as ‘favourable’ or ‘risky’ was based on the results of previous studies(Reference Laviolle, Froger-Bompas and Guillo16, Reference Mahé, Ronzière and Laviolle18) and the roles of food groups were based on the literature. It is important, however, to point out that no study has determined a clinical cut-off using the VDS through a prospective cohort study. Thus, it cannot be ascertained that a ‘favourable’ diet means a ‘low-risk’ diet and a ‘risky’ diet means a ‘high-risk’ diet. This issue needs to be addressed in order to determine potential relationships between different VDS score values and the risk for developing CVD. As an initial and essential step, the present study performed in a GP’s office, together with the results of previous studies using the FFQ in vascular patients, showed that the questionnaire used was an objective, rapid and easy tool to assess dietary pattern in a somewhat important subject cohort. This now opens new perspectives to conduct a prospective cohort study.
Conclusion
The present study showed that a simple dietary assessment in clinical practice could be performed for prevention of VD due to atherosclerosis. The VDS gives, for each subject, rapid and objective nutritional information, which can help GP or physicians to give advice to subjects. Different factors were associated with poor vascular diet as age, gender, physical activity, educational status, previous nutritional advice and alcohol consumption. Factors that influence the VDS have to be taken into account for the nutrition health programme. Such dietary evaluation is well accepted by the population. Then, the battle against this modifiable risk factor, poor diet, must be carried out in order to reduce VD and the cost of these diseases.
Acknowledgements
The authors declare that there is no source of funding/conflict of interest to express. All the authors had full access to all the data in the study and take responsibility for the integrity and the accuracy of the data. G.M. performed the statistical analysis. G.M. and M.C. contributed to the conception and design, analysis and interpretation of the data, have done the critical revision of the manuscript for important intellectual content and supervised the study. M.C. and J.-P.D.B helped the data acquisition; G.M., M.C. and M.Z. contributed to the drafting of the manuscript; G.M., M.C., M.Z. and J.-P.D.B provided administrative, technical or material support.


