


The measurement of dietary patterns has long been a challenge(Reference Moeller, Reedy and Millen1, Reference Ashima2). Most work on dietary pattern analysis to date has used conventional methods such as factor analysis(Reference Flood, Rastogi and Wirfält3) and cluster analysis(Reference Bailey, Gutschall and Mitchell4) to discern patterns from collected data, or have used a priori approaches such as Healthy Eating indices(Reference Guenther, Reedy and Krebs-Smith5) to assess the main components of diet. These components include fruits and vegetables, meat or occasional foods (energy-dense nutrient-poor foods) such as cakes and cookies, soft drinks, fast foods, etc.(6).
Recently, alternative statistical techniques such as latent class analysis (LCA) have begun to be used in dietary research(Reference Padmadas, Dias and Willekens7, Reference Wang, Worsley and Cunningham8). LCA is a form of non-parametric cluster analysis and it can be used for identifying classes of individuals with comparable profiles. For example, LCA allows the identification of groups of individuals that are similar based on their food preparation characteristics. That is, LCA can be used to determine and enumerate the number of groups with similar meal preparation patterns; distinguish preparation patterns that characterise groups well (e.g. high variety of dishes); estimate the prevalence of the groups; and classify individuals into groups. LCA is a person-centred rather than variable-centred (e.g. factor analysis) technique.
Typically, the frequency lists of individual food frequencies have been analysed. Such studies suggest that some patterns are associated with poor health outcomes, others (so-called prudent diets(Reference Slattery and Potter9)) with better health outcomes. However, few studies(Reference Berteus Forslund, Lindroos and Sjostrom10) have examined patterns of meal intake, despite the fact that most foods are eaten in recognisable, memorable, combinations at one time (often referred to as meals, courses or dishes).
Examination of meal preparation patterns might allow better understanding of both the antecedents of preparation and the possible effects of food intake on health status. In 2009, Meat and Livestock Australia (MLA, the peak body for the Australian meat industry) undertook a nationwide survey of consumers' food consumption, with special focus on main meal consumption of a variety of dishes(11). Subsequently, in 2011, MLA commissioned a second national survey, The Weekly Meal Repertoire(12), which assessed the preparation of various evening meals and elicited details of demographics and indices of other variables that were considered likely to be associated with preparation of these dishes.
The data from the survey provide the opportunity to test the use of LCA to identify discrete groups of preparers and to examine the association of demographics and psychological predictors with the preparation of a variety of dishes. We wanted to test several hypotheses about the likely associations of these variables, as follows.
Demographic influences
Whilst there is much evidence about the influence of demographic factors on intakes of individual foods, we wanted to see if these influences also affect patterns of meal preparation. These factors include age, sex, household income and education, marital status, life stage and the presence or absence of children.
Age, life stage and children
As people age, their material circumstances change from early adulthood (18–44 years) to middle adulthood (45–64 years)(Reference Skrabski, Kopp and Kawachi13). For many, the period between 18 and 45 years is about high financial costs associated with children and the time scarcity associated with the need to work for income to meet expenses(Reference Higgins, Duxbury and Lee14). As children grow up and become independent, financial pressures may ease, but the impact of health conditions is likely to increase(Reference Leveille, Wee and Iezzoni15). Among various lifestyle determinants, healthy eating plays an important role in people's health(Reference Trichopoulou, Costacou and Bamia16). Therefore, a key aim in the present analyses was to compare the preparation patterns of main meals and their possible antecedents between two broad age groups, i.e. 44 years and younger and 45 years and older.
Sex and socio-economic influences
Sex differences in food preferences and practices are pronounced(Reference Beardsworth, Bryman and Keil17), and household income and education have been reported as significant determinants of food choice in the nutrition literature(Reference Drewnowski and Specter18, Reference Thiele, Mensink and Beitz19). Differences in food intake appear to be associated with marital status(Reference Schafer, Schafer and Dunbar20, Reference Umberson21), in that dietary quality tends to be higher among married people. Therefore, we hypothesised that people's background characteristics (i.e. sex, household income, education and marital status) would be related to their meal preparation patterns. We expected that high levels of education and household income would be associated with the preparation of a high variety of main meals, as several studies have linked these factors to consumption of a wide variety of individual foods(Reference Turrell, Hewitt and Patterson22–Reference Worsley, Blasche and Ball24). We also expected that women would consume a greater variety of meals and fewer beef dishes than men because of their known health consciousness and lesser preference for beef(Reference Beardsworth, Bryman and Keil17, Reference Worsley and Scott25).
Influence of children
Among very few studies about the impact of children's presence on family food choice, Laroche et al. (Reference Laroche, Hofer and Davis26) showed that the presence of children in the household was associated with significantly higher total and saturated fat intakes and these were linked to greater intakes of high-fat foods such as salty snacks, pizza, cheese, beef, ice cream, cakes/cookies, bacon/sausage/processed meats and peanuts. Moreover, Burke et al. (Reference Burke, Beilin and Dunbar27) found higher energy consumption among women with children than women without children. Thus, the presence of children makes an impact on family food patterns. We hypothesised that meal preparation patterns would vary by the presence or absence of children in a household – families with children would prepare a greater variety of dishes.
BMI
There are positive associations between overweight, obesity and the consumption of energy-dense, nutrient-poor foods(Reference Drewnowski28, Reference Booth, Blair and Lewis29). Therefore, we hypothesised that people who were normal weight would be more likely to prepare healthy meals, such as meals containing energy-dense but nutrition-rich foods.
Cooking confidence and skills
Several studies(Reference Wrieden, Anderson and Longbottom30, Reference Stead, Caraher and Anderson31) have shown that confidence and skills in cooking and food preparation contribute to the improvement of dietary quality, as in general, home-prepared meals are healthier than processed foods or foods prepared and consumed outside the home(Reference Guthrie, Lin and Frazao32). For example, confidence in seasonal food knowledge may be associated with making tasty meals using fresh produce in season. Therefore, we hypothesised that people's cooking confidence and skill would be positively associated with their preparation of healthy main meal dishes.
Values orientation
Universalist values(Reference Schwartz, Melech and Lehmann33) refer to a strong orientation towards caring for others and the environment. Our previous studies showed that there were strong links between this value orientation and food consumption. For example, Worsley(Reference Worsley34) found that people who held strong universalist values were most supportive of healthy eating policies. Furthermore, Lea(Reference Lea35) and Worsley et al. (Reference Worsley, Wahlqvist and Dalais36) demonstrated strong associations between vegetarian diets and soya products, and universalist values. Schwartz et al.'s study of personal values(Reference Schwartz, Melech and Lehmann33) showed an internal consistency reliability range of 0·57–0·62. The test–retest reliability was found in the range of 0·67–0·82(Reference Schwartz, Melech and Lehmann33, Reference Lindeman and Verkasalo37) for the universalist scale for its nine-point response option. In the present survey, a five-point response scale was used to reduce response burden. We hypothesised that people who held strong universalist values would less prefer meat dishes than those with lesser universalist values.
In summary, the present study aimed to:
(1) Examine the number of distinct types (latent classes) of preparation patterns of main meal dishes among Australian adults aged 44 years and younger and 45 years and older.
(2) Examine the influences of several likely predictors on identified class membership.
Methods
Procedure
The survey questionnaire – The Main Meal Repertoire Questionnaire – was administered online by The Clever Stuff Market Research Private Limited on behalf of the MLA to a quota sample of Australians aged between 18 and 65 years across metro and rural areas of six states and territories, Australia. The data collection followed the Ethical Code of Practice of the Australian Marketing Association. Consent was implicit in the respondents' completion of the survey questionnaire. The authors were licensed by the MLA to analyse the de-identified dataset for the present paper. A total of 1076 people within the age range completed the online questionnaire. The two central inclusion criteria were that the participants must be aged between 18 and 65 years and be the main or joint meal preparer in the household. Table 1 provides an outline of the participants' demographic characteristics, BMI, presence of children at home, food cooking confidence and universalist value orientation.
Table 1 Personal background characteristics across age groups (Percentages or mean values and standard deviations)

TAFE, training and further education; Tertiary, under- and post-graduate education.
The questionnaire
Background characteristics
Socio-demographic information was collected, which included age, sex, household income, marital status, education, self-reported height and weight for the calculation of BMI, cooking confidence, having children at home and personal values. Separate analyses were carried out across age groups (i.e. 44 years and younger and 45 years and older). Being male and having children at home were reference categories for the binary variables sex and children at home. Marital status was re-coded into binary variables and the corresponding reference categories were single/divorced/separated/widowed (v. married/cohabiting). In addition, household income, education, cooking confidence including seasonal food knowledge (i.e. make a tasty meal using fresh produce in season) and the personal value of universalism were ordered categorical variables, with higher scores indicating higher levels of household income, education, confidence in seasonal food knowledge and greater importance in value orientation. A continuous BMI variable (i.e. BMI = weight (kg)/height (m)2) was calculated based on the height and weight reported by the participants and used in the analysis. Self-reported weights and heights are valid for determining associations in epidemiological studies(Reference Venn, Thomson and Schmidt38, Reference Spencer, Appleby and Davey39).
Main meals
As part of the Main Meal Repertoire survey, a checklist of eighty-one dishes prepared for main meals by the participants in their homes during the past 6 months was administered. The checklist used dichotomous response scales with ‘0’ representing no preparation and ‘1’ indicating that the dish was prepared. The question that the respondents were required to answer was ‘Thinking about the last 6 months which of the following dinners have you prepared in the home? We are only interested in what you have prepared for the main meal, not any side dishes or starters’. To minimise the complexity of the data analysis, the present paper reports the top 40 %, which was thirty-three out of eighty-one main meals that were prepared most frequently by the respondents.
Analytical procedure
Similar to factor analysis for continuous latent variables, LCA accommodates an analogous framework for measuring categorical latent variables(Reference Lanza, Collins and Lemmon40). LCA allocates a sample population into mutually exclusive and exhaustive subgroups(Reference Goodman41). In the present study, the response patterns of the thirty-three dietary questions were subjected to LCA to identify the number of classes to which the respondents may belong. LCA was carried out with Mplus version 6.1(42) for both age groups (i.e. 44 years and younger and 45 years and older) separately. The maximum likelihood estimation method was used to estimate the standard errors of the present analyses.
The performance of two, three and four latent class models was assessed. Of these three competing latent class models, the selection of the best-fitting model was subject to several statistical fit indices as well as theoretical considerations. The literature has shown that the Akaike information criterion(Reference Akaike43) and the Bayesian information criterion(Reference Schwarz44) are commonly used for LCA assessment(Reference Lanza, Collins and Lemmon40). In addition, the sample-size-adjusted Bayesian information criterion(Reference Sclove45) has demonstrated notable success in determining the number of classes from competing LCA models(Reference Yang46). The information criteria are goodness-of-fit measures that incorporate various penalties for model complexity(Reference Sclove45). Smaller values indicate better fit. The parametric bootstrap likelihood ratio test (BLRT)(Reference McLachlan and Peel47) uses bootstrap samples to estimate the distribution of the log likelihood difference test statistic and it compares the estimated model with a model with one fewer class than the estimated model. A significant BLRT P value suggests that the model with one fewer class should be rejected in favour of the estimated model. The BLRT proves to be a relatively consistent indicator of classes(Reference Nylund, Asparouhov and Muthén48). Entropy is a standardised summary measure of the classification accuracy of placing participants into classes on the basis of their posterior probabilities(Reference Ramaswamy, Desarbo and Reibstein49). It can range from 0 to 1, with higher values indicating better classification. Moreover, higher values of the log likelihood test statistic suggest better model fit. In the present study, six statistical fit indices were considered to determine the best number of classes: the log likelihood value, the Akaike, Bayesian and adjusted Bayesian information criteria, BLRT P value and an entropy measure.
Furthermore, the model is estimated to be conditional on the covariates(Reference Lanza, Collins and Lemmon40) in which the suitable latent classes were regressed on respondents' background characteristics, including sex, household income, marital status, education, BMI, having children at home, confidence in seasonal food knowledge and universalism value orientation. All of these factors are considered as possible influences of population heterogeneity on their main meal dish preparations. The probability of belonging to each of the classes was predicted for each respondent using multinomial regression. The covariates predict the log odds of the probability of belonging to a given class compared with the probability of belonging to the reference class. Incorporating covariates into conditional probabilities, individuals' characteristics that determine responses other than underlying class structure can be adjusted(Reference Huang and Bandeen-Roche50).
Results
Table 2 presents prevalence estimates for the thirty-three main meal dishes included in the LCA. The prevalence of the preparation of these dishes, for the younger group, ranged from the lowest, 38 % (pork chops), to the highest, 75·6 % (meat, fish and chicken fillet). However, for the older group, sandwich wrap was prepared at the lowest rate (31·1 %) and ‘meat, fish and chicken fillet’ was prepared the most (78 %), reflecting a wide range of meals captured within the analyses.
Table 2 Prevalence of meat and vegetable dishes across age groups (Number of respondents and percentages)

Latent class results
To identify the appropriate number of classes, a two-class model was initially fitted to the data and successively compared with models that specified an increasing number of latent classes. In selecting the optimal model solution, a set of statistics including the log likelihood, Akaike information criterion, Bayesian information criterion, sample-size-adjusted Bayesian information criterion, parametric BLRT test P value and entropy was examined. Table 3 shows the model fit statistics derived from LCA for the two to four latent class models for both age groups when the thirty-three main meal dishes and the covariates of sex, household income, marital status, education level, BMI, children's presence, seasonal food knowledge and universalist values were included in the model.
Table 3 Criterion to assess model fit for age group-specific latent class analysis models with covariates

AIC, Akaike information criterion; BIC, Bayesian information criterion; aBIC, sample-size-adjusted Bayesian information criterion; PBLRT, parametric bootstrap likelihood ratio test.
* No. of parameters = K− 1+K× r+c× (K− 1), where K is the number of class, r is the number of indicators and c is the number of covariates.
An examination of Table 3 suggests a four-class solution for both age groups based on the higher log likelihood statistic values and the parametric BLRT P value; the smallest Akaike information criterion and sample-size-adjusted Bayesian information criterion; and the highest entropy. However, it can be seen that a three-class model is favoured by the lowest Bayesian information criterion for the older age group. Nevertheless, based on the fact that the determination of the number of classes depends on a combination of factors including fit indices, theoretical justification and interpretability, a four-class model was deemed to be the most appropriate solution for both age groups.
The response probabilities for each of the thirty-three main meal dishes are presented for each of the latent classes in Table 4. These probabilities can be used to characterise the four latent classes. The four distinct latent classes of the main meal dishes for people who were aged 44 years and younger and 45 years and older are as follows:
Table 4 Latent class models with covariates across age groups – probability of latent class membership and item response probabilities within each of the four classes

Class 1 – high variety
This group reported the highest probabilities of endorsing main meals across all the thirty-three dishes from 0·58 (pork chops) to 0·95 (spaghetti bolognaise) for people aged 44 years and younger (Table 4, second column) and 0·58 (meatballs) to 1·00 (spaghetti bolognaise, fish steak) for people aged 45 years and older (Table 4, fifth column). The class represented 36·5 and 20·7 % of the younger and older age groups, respectively. Generally, this group prepared a wide variety of main meal dishes.
Class 2 – moderate variety
This class constituted 42·1 and 39·9 % of the younger and older age groups, respectively, and was the largest group for both age groups. For example (Table 4, columns three and six), dishes were reported with the probabilities ranging from 0·28 (sandwich/wrap) to 0·81 (spaghetti bolognaise) by the younger group and from 0·25 (sandwich/wrap) to 0·86 (spaghetti bolognaise) by the older group. This group was similar to class 1, but tended to prepare a moderate rather than a high variety of the dishes.
Class 3 – high protein but low beef
These respondents had low probabilities on the beef dishes, but high probabilities on the vegetarian dishes. For example (Table 4, columns four and eight), the younger age group reported a low probability of roast beef preparation of 0·03 and a higher probability of vegetarian salad meals of 0·76, while the older group reported a low probability of beef pie preparation of 0·11 and a higher probability of vegetable soup preparation of 0·83. Nevertheless, more high-protein dishes were prepared, for example, 0·71 (fried eggs) by the younger group and 0·80 (fish (fillet or whole)) by the older group. This class comprised 12·2 and 14·8 % of the younger and older age groups, respectively.
Class 4 – low variety
This class reported the lowest probabilities of preparation of the thirty-three dishes, ranging from 0 (beef burritos, tacos, nachos and meatballs) to 0·39 (sandwiches) for the younger group and from 0·02 (sandwich wrap) to 0·57 (fish steak) for the older group (Table 4, columns five and nine). The class represented 9·2 and 22·6 % of younger and older age groups, respectively. This was the smallest class for the younger group and the second largest group for the older groups, which suggests that very few younger people, but quite a lot of older people, prepared a low variety of main meal dishes.
Overall, the meal preparation patterns were similar between the younger and the older age groups for the four classes identified (see Fig. 1). However, there were dissimilarities in class percentages among the two age groups. The composition of classes for both age groups were class 1 (high variety): 36·5 v. 20·7 %; class 2 (moderate variety): 42·1 v. 39·9 %; class 3 (high protein but low beef): 12·2 v. 14·8 %; and class 4 (low variety): 9·2 v. 22·6 % for people aged 44 years and younger and 45 years and older, respectively.
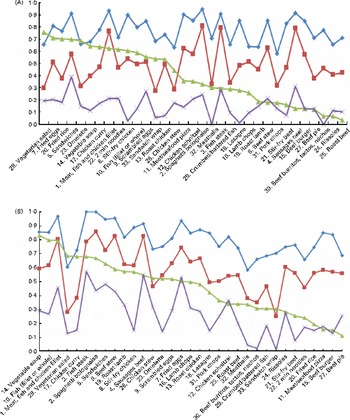
Fig. 1 Main meal dish preparation patterns across thirty-three dishes by the younger and older age groups. (A) People aged 44 years and younger (n 635). ![]() , Class 1 (36·5 %);
, Class 1 (36·5 %); ![]() , class 2 (42·1 %);
, class 2 (42·1 %); ![]() , class 3 (12·2 %);
, class 3 (12·2 %); ![]() , class 4 (9·2 %). (B) People age 45 years and older (n 441).
, class 4 (9·2 %). (B) People age 45 years and older (n 441). ![]() , Class 1 (20·7 %);
, Class 1 (20·7 %); ![]() , class 2 (39·9 %);
, class 2 (39·9 %); ![]() , class 3 (14·8 %);
, class 3 (14·8 %); ![]() , class 4 (22·6 %). (A colour version of this figure can be found online at http://www.journals.cambridge.org/bjn).
, class 4 (22·6 %). (A colour version of this figure can be found online at http://www.journals.cambridge.org/bjn).
As part of the LCA, multinomial logistic regression results were derived for the younger and older age group samples. Classes 1 (high variety), 2 (moderate variety) and 3 (high protein but low beef) were compared with class 4 (low variety) in order to interpret the associations between class membership and the covariates: sex, household income, marital status, education, BMI, children's presence at home, confidence in seasonal food knowledge and universalism value orientation. The estimated log-odds coefficients and the corresponding log-odds CI were then converted into OR and their corresponding 95 % CI (see Table 5).
Table 5 Estimated OR and 95 % CI between classes with covariates across age groups (Odds ratios and 95 % confidence intervals)

Class 1, high variety; class 2, moderate variety; class 3, high protein low beef; class 4, low variety.
Values were significantly different for the multinomial logistic latent class regression weights: * P< 0.05, ** P< 0.01.
Associations among people aged 44 years and younger
Sex
Women were two-and-half times more likely to be in class 1 (high variety) v. class 4 (low variety) than men were. Moreover, women were nearly three times more likely than men to be in class 2 (moderate variety) rather than class 4 (low variety).
Education
People who had a higher level of education were almost two-and-half times more likely to be in class 3 (high protein but low beef) than class 4 (low variety), when compared with people who reported a lower level of education.
BMI
As people's BMI increased, the odds of being in class 3 v. class 4 decreased. In other words, people with a higher BMI were 9 % less likely to be in class 3 (high protein but low beef) than people with a lower BMI.
Presence of children
For people who had children living at home, the odds of being in classes 1 (high variety) and 2 (moderate variety) v. class 4 (low variety) were over ten times and eight times, respectively, higher than for people without children at home.
Confidence in seasonal food knowledge
People with more confidence were nearly three times more likely to be in class 3 (high protein but low beef) rather than in class 4 (low variety), than people without confidence in seasonal food knowledge.
No other statistically significant associations with class membership were found.
Associations among people aged 45 years and older
Marital status
In contrast to the under 44 years and younger group, marital status was significantly associated with class membership. For example, the odds of being in classes 1 (high variety) and 2 (moderate variety) v. class 4 (low variety) were almost five-and-half times and four times, respectively, higher for married and de facto married people than for single, divorced or widowed people.
Education
The odds of being in class 3 (high protein but low beef) v. class 4 (low variety) were almost three times higher for people who had a higher level of education.
Children's presence
The odds of being in class 1 (high variety) v. class 4 (low variety) were over three-and-half times higher for families with children than without children in the household.
Seasonal food knowledge
The odds of being in classes 1 (high variety) and 2 (moderate variety) v. class 4 (low variety) were nearly three and two times, respectively, higher for people who had higher confidence in seasonal food knowledge than people who had no confidence.
Universalism
For older people, who held strong universalism values, the odds of being in classes 1 (high variety) and 3 (high protein but low beef) v. class 4 (low variety) were almost three times and over six times, respectively, higher than people who did not value universalism. Interestingly, these associations were not found among the younger population.
Generally, the associations between class membership and the covariates yielded differences between the age groups. While sex, education, BMI, children's presence at home and confidence in seasonal food knowledge were related to class membership among the younger age group, marital status, education, seasonal food knowledge and universalism values were associated with class membership among the older age group.
To minimise the complexity of the LCA, the present paper has reported the top 40 % of meals (thirty-three out of eighty-one main meals) that were prepared most frequently by the respondents. χ2 Tests were conducted to examine the meal preparation patterns for the forty-eight less frequently prepared meals between the classes. For the younger group, 93·4 % of the less frequently prepared meals were significantly different across the four classes, while very few meals showed no class difference such as meals termed ‘other pasta dish’ and ‘other burger’. The preparation frequencies ranged from 4·7 to 62 % (class 1), 1·5 to 31·6 % (class 2), 3·9 to 63·2 % (class 3) and 0 to 16·9 % (class 4). For the older group, 91·5 % of the less frequently prepared meals were significantly different across the four classes, but meals termed ‘other curry meat/fish’ or ‘other burger’ showed no class difference. The preparation frequencies ranged from 4·1 to 71·1 % (class 1), 1·7 to 42·5 % (class 2), 1·6 to 45·3 % (class 3) and 0 to 22 % (class 4).
Overall, the less frequently prepared forty-eight meals showed similar patterns between the classes as the thirty-three frequently prepared meals. Noticeably, class 3 (high protein but low beef) showed quite high frequency ranges for the younger age group. This is because these meals comprised several vegetarian meals, which is consistent with previous studies(Reference Lea and Worsley51, Reference Lea, Crawford and Worsley52) that younger people are more interested in vegetarian diets.
In summary, four preparation patterns of main meal dishes were identified for people aged 44 years and younger and 45 years and older. The highest proportion of participants was classified into the class of moderate variety for both age groups, followed by the high variety class for the younger group and the low variety class for the older group, high protein but low beef class for the younger group and high variety class for the older group. The smallest proportion of younger respondents belonged to the class of low variety and, among the older respondents, to the high-protein, low-beef class. Furthermore, various combinations of covariates were associated with class membership in the two age groups.
Discussion
Overall, the four preparation patterns (classes) of main meals identified by the LCA were predictable by sex, marital status, education, BMI, children's presence at household, seasonal food knowledge and universalism values.
Classes 1 and 2 represent high and moderate variety meal classes, respectively. The findings suggest that the preparations of all the thirty-three main meal dishes were in moderate frequencies for most of the younger and older participants, and in high frequencies for more of the younger people and fewer of the older people. These meal patterns are in line with the national dietary recommendations(6), as by eating a wide variety of meal dishes, a diverse range of foods with different colours, tastes, textures and smells and nutrient properties are consumed. Many of these naturally occurring ingredients are likely to be beneficial to health(Reference Savige53). Noticeably, the frequencies of preparation of variety of meals decreased among the older group, which may be associated with age, as physiological functions decline with age(Reference Brownie54).
Sex
The findings suggest that younger females were more likely to be in the high (class 1) and moderate (class 2) variety meal classes v. low variety class (class 4), than their male counterparts, which corresponds with the present hypothesis and previous findings from the food literature. For example, Beardsworth et al. (Reference Beardsworth, Bryman and Keil17) showed that women were more likely to make dietary changes in line with recommendations and women had higher levels of health knowledge than men, as dietary variety is positively associated with low body weight and adequate macronutrient(Reference Roberts, Hajduk and Howarth55). However, this sex difference was not found within the older population.
Marital status
For the older age group, people who were in married or in de facto relationships were more likely to prepare a high or moderate variety of main meal dishes. This finding supports the present hypothesis and is consistent with Schafer et al. (Reference Schafer, Schafer and Dunbar20), who provided clear evidence of the importance of family food interactions for the diet quality of marital partners, and Umberson(Reference Umberson21), who demonstrated that the transition from married to unmarried status is associated with an increase in negative health behaviour. Furthermore, Michels & Wolk(Reference Michels and Wolk56) showed that a lower variety of foods was associated with non-marital status.
Education
Class 3 exhibits a high protein but low beef preparation pattern. People who had a higher level of education were more likely to be in this class for both age groups, which is consistent with Worsley et al. (Reference Worsley, Blasche and Ball23) that university-educated people were less likely to be regular consumers of several meat products and Gossard & York's(Reference Gossard and York57) finding that education was inversely related to meat consumption. This finding supports the present hypothesis.
BMI
Among the younger group, people who had a lower BMI were more likely to prepare high-protein but low-beef dishes for their main meals. This finding confirms that people with lower body weight eat healthier foods and is consistent with Booth et al. (Reference Booth, Blair and Lewis29). It may also be related to the greater satiety provided by high-protein meals(Reference Noakes and Clifton58). However, this relationship was not found among the older age group. With people aged over 45 years, body weight may also be confounded by other physiological factors such as changes in body composition, chronic disease and inactivity among older adults.
Children's presence
For both age groups, children's presence in the household was strongly associated with class membership. Food preparers in both age groups who had children at home were more likely to prepare a high variety of meals and a moderate variety of meals among the younger age group. This supports the present hypothesis and is supported by Laroche et al. (Reference Laroche, Hofer and Davis26) that families with children consumed various types of foods compared with families without children. This finding may be partly due to various forms of nutrition promotion over the years recommended by the Dietary Guidelines for Children and Adolescents in Australia(59) as well as to the high value and prominence placed on children in Australian society(Reference Huntley60).
Seasonal food knowledge
Seasonal food knowledge was also a determinant of class membership for both age groups. People who had confidence in seasonal food knowledge were more likely to prepare a high variety of main meal dishes in both age groups and to prepare a moderate variety of meals in the older age group. Food knowledge appears to be important in food preparation, and is associated with cooking skills and the ability to make meals from fresh ingredients(Reference Caraher, Dixon and Lang61, Reference Fordyce-Voorham62). The finding is supported by the literature(Reference Wrieden, Anderson and Longbottom30, Reference Stead, Caraher and Anderson31).
Seasonal food knowledge was also related to the preparation of high-protein but low-beef meals among the younger group. Previous studies have shown that lack of confidence in food preparation is one of the barriers to choosing healthy foods(Reference Hughes, Bennett and Hetherington63). The finding supports the present hypothesis and is in line with Stead et al. (Reference Stead, Caraher and Anderson31) and Wrieden et al. (Reference Wrieden, Anderson and Longbottom30) that dietary quality would be improved by people's food knowledge and skills. It suggests that younger people with sufficient seasonal food knowledge could make equally nutritious main meal dishes without using beef. However, the relationship between seasonal food knowledge and eating high protein but low beef was not found among the older age group. This may be due to the fact that older people are generally more confident in using a wider range of knowledge and skills than their younger counterparts(Reference Caraher, Dixon and Lang61).
Universalism
For the older age group, people who held strong universalism values were more likely to prepare a high variety of meal dishes. This may be because communitarian values like universalism are positively related to dietary quality, as universalists tend to show concern for the welfare of members of their own in a group, including family(Reference Worsley, Wang and Hunter64). The finding supports the present hypothesis.
As expected, older people who held strong universalist values were more likely to prepare high-protein but low-beef dishes. The finding confirmed the present hypothesis and is also supported by the studies of Worsley(Reference Worsley34), Lea(Reference Lea35) and Worsley et al. (Reference Worsley, Wahlqvist and Dalais36). However, the relationship was not shown within the younger population.
The LCA technique is capable of determining the number and composition of groups in which participants are aggregated on the basis of their preparation of main meals. LCA would seem to be an optimal choice of analysis to capture dietary patterns. The present study suggests that LCA could be applied to a greater extent in behavioural nutrition. For example, once individuals are classified into various classes of food intake patterns, the outcome variables, such as their health conditions, may be predicted by their class memberships. In particular, the high variety group appears likely to be associated with lower prevalence of various diseases such as type 2 diabetes(Reference Pan, Sun and Bernstein65). In contrast, the European Prospective Investigation into Cancer and Nutrition study suggests that preparation of high-protein but low-beef meals may be associated with better health outcomes(Reference Davey, Spencer and Appleby66). LCA would provide one way of examining such effects of eating patterns.
Limitations
The study showed that large percentages of participants were preparers of a moderate variety of main meals. However, it should be noticed that a relatively large percentage of the older group was in the low variety class 4, which raises the question of what other foods did they prepare in the past 6 months? Subsequent analyses showed that this group of participants prepared few of the forty-eight dishes that had not been included in our main analyses, probabilities ranging from 0 (fish pie) to 22 % (meat soup). Therefore, these older adults' diets probably would not meet their nutritional needs. It underscores the requirement for health education to improve older people's present food intake behaviours.
Preparation of a high variety of foods is positively related to health(Reference Kellett, Smith and Schmerlaib67). However, the actual healthiness of the preparation patterns identified in the present study needs to be investigated in a future study, especially for classes 1 and 2, which included various meat dishes.
Other variables might be related to meal patterns such as timing, regularity, types of people present, location, etc.(Reference Holm and Kjaernes68). Within the older population, there may be other factors (e.g. health condition, food accessibility) that affect their dietary patterns(Reference Wilson, Alexander and Lumbers69). Therefore, future studies need to examine these predictors that are possible determinants of meal patterns in particular populations.
In the present study, only one of the food knowledge and skill variable (i.e. seasonal food knowledge) was found to be related to class membership for both groups. This may be due to inadequate measurement of this set of items. Future research requires the development of psychometrically sound food knowledge and skill measures.
Implications
The identification of classes of meal users should enable better communication of messages to these groups. For example, people in the low variety class may need to be encouraged to prepare healthier dishes more often. Healthy eating messages could be tailored to improve the meal patterns used by these groups. Future studies should also examine the preparation and consumption patterns of breakfast, lunch and snack meals. Moreover, the concept of meals may be useful for health communication, because people may find it easier to change their meals rather than adopt new individual foods.
Finally, among various predictors of class memberships, socio-psychological factors, including confidence in seasonal food knowledge and universalism values, are more amenable to change than people's socio-economic characteristics. These psychological determinants can be communicated and moderated via health communication approaches.
Conclusion
LCA identified four major groups of preparers with different main meal preparation patterns. These patterns were differentially associated mainly with sex, education, marital status, children's presence at home, confidence in seasonal food knowledge and universalism values among younger and older food preparers.
Acknowledgements
The authors thank Ms Veronique Droulez, Nutrition Manager of MLA, for her support and encouragement; V. H. (The Clever Stuff Market Research Private Limited), who conducted the survey from which the data were derived; and MLA Private Limited for providing access to the dataset. This research received no specific grant from any funding agency in the public, commercial or not-for-profit sectors. The authors declare that they have no competing interests. W. C. W. performed the data analyses and the writing of the manuscript. A. W. provided valuable comments on the manuscript construction and data analyses. V. H. conducted the survey and provided comments on the manuscript.


