


Income and education have frequently been used to describe socio-economic status (SES) in the USA, while occupation has been more widely included in European studies(Reference Braveman, Cubbin and Egerter1). Using these indicators, the inverse association between obesity (OB) and SES among adults has been well documented in industrialised countries(Reference Ball, Mishra and Crawford2, Reference Sobal and Stunkard3), including France(Reference Charles, Eschwege and Basdevant4–Reference Vernay, Malon and Oleko6). However, the relationship of SES to OB is likely to vary according to the dimension used to define the socio-economic position. On the one hand, different socio-economic factors cannot be assumed to be interchangeable(Reference Braveman, Cubbin and Egerter1). On the other hand, ‘controlling for SES’ while including several measures of SES in multivariate epidemiological models may lead to collinearity and over-adjustment. Thus, recent reviews have emphasised the relevance of studying several SES factors, either separately or synthesised within a composite index(Reference Roskam and Kunst7, Reference Wardle, Waller and Jarvis8). In this context, we used the data from the French second National Individual Survey on Food Consumption (INCA 2) dietary survey (2006–07) to investigate the associations between adult OB and comprehensive dimensions of SES: education, occupation and household wealth. These relationships were explored in a methodological perspective both considering these three factors independently and deriving composite indices.
Research methods and procedures
Subjects and study design
The cross-sectional French INCA 2 dietary survey (2006–07) was primarily designed to assess food intake patterns of a nationally representative sample(Reference Lioret, Dubuisson and Dufour9, Reference Dubuisson, Lioret and Touvier10). Briefly, subjects were drawn on the basis of a multistage cluster sampling technique(Reference Dufour, Lafay, Volatier, Guilbert, Haziza, Ruiz-Gazen and Tillé11). The sampling frame was established from the national census, with a response rate of 63 % in adults. The present study included 2324 adults from the 2624 subjects aged between 18 and 79 years (twenty-eight pregnant women were excluded along with 272 individuals with missing data).
The INCA 2 survey was approved by the French data protection authority (Commission Nationale Informatique et des Libertés; CNIL) and the French national council for statistical information (Conseil National de l'Information Statistique; CNIS).
Measurements
Demographics
We considered three groups of age: 18–34, 35–54 and 55–79 years.
Anthropometrics
Anthropometric data were collected during home visits by trained interviewers. Weight measurements were taken to the nearest 0·1 kg in light clothes using electronic scales (Terraillon, France). Height was measured to the nearest cm, in a standing position, with a portable gauge. BMI was calculated as weight/height2 (in kg/m2). Pre-obesity (preOB) and OB were defined according to the WHO definition(12).
Socio-economic status
A face-to-face questionnaire included questions on occupational status, education level, and household wealth related to ‘having gone away on holiday for more than 4 days within the last 12 months’ (yes/no), ‘the number of cars in the household’, ‘the number of domestic electrical appliances’, ‘how the financial situation is perceived’ (positively/negatively), ‘financial access to desired food products’ (yes/no), ‘whether the idea of lacking food would be a concern’ (yes/no), ‘giving up health care for financial reasons’ (yes/no), ‘housing occupation status’ (first-time buyer/owner/tenant/tenant in social housing and others) and ‘household income’. Occupational status was divided into six categories: ‘executive and top management’, ‘middle professions’, ‘farmers and skilled blue-collar workers’, ‘retired’, ‘unemployed and manual workers’ and ‘homemakers and students’. Education level was divided into three categories: primary, secondary and high school, university. Household income was divided into a further three categories: ‘ < 1300’, ‘1300 to < 2500’, ‘2500 or more’ euros/month.
Geographical variables
Subjects were classified into North, South or Paris area according to their region of living. The conglomerate size was divided into two classes: < 100 000 inhabitants and ≥ 100 000 inhabitants.
Statistical analyses
Analyses were computed on STATA software (release 10; StataCorpLP, College Station, TX, USA). In the initial INCA 2 sample, men and women represented 41·4 and 58·6 % of the population, respectively. With regards to the national data published in 2005 by INSEE (French National Institute of Statistics and of Economic Studies)(13), women were over-represented. The youngest ( < 35 years) and the oldest (>64 years) individuals were slightly under-represented. Regarding occupational status, rates were quite comparable. Consequently, to ensure the national representativeness of the final sample, data were weighted for unequal sampling probabilities and for differential non-responses using a post-stratification algorithm(Reference Sautory14) according to sociodemographic criteria: region, size of urban area, size of household, sex, age, occupation of the household head, and season. Results showed in the present paper take into account this weighting procedure. P < 0·05 was used as the threshold for significance.
Composite indices of SES were derived from correspondence analysis. First, the household wealth composite index was built taking into account all measures of wealth previously described, except household income (the latter due to 20 % missing values). Second, the overall SES composite index was derived from occupational status, educational level and the variables describing household wealth (except household income). In both correspondence analyses, the score of each subject on the first principal component was used as the summary index, which was divided into tertiles. The two composite indices were then compared with the household income, occupational status and educational level for both internal and external validation.
All analyses were stratified by sex. To compare frequencies, χ2 tests were used. Associations between OB (as the dependent variable) and each of the four SES indicators (occupation, education, household wealth composite index, and overall SES index) were estimated using age-adjusted logistic regressions. We then performed two sets of multivariate models including (along with demographic and geographical covariates): (1) education, occupation and the household wealth composite index; and (2) only the overall SES composite index. In both cases, stepwise logistic regressions were performed: critical P values that selected SES factors were set at P = 0·10.
Results
A total of 272 adults were excluded from the analyses due to missing data. In particular, 255 adults refused to be measured. The subjects excluded from the analyses did not differ from the others in terms of age and socio-economic variables.
Rates of preOB and OB were 31·4 (95 % CI 29·1, 33·7) and 11·8 (95 % CI 10·1, 13·4) %, respectively. Prevalence of preOB was significantly higher in men (38·7 %) than in women (24·1 %) (P < 0·0001), whereas no significant difference was observed in the prevalence of OB according to sex (Table 1). The prevalence of preOB and OB increased with age in both men (preOB18–34 years = 23·3 (95 % CI 17·1, 29·5) %, preOB35–54 years = 39·4 (95 % CI 33·8, 45·0) %, preOB55–79 years = 50·9 (95 % CI 44·6, 57·2) %, P < 0·0001; OB18–34 years = 6·3 (95 % CI 3·1, 9·6) %, OB35–54 years = 11·6 (95 % CI 7·9, 15·4) %, OB55–79 years = 15·4 (95 % CI 11·1, 19·6) %, P = 0·006) and women (preOB18–34 years = 13·6 (95 % CI 9·5, 17·8) %, preOB35–54 years = 24·7 (95 % CI 20·2, 29·2) %, preOB55–79 years = 34·7 (95 % CI 29·0, 40·4) %, P < 0·0001; OB18–34 years = 4·3 (95 % CI 1·0, 7·6) %, OB35–54 years = 13·9 (95 % CI 9·9, 17·8) %, OB55–79 years = 18·6 (95 % CI 14·3, 22·9) %, P < 0·0001).
Table 1 Characteristics by sex of French adults included in the second National Individual Survey on Food Consumption (INCA 2) study*
(Percentages within characteristics and 95 % confidence intervals)
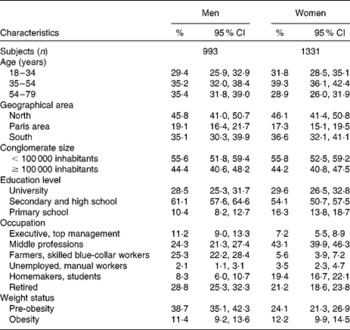
* Results were weighted for unequal sampling probabilities and for differential non-responses by region, conglomerate size, age, sex, occupation of the household head, size of the household and season.
The two SES composite indices derived from correspondence analysis are described in Table 2. A high proportion of the variance was explained by the first axis in both cases, i.e. 90·8 % for the household wealth composite index and 71·4 % for the overall SES composite index. The interpretation of the second dimensions derived from both correspondence analyses was not straightforward. Consequently, only one dimension was retained in each case, which displayed gradients of wealth and overall SES, respectively. Table 3 further indicates good internal and external validation of both composite indices regarding income, occupation and education.
Table 2 Characteristics of the first dimensions – household wealth composite index and overall socio-economic status (SES) composite index – derived from the two correspondence analyses (n 2324)

* Accounted for 90·8 % of the explained variance.
† Accounted for 71·4 % of the explained variance.
Table 3 Relationships between the two composite indices and household income, education and occupation (n 2324)
(Percentages for each tertile)

SES, socio-economic status.
* By χ2 tests.
In women, education level, household wealth index and overall SES index were strongly and inversely associated with the prevalence of OB in the age-adjusted analyses, with ORhigh/low ranging from 3·93 to 4·69. The inverse association with occupation was only close to significance (P = 0·06). The latter factor was not retained in the stepwise multivariate model (Table 4). By contrast, none of the four SES indicators were significantly associated with the prevalence of OB in men. Further analyses undertaken with overweight (preOB+OB) led to similar results in women (not shown). In men, overweight was slightly associated with lower education level and occupational status (P < 0·05), but not with either of the composite indices.
Table 4 Age-adjusted and multivariate analysis for obesity according to socio-economic and geographical factors among French adults in the second National Individual Survey on Food Consumption (INCA 2) study (analyses stratified by sex) (n 2324)
(Odds ratios and 95 % confidence intervals)
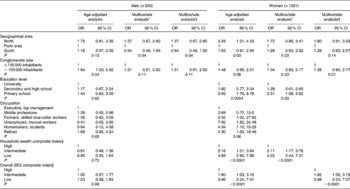
SES, socio-economic status.
* Multivariate logistic regressions of obesity including as independent variables: age (in three categories), the two geographical cofactors and the three SES indices (education, occupation and household wealth composite index). Stepwise multivariate logistic regressions were performed. In the final multivariate logistic model, SES covariates were retained if they were significant at the 10 % level.
† Multivariate logistic regressions of obesity including as independent variables: age (in three categories), the two geographical cofactors and the overall SES composite index. Stepwise multivariate logistic regressions were performed. In the final multivariate logistic model, the overall SES index was retained if it was significant at the 10 % level.
‡ Index derived from correspondence analysis including the following indices of ‘wealth’: ‘having gone on holiday for more than 4 days within the last 12 months’ (yes/no), ‘the number of cars in the household’, ‘the number of domestic electrical appliances,’ ‘how the financial situation is perceived’ (positively/negatively), ‘financial access to desired food products’ (yes/no), ‘whether the idea of lacking food would be a concern’ (yes/no), ‘giving up health care for financial reasons’ (yes/no), and ‘the housing occupation status’ (first-time buyer/owner/tenant/tenant in social housing and others).
§ Overall SES index derived from correspondence analysis including the occupational status, the educational level and the eight indices of wealth.
Discussion
The strengths of the present study are the estimation of preOB and OB rates in a representative sample of the national population based on objective measurements of height and weight. More importantly, on the behalf of comprehensive questionnaires, we could investigate the relative association of different dimensions of SES to OB. We further derived composite indices (household wealth and overall SES), which is a complementary approach, rarely undertaken before(Reference Turrell, Hewitt and Patterson15). However, some dimensions of SES were not taken into account in our analyses, notably the socio-economic characteristics of neighbourhoods, known to influence health through physical and social features of the environment(Reference Spittaels, Foster and Oppert16).
Our findings confirmed that low SES (as measured using the three dimensions: education, occupation, and household wealth composite index) was associated with higher prevalence of OB, but only in women. The fact that occupation was not retained in the stepwise multivariate analysis was the result of high collinearity between this variable and both education and household wealth status. In addition, occupational status is more likely to change over time than the other SES factors, leading to less consistent associations with OB(Reference Liberatos, Link and Kelsey17). By contrast, the level of education has been suggested to influence long-term literacy, knowledge on nutrition, and health behaviours, which in turn are involved in weight gain, particularly in women(Reference Sobal18). A higher wealth status may also facilitate access to healthy foods and physical activity behaviours(Reference Darmon and Drewnowski19, Reference Ball and Crawford20). The present results also showed that the educational level and the household wealth status, although positively correlated, are not strict proxies for each other, because both variables were maintained in the stepwise regression model. The wealth status is likely to vary at similar levels of education(Reference Braveman, Cubbin and Egerter1), with additional effects regarding weight status. Consequently, both variables are worth considering with regards to OB in France, not only for epidemiological research but also for targeting the most vulnerable groups and organising health interventions.
Consistent with our findings, the inverse SES–OB relationship has more frequently been observed in women than in men(Reference Vernay, Malon and Oleko6, Reference Roskam and Kunst7, Reference McLaren21). We might have lacked statistical power to show a significant relationship in men, due to rather small numbers. The higher social pressure and stigmatisation regarding weight status exerted amongst women may also partly explain this result. In fact, the cross-sectional design of the INCA 2 study is a limitation regarding causal inferences: it is likely that part of the relationships observed in women was due to the effect of OB on socio-economic achievements(Reference Roskam and Kunst7). At similar levels of education, it is also possible that men are less sensitive and thus compliant to health and nutritional guidelines. In addition, the lack of significant observation in men may be explained by the definition used for weight status. BMI does not allow distinguishing fat from lean mass, an issue particularly sensitive in men(Reference Vernay, Malon and Oleko6). Low-status occupations are more likely to involve strainful physical activity in men than in women(Reference Wardle, Waller and Jarvis22).
As the strength of the association between OB and SES depends on the dimension of SES considered, an overall synthetic index is certainly worth deriving when SES is included as a confounder of relationships between a given determinant and OB in multivariate epidemiological models. In fact, based on the observation that different dimensions of SES are neither interchangeable nor completely independent, a unique factor is certainly not enough to account for all the complexity (and thus variability) of SES. On the other hand, ‘controlling for SES’ while including several measures of SES in multivariate models may lead to collinearity, and thus over-adjustment and statistical instability. Stepwise analyses may help to avoid collinearity between these SES factors. A complementary and comprehensive approach may also be to derive an overall composite index while including the SES variables available in a given study (using correspondence analysis, for instance). The resulting index, which is data driven, cannot be compared easily with other data. However, it is an interesting internal tool for adjustment on SES; in addition, it is all the more relevant since the variance accounted for by the composite dimension selected is relatively high, which was the case in our data.
PreOB and OB rates estimated from the INCA 2 study are consistent with those of the French Obepi survey conducted in 2006(Reference Charles, Eschwege and Basdevant4). Although body weight and height were not measured by investigators in the Obepi surveys (which have been performed every three years since 1997), subjects were asked to measure themselves with the aid of another household member before reporting the anthropometric data. Consequently, underestimation of BMI should be limited. The French Nutrition and Health Survey (ENNS) is another national survey carried out in 2006–07, which included adults aged 18–74 years(Reference Vernay, Malon and Oleko6). Body weight and height were measured by trained physicians, nurses or dietitians either at home or in health examination centres of the French National Health Insurance System. Estimated rates for preOB were similar between the INCA 2 and the ENNS surveys. However, estimated rates of OB were higher in the ENNS survey, i.e. 16·9 (95 % CI 14·8, 18·9) %. As stated by the authors, 2204 amongst the 5217 eligible subjects (i.e. 42 %) accepted to be involved in the ENNS health examination protocol (which included anthropometrics amongst other measurements). Therefore, a participation bias cannot be excluded. In the INCA 2 survey, as mentioned previously, 255 adults refused to be measured. Although the latter did not differ according to age and occupational status, we cannot exclude that the proportion of obese individuals in this subsample was higher than in the overall sample. It is therefore likely that the ‘true’ prevalence of adult OB in France is somewhere between the similar rates estimated in the INCA 2 and Obepi studies and the prevalence estimated in the ENNS study.
Rates of adult OB in France and other Western European countries are lower than those of the UK or Eastern European countries(Reference Gallus, Colombo and Scarpino23). However, basing their analyses on the Obepi data, Charles et al. (Reference Charles, Eschwege and Basdevant4) have highlighted that prevalence has increased sharply in France since the 1990s, particularly in women and the lower SES groups. Their study showed that rates of OB in 2006 were three times as high in individuals earning less than 900 euros/month than in their counterparts living with more than 3600 euros monthly. These increasing disparities according to SES level in France have also been indicated by another French study, in which anthropometric measurements were repeated over time(Reference De Saint Pol24). Similar trends have been reported in other European countries(Reference Molarius, Seidell and Sans25), but not in the USA(Reference Zhang and Wang26).
In conclusion, our findings confirmed that different socio-economic variables are not necessarily proxies of each other, and thus interchangeable(Reference Braveman, Cubbin and Egerter1). The different components of SES not only represent different population groups but also point to different pathways, such as different behaviours, or different critical periods of the life course(Reference Braveman, Cubbin and Egerter1, Reference Roskam and Kunst7). On the other hand, when ‘controlling for SES’ in multivariate models, caution should be made regarding potential collinearity – and thus over-adjustment – if several SES factors are included simultaneously in the analyses. A more integrative approach could be to derive a synthetic SES index. Finally, understanding how OB is related to the different dimensions of SES should help to target the more vulnerable groups and increase the effectiveness of prevention.
Acknowledgements
The present study was supported by the French Food Safety Agency (Afssa).
The authors thank Pierre Traissac, from Institut de recherche pour le développement (IRD), for his expertise in correspondence analysis. The authors are also grateful to Catriona Holmes who provided editorial assistance.
F. F. and S. L. designed the study, analysed and interpreted the data and wrote the manuscript. L. L. and J.-L. V. designed, coordinated and supervised the survey. S. L., C. D., A. D., M. B. and M. T. contributed to the design of the survey and the data collection, and together with B. M. helped to write the paper.
None of the authors had a conflict of interest.


