


Kenya is one of several African countries facing food emergencies(1). According to the FAO country profile on food security indicators, data from Kenya show that the proportion of food insecurity (determined as undernourishment with an average daily energy intake (EI) <7·33 MJ/person) was 30 % during the period 2004–2006(2).
Food insecurity exists when people lack secure access to sufficient amounts of safe and nutritious food for normal growth and development and an active and healthy life(3). In the absence of direct measures of food insecurity, the nutritional status of individuals is often used as outcome measures to reflect the end result of all factors affecting the nutritional status, including food security. One of several indicators of food insecurity among adults is underweight (BMI < 18·5 kg/m2). Recently, we showed a high prevalence of both underweight (17 % and 23 % in women and men) and overweight (BMI ≥ 25·0 kg/m2; 26 % and 12 % in women and men, respectively) among rural Kenyans in a population group comprising Luo, Kamba and Maasai(Reference Christensen, Eis and Hansen4). This clearly indicates that Kenya has to battle the double burden of malnutrition.
Food insecurity in Kenya mainly arises as a result of droughts, pressure on arable land and poverty, all of which severely affect the agricultural output and access to food in parts of the country. With a heterogenic land area and forty-two ethnic groups living in Kenya(5), lifestyle including dietary patterns differs considerably among communities depending on culture, location and economic activities. In Kenya, most ethnic groups depend on foodgrains, especially maize, sorghum and millet, as the staple food, often supplemented with vegetables, tubers, fish, milk and poultry(Reference Oniang'o and Komokoti6, Reference Neumann, Bwibo and Murphy7). Among pastoralist groups, the dependency on especially maize varies, and the staple foods are sometimes supplemented or even replaced with milk(Reference Nestel8), and among groups living close to lakes they are replaced with fish(Reference Robinson and Day9). With a population that is dispersed by different ethnic, ecological and economical backgrounds, the challenges of studying food insecurity are numerous(Reference Oniang'o and Komokoti6). We propose that using other measures of food insecurity such as dietary patterns and total dietary intake may be valuable measures for identifying possible needs for interventions.
Three ethnic groups – Luo, Kamba and Maasai (representing fishing, agricultural and agropastoral societies, respectively) – were selected as the study population to examine more closely the differences and similarities of these ethnic groups with regard to food insecurity. The groups were selected to represent the three major lifestyle groups in Kenya(Reference Fedders and Salvadori10). Thus, the objective of the present study was to compare dietary patterns and food and macronutrient intakes among adults in three ethnic groups.
Study population and methods
Study area and population
A cross-sectional study was conducted among three selected rural population groups in Kenya – the Luo (Bondo district), the Kamba (Kitui district) and the Maasai (Transmara district).
The Luo subsist mainly on maize, sorghum and fish(Reference Ochieng11), the Kamba on maize(Reference van Steenbergen, Kusin and Nordbeck12) and the Maasai on milk and foodgrains(Reference Nestel8). All data for the present study were collected during the period August–November 2005. Among the Luo, data were collected from August to September, among the Kamba from September to October and among the Maasai from October to November. Data were collected immediately following harvest in each area. The present study was part of a larger study on the prevalence of and risk factors for type 2 diabetes(Reference Christensen, Friis and Mwaniki13).
Selection procedure
Inclusion criteria for the study were ≥18 years of age and being of Luo, Kamba or Maasai ethnicity. Exclusion criteria for participation were pregnancy, serious illnesses such as malaria, inability to walk unassisted and severe mental disease.
A local social mobiliser identified and presented all potential participants in each of the three geographical areas with a standard statement describing the present study as a diabetes survey including a general health check-up. Subsequently, all interested individuals were registered and assigned a specific day to show up at the study site. In case the registered individuals did not show up for participation, they were substituted by volunteers not registered but who showed up at the study site for the purpose of enrolment in the study. Thus, the study was based on an opportunity sample.
The Luo participants were studied at thirteen different primary schools in six different sub-locations of the Bondo district around Lake Victoria. The Kamba participants, who lived in three different sub-locations within a range of 20 km from the study site, were examined at Mutomo Hospital in Kitui district in Eastern Kenya. The Maasai participants, who lived in villages (‘manyattas’) within a 20 km range from the study site, were examined at the Lolgorian Health Centre in Transmara district. In all, 403 Luo (222 women and 181 men), 398 Kamba (294 women and 104 men) and 362 Maasai (190 women and 172 men) participated in the study.
The age of the study participants was taken from their personal ID cards, or by their own account. If the study participant did not know his age, the local social mobiliser estimated his age according to personal events such as circumcision and age-set membership. For more details about selection procedures see Christensen et al. (Reference Christensen, Eis and Hansen4).
All participants gave informed consent in writing (orally in case of illiteracy). The study was approved by the National Ethical Review Committee in Kenya and by the Danish National Committee on Biomedical Research Ethics in Denmark.
Dietary assessment
The dietary intake for each participant was estimated using an interactive 24 h recall developed especially to collect dietary information on rural populations in developing countries(Reference Gibson14). At each study location, the dietary assessment was conducted by five to six local research assistants recruited for the study and trained as a group for a minimum of 3 d on portion size estimation. The training included portion sizes of pre-prepared foods and beverages weighed on a digital scale (type 2010; Salter Housewares Ltd, Tonbridge, UK) with 1 g accuracy.
The interactive 24 h recall was conducted twice with each participant. The first recall was conducted from Monday through Saturday and the subsequent recall 4 d later. On the recall day, fresh fruit, vegetables and local breads (or paper models of foods bought at the local markets) were used, together with utensils (bowls, plates and cups) from the local market to help respondents visualise the amount of food/beverage consumed. When possible, local recipes were recorded for calculation of nutrient intakes.
The dietary data were entered into the General Intake Estimation System (GIES; National Food Institute, Søborg, Denmark) program in the field, which allowed immediate checking and corrections of obvious errors and misunderstandings. After registration of the food intakes and recipes, the GIES program was linked to an ad hoc food composition database compiled from Composition of Foods Commonly Eaten in East Africa (Reference West, Pepping and Temalilwa15), the UK Nutrient Databank(16) and a few food items from National Food Composition Tables and The Planning of Satisfactory Diets in Kenya (Reference Sehmi17).
The Goldberg cut-off method was used to evaluate the dietary data obtained by the 24 h recall method(Reference Goldberg, Black and Jebb18, Reference Black19). According to this method, the ratio between the estimated EI and age- and sex-specific BMR is calculated and values below a certain cut-off point are regarded as physiologically implausible. In the present study, a cut-off value of 1·53 at group level (based on n 1000–1500 and 1–4 d of observation) was applied(Reference Goldberg, Black and Jebb18).
The number of snacks and meals per day was estimated from information given at the first 24 h recall and quantitative meal patterns were expressed as frequency of main and snacking meals. Meals and snacks were defined in terms of size (number of items or amount) of the meal or snack allowing an intake of three meals per day comprising breakfast, lunch and dinner. Other food intakes were recorded as snacks.
According to the nutrient composition of the most commonly consumed foods recorded in the 24 h recalls, all registered food items were grouped into six major food groups comprising seventeen specific food groups. The major food groups were: (i) starchy foods comprising cereals/grain products and starchy roots/tubers; (ii) other plant foods comprising grain legumes/pulses; nuts and oily seeds; vegetables; and fruits; (iii) animal foods comprising meat, poultry and eggs; fish; milk and milk products; (iv) mixed dishes comprising meat, poultry, eggs; or fish with vegetable, tubers, pulses, cereals; tubers, pulses, cereals and vegetables; and vegetables with milk and milk products; (v) miscellaneous comprising fats; sugar and sugary products; others; and (vi) beverages comprising soft drinks; tea, coffee and hot chocolate with milk and sugar.
The prevalence of dietary intakes of specific food groups was expressed as the frequency of reported intake and the energy contribution from each food group was calculated and expressed as the percentage of total EI in each ethnic group. The average of the two 24 h recalls was used.
Daily total energy and macronutrient intakes were calculated as an average of the two 24 h recalls.
Anthropometry
Anthropometric measurements were taken with the participants standing barefoot and wearing light clothing. Height was measured to the nearest 0·1 cm with a portable stadiometer (Meterex II, D97; UNICEF, Copenhagen, Denmark) and body weight was measured to the nearest 0·1 kg with a portable high precision scale (type BWB-800 S MA; TANITA, Tokyo, Japan). BMI was calculated as weight in kilograms divided by the square of height in metres (kg/m2). Waist circumference (WC) was measured with a body tape (WM02 Body Tape; Chasmors, Haechstmass, Germany) with WC measured midway between the iliac crest and the costal margin following a quiet expiration. At each study location, a local male and a female research assistant were recruited and trained for a minimum of 3 d to conduct the anthropometric assessment.
Socio-economic questionnaire
Socio-economic data were collected using standardised questionnaires covering employment, monthly food expenses, area of land owned and ownership of domesticated animals. Interviews were conducted in Kiswahili, English or the local language by a team investigator or by a trained local assistant.
Statistical analyses
Excel 2003 version 11·0 (Microsoft Corp., Redmond, WA, USA) was used for data processing and for calculation of average recipes. The Statistical Package for the Social Sciences statistical software package version 13·0·1 for Windows (SPSS Inc., Chicago, IL, USA) was used for all statistical calculations. The analyses were stratified by sex and ethnicity. The Shapiro–Wilk test and visual inspection were used to determine whether variables (intakes of energy, carbohydrate, protein and fat; percentage of energy (%E) from carbohydrate, protein and fat; age, height, weight, BMI and WC) had a normal distribution. The χ 2 test was used to test for differences in proportions. Variables with a non-normal distribution were examined with the non-parametric Mann–Whitney U test for the study populations and among populations with the Kruskal–Wallis test. One-way ANOVA, with least significant difference (homogeneity of variance) or Tamhane's T2 (non-homogeneity of variance) as the post hoc test, was used to test for differences in means. P < 0·05 was considered as statistical significance.
Results
Females comprised 55 %, 74 % and 52 % of the Luo, Kamba and Maasai, respectively. As previously published(Reference Christensen, Eis and Hansen4), age and anthropometric measurements by ethnic group and sex showed that the Kamba were significantly shorter and lighter compared with the Luo and Maasai among both sexes, and that Kamba men had the lowest BMI (Table 1). In women, the prevalence of underweight (BMI < 18·5 kg/m2) was 13·5 %, 17·5 % and 18·8 % (P = 0·30) among the Luo, Kamba and Maasai, respectively. In men, the prevalence of underweight was 13·7 %, 28·6 % and 30·2 % (P < 0·001) in the Luo, Kamba and Maasai, respectively. Rates of overweight (BMI > 25·0 kg/m2) in the three groups were 14·0 %, 25·2 % and 17·9 % for women and 9·8 %, 3·9 % and 14·0 % for men in the Luo, Kamba and Maasai, respectively.
Table 1 Age and anthropometric measurements of 1163 rural Kenyans by sex and ethnicity
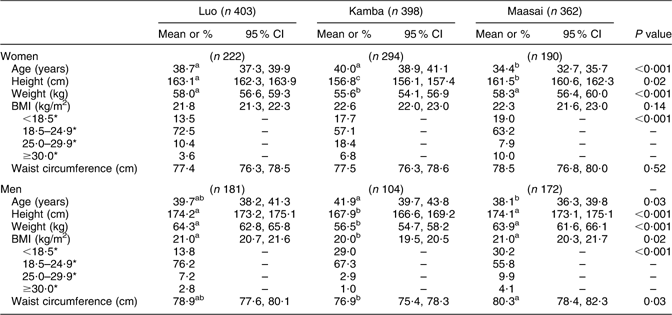
a,b,cMean values within a row with different superscript letters were significantly different (P < 0·05).
*Data are presented as prevalence in the groups (%).
Socio-economic characteristics within and among the three ethnic groups showed marked differences in the source of income. Farming was by far the most important within all three ethnic groups, and especially among the Luo. The Maasai owned most land acreage as well as domesticated animals (Table 2).
Table 2 Socio-economic characteristics of 1163 rural Kenyans by ethnicity
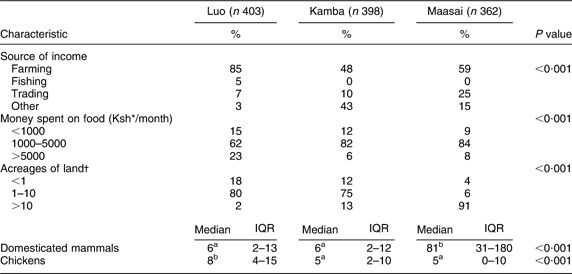
IQR, interquartile range.
a,bMedian values within a row with unlike superscript letters were significantly different (P < 0·05).
*1000 Kenyan shilling ≈$US 13·30.
†1 acre ≈4000 m2.
The interactive 24 h recalls were obtained for all participants except for 7 % who did not show up for the second interview. The quantitative meal patterns showed that 73–88 % of the participants in all three ethnic groups consumed three or more meals per day, and that the Kamba was the group with the highest prevalence of subjects with two main meals per day. Overall, snack patterns were more unevenly distributed among the ethnic groups than were main meals (Table 3). Among the Kamba, 64 % reported that they had not consumed any snacks the previous day, whereas among the Luo and the Maasai it was only 33–39 %.
Table 3 Prevalence of intake of daily mealsFootnote * and snacksFootnote * among 1163 rural Kenyans by ethnicityFootnote †
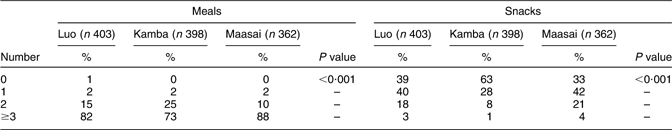
* Meals and snacks were defined in terms of size (number of items or amount) of the meal or snack allowing an intake of three meals per day and various snacks.
† P values refer to tests for overall difference among ethnic groups.
The estimated mean BMR(Reference Schofield20) based on age, sex and body weight was 5·6 (95 % CI 5·5, 5·6), 5·5 (95 % CI 5·4, 5·5) and 5·6 (95 % CI 5·5, 5·7) MJ/d in Luo, Kamba and Maasai women, respectively. In men, the estimated mean BMR was 6·8 (95 % CI 6·7, 6·9), 6·4 (95 % CI 6·3, 6·5) and 6·8 (95 % CI 6·7, 6·9) MJ/d among Luo, Kamba and Maasai, respectively. Estimated mean ratio between EI and BMR was 1·6 (95 % CI 1·5, 1·6), 1·1 (95 % CI 1·0, 1·1) and 1·2 (95 % CI 1·2, 1·3) in Luo, Kamba and Maasai women, and 1·6 (95 % CI 1·5, 1·6), 1·1 (95 % CI 1·1, 1·2) and 1·3 (95 % CI 1·2, 1·3) in Luo, Kamba and Maasai men, respectively.
The dietary patterns used as a measure of food (in)security in the present study confirmed that the prevalence of dietary intakes of major and specific food groups for all participants was similar with respect to the daily intake of cereals and grain products, and further that the majority of participants in all three ethnic groups consumed tea, coffee and/or hot chocolate with milk and sugar and vegetables daily (Table 4). The differences in dietary patterns appeared when other dietary patterns were considered. Almost 80 % of the Luo consumed fish daily, compared with 0–2 % among the Kamba and the Maasai. Twice as many (88 %) Maasai consumed milk and milk products, compared with the Luo (43 %) and Kamba (40 %), and the differences between prevalence of intake among the three ethnic groups were most pronounced with regard to the consumption of vegetables (highest prevalence among the Luo), milk and milk products (highest prevalence among the Maasai) and mixed dishes comprising tubers, pulses, cereals and vegetables (highest prevalence among the Kamba).
Table 4 Prevalence of intake and percentage of energy from food groups of 1163 rural Kenyans by ethnicity
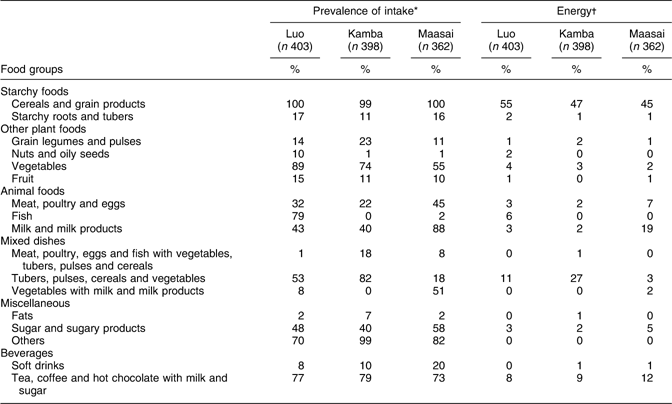
*Prevalence of subjects who reported an intake from the food groups in the 24 h recalls (mean of the two interviews).
†Energy in percentage from the food groups in the 24 h recalls (mean of the two interviews).
The contribution from the different food groups to the total EI showed that cereals and grain products contributed between 45 % and 55 % of total EI (Table 4). Meat, poultry and eggs contributed little to the EI (3–7 %) among all three ethnic groups, and the Luo obtained 6 % of their EI from fish. The Maasai consumed 19 % of their EI from milk and milk products compared with 3 % and 2 % among the Luo and Kamba, respectively. Mixed dishes comprising tubers, pulses, cereals and vegetables contributed 27 % of the EI among the Kamba. In all three ethnic groups, tea, coffee and hot chocolate with milk and sugar contributed 8–12 % of the EI.
When EI, macronutrient intake and macronutrient contribution in percentage of total EI were stratified by age group (18–30, 31–45 and 46–68 years), gender and ethnic group, only the mean intakes of %E from carbohydrates (P = 0·02) and fat (P = 0·003) for women and sugar (g/d; P = 0·04) for men were significantly different (data not shown). Consequently, the age groups in each population group were analysed together.
EI (kJ/d) was highest among the Luo and lowest among the Kamba in both sexes. The Luo had the highest total protein (g/d) and carbohydrate (g/d) intakes in both sexes. For women, protein intake expressed per kg body weight (g/kg per d) was highest among the Luo and Maasai and lowest among the Kamba, with a similar pattern among men. Fat intake (g/d) was highest among the Maasai in both sexes and when expressed as %E reached a mean value of 26·2 % in women and 30·2 % in men. Conversely, carbohydrate intake expressed as %E was higher among the Luo and Kamba compared with the Maasai in both sexes. Percentage of energy from protein was lowest in the Kamba among women and men and highest in the Maasai among men only (Table 5).
Table 5 Daily total energy and macronutrient intakes of 1163 rural Kenyans by sex and ethnicityFootnote *
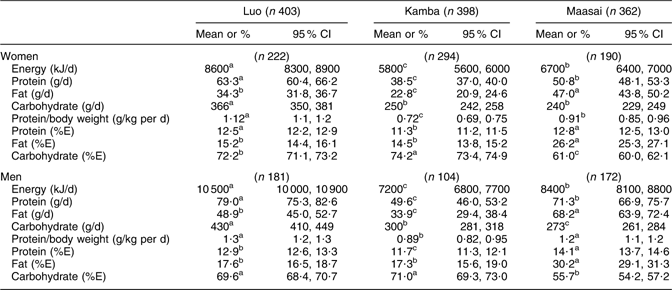
a,b,c Mean values within a row with unlike superscript letters were significantly different (P < 0·05); P value <0·001 in all rows.
* All data are based on two 24 h recall interviews.
Discussion
A key finding of the present study was the considerable difference in nutritional status among the ethnic groups studied and, in particular, the profound differences in dietary patterns resulting in major differences in dietary intakes both quantitatively and qualitatively among the groups. As expected, milk and milk products were important food items in the diet of the Maasai and – to a lesser extent – fish was important in the diet of the Luo.
In the present study, many attempts were taken to ensure reliable and accurate measurements of dietary intake; that is, local household measures, local foods and different food portions were used. Furthermore, specific local food composition tables were used where possible. However, we cannot exclude that some under-reporting might have taken place. When the Goldberg method of calculating EI:BMR was adapted to determine the plausibility of reliable dietary reporting(Reference Sehmi17, Reference Goldberg, Black and Jebb18), the Luo group met the cut-off requirements of 1·53 for estimated group EI during the period of observation. On the basis of this background we were assured that the dietary method used was reliable. As the methodology was the same in all three areas, the low EI:BMR ratio among the Kamba and Maasai groups, together with the high prevalence of underweight and the socio-economic data, indicates that these two groups may not have been in energy balance, which is a prerequisite for the Goldberg method. Therefore, the method could not be applied for the Kamba and Maasai groups.
Among the differences in nutrient and food intakes in the present study, the dietary fat intake among the Maasai contributed almost one-third of the total EI, which was twice as much compared with the Luo and Kamba. Despite these major differences among the ethnic groups, fat consumption of the Maasai was considerably lower than previously reported(Reference Nestel8, Reference Orr and Gilks21, Reference Biss, Ho and Mikkelson22). Dietary fat intake that contributed as much as 66 % of daily EI primarily because of a high daily milk consumption(Reference Biss, Ho and Mikkelson22), and mean daily EI of 12·6 MJ among Maasai males, has been reported earlier(Reference Biss, Ho and Mikkelson22, Reference Mann, Shaffer and Anderson23). However, the quantity of this predominantly milk-based diet in the traditional Maasai society has been questioned by other authors(Reference Gibney and Burstyn24). Later studies among the Maasai have shown that the reliance on milk and milk products has been reduced with a concomitant reliance on cereal staple foods, especially white maize(Reference Nestel8, Reference McCormick and Elmore-Meegan25). The present study supports a reduced reliance on milk and can be regarded as evidence of an ongoing nutrition transition among this ethnic group.
Descriptive accounts in scientific literature on the dietary intake among the Luo are few and not of recent date(Reference Callahan26). The exceptions are two recent studies discussing the potential of alleviating some of the food insecurity problems through consumption of ‘wild foods’, i.e. insects and uncultivated plants among the Luo(Reference Christensen, Orech and Mungai27, Reference Orech, Christensen and Larsen28). At the outset of our study, we relied on earlier scientific descriptions(Reference Ochieng11) in which fishing was reported to be a very important part of life in the Luo community living around Lake Victoria. Our findings showed that fishing accounted for only 5 % of the commercial activity among the Luo participants (Table 2). However, dietary fish consumption was still highly frequent among the Luo as 79 % reported to have consumed fish, which was much higher compared with the other ethnic groups. In spite of the high frequency of fish intakes among the Luo, fish contributed only 6 % of daily EI. However, fish is still an important contributor to nutrient intakes because of its high content of protein and long-chain n-3 fatty acids. Fish also adds variety, i.e. food diversity, to the overall diet, which has been suggested as a useful variable in assessing the nutritional adequacy of the diet(Reference Hatloy, Hallund and Diarra29). Nevertheless, on the basis of the present findings, the importance of fishing in the Luo community may have to be reconsidered.
The Kamba had a distinctly different dietary intake pattern compared with the two other ethnic groups studied. At the time of data collection, people living in Kitui district experienced a period of severe drought, which had persisted for almost 7 years at least with regard to the long rainy season (S O'Connell, personal communication). The long period of drought was reflected in the meal and snack patterns of the Kamba in whom the prevalence of skipping meals and snacks was the highest. Only 73 % of the Kamba reported having consumed three or more main meals per day. The average daily EI was significantly lower among both women and men, compared with the other two ethnic groups. The present finding among Kamba men (7·2 MJ/d) is in contrast to earlier findings just one generation ago in which the reported mean daily EI among men was 11·2 MJ/d(Reference van Steenbergen, Kusin and Nordbeck12).
In the present study, the mean EI in the three ethnic groups (5·8–8·6 MJ/d in women and 7·2–10·5 MJ/d in men) was considerably lower compared with earlier studies. In a previous study carried out in Tanzania, the investigators found an average EI of 10·2 and 11·8 MJ/d among middle-aged and elderly rural Tanzanian women, respectively(Reference Mazengo, Simell and Lukmanji30). This difference may partly be explained by the dietary methodology used and partly by seasonal variations. Seasonal changes in dietary intake and energy expenditure are well documented in the African continent, as shown by Adams(Reference Adams31), who found a significant variation in body weight among agriculturalists in Mali over the course of 1 year. However, a similar seasonal variance in nutritional status expressed as BMI was not found in rural Ethiopian agriculturalists(Reference Alemu and Lindtbjørn32). In the present study, we measured dietary intake and thus EI immediately after the harvest season in all three districts when food is normally abundant. Differences in EI among the Kamba compared with the Luo and Maasai probably reflected a semi-chronic food shortage in the Kitui district. This was supported by a high underweight (BMI < 18·5 kg/m2) prevalence of 20 % in the Kamba. However, it is noteworthy that underweight prevalence among the Maasai was ∼25 %, suggesting that this group was worse off with regard to food insecurity. We were not informed about significant inconsistencies in the harvest of the Maasai, which indicates that they still very much depend on milk as a means of nutrition quantity and quality. Over several decades the Maasai have consistently been shown to have a higher weight:height ratio compared with other Kenyan populations, including the Luo and Kamba(Reference Jansen and Horelli33). However, on the basis of these historical data it cannot be determined whether these anthropometric differences are caused by lifestyle or genetic factors.
In addition to BMI, other variables need to be considered in order to understand food insecurity in the present context. The prevalence of communicable diseases such as HIV, malaria and tuberculosis infection may have played a role. We cannot rule out the possibility that communicable diseases may have influenced food insecurity because of a lack of work ability and access to food. However, we did exclude individuals who showed clinical signs of severe disease.
Total protein intake of all three ethnic groups when considered as %E (11–14 %) was within the WHO recommendation of 10–15 %E(34). When expressed in relative terms as g/kg per d, the mean protein intake among Kamba women was 0·72 (95 % CI 0·69, 0·75) g/kg per d, which is below the recommended requirements of 0·75 g/kg per d(35). This low protein intake can partly be explained by the low total food intake and partly by the composition of food intake.
The cross-sectional design may be regarded as a limitation of the present study as it does not allow for an analysis of the seasonal variations of dietary intake. However, the design is well suited for the comparison of dietary patterns among ethnic groups, which was one of the main objectives of the study.
In conclusion, the present study showed that the degree of food insecurity measured as degree of undernutrition and as dietary patterns differed considerably among the three ethnic groups studied. These dietary differences were also reflected in the energy and macronutrient intakes. The information obtained on dietary patterns is useful in the decisions of actions to be taken to alleviate the specific food insecurity problems.
Acknowledgements
The present study was funded by DANIDA; University of Copenhagen (Cluster of International Health); Steno Diabetes Center; Brødrene Hartmann Foundation; Beckett Foundation; Dagmar Marshall's Foundation; Dr Thorvald Madsen's Grant; Kong Christian den Tiende's Foundation; and by Direktør Jacob Madsen & Hustru Olga Madsens Foundation. The authors have no conflict of interest to declare. A.W.H., D.L.C. and I.T. wrote the manuscript; D.L.C., H.F., I.T., D.L.M., M.K.B., B.K. and K.B.-J. designed the study; A.W.H., I.T., M.W.L., J.E. and T.C. were responsible for data management and analysis. All authors interpreted the data and contributed to the final manuscript. The authors are grateful to the participants, local chiefs and sub-chiefs, the local elder councils and district politicians for their cooperation. They are also thankful to all local assistants for their excellent mobilisation of participants and for their skilled work in conducting 24 h recall interviews and measurements of body composition. The authors acknowledge the permission granted by the Director of KEMRI to publish this manuscript.


