


Higher dietary intakes of retinol, cholecalciferol, the tocopherols and the carotenoids may be associated with reduced risk of several chronic diseases, including age-related macular degeneration, multiple sclerosis, type 1 diabetes, cardiovascular disease and certain cancers. Although the biological mechanisms by which these micronutrients act to delay or inhibit disease are not clear, there are certain functions that are known. For example, retinol and its precursors (α- and β-carotene) are essential for the differentiation of epithelial cells and maintenance of cell signalling and communicationReference Handelman1. Vitamin D plays a role in the immune systemReference DeLuca and Cantorna2 and is also involved in insulin productionReference Clark, Stumpf and Sar3. The tocopherols act as chain-breaking antioxidants that protect cell membranes from damage caused by lipid peroxidation and also inhibit cell proliferation, platelet adhesion and formation of N-nitroso compoundsReference Burkart, Grob-Eick, Bellmann, Radons and Kolb4, Reference Kamal-Eldin and Appleqvist5. Both the carotenoids and tocopherols stimulate cell-mediated and humoral immunityReference Yamada and Tachibana6.
In recent years, an increased emphasis has been placed on the importance of obtaining biomarkers to supplement dietary intake measurementsReference Schatzkin, Kipnis, Carroll, Midthune, Subhar, Bingham and Schoeller7. Vitamin D (in the form of 25-hydroxyvitamin D), the tocopherols and carotenoids are easily measured in plasma and are useful tools to measure nutrient status. In order to gain a better understanding of how these nutrients may be protective in disease prevention, it is important to establish reference values for each of these aforementioned biological markers. Furthermore, it is of interest to examine how dietary intake impacts blood concentrations of these nutrients as diet can potentially be modified to impact plasma vitamin levels. Hence, the objective of this analysis was to explore the determinants of plasma micronutrients in children, as well as to give reference values for each of these micronutrients.
Methods
Subjects
Subjects in this study were recruited from a cohort of infants who have been followed from birth by the Diabetes Autoimmunity Study in the Young (DAISY). This study has been investigating the natural history of autoimmunity in infants and children who are at increased risk of developing type 1 diabetes, as defined by being a sibling or offspring of someone with type 1 diabetes or by possessing human leukocyte antigen (HLA) genotypes that put them at increased genetic risk of type 1 diabetes. To ascertain the latter group, between 1994 and 2004, >32 000 newborns were screened for diabetes-susceptibility alleles in the HLA region. Details of the newborn screening protocol have been published elsewhereReference Rewers, Bugawan, Norris, Blair, Beaty and Hoffman8. The screened newborn population was representative of the general population of the Denver Metropolitan Area with respect to race and ethnicityReference Rewers, Bugawan, Norris, Blair, Beaty and Hoffman8. Those children found to have HLA-DR genotypes that put them at increased risk for developing type 1 diabetes were recruited into the DAISY longitudinal follow-up. In addition, infants who were siblings or offspring of type 1 diabetic individuals were identified via advertising and through diabetes clinics, and recruited into the DAISY longitudinal follow-up. Informed written consent was obtained from the parents of each study subject at enrolment. The Colorado Multiple Institutional Review Board approved all study protocols. Children attended clinics at the age of 9 months, 15 months, 2 years and annually thereafter, at which times blood was drawn for the measurement of diabetes-related autoantibodies.
For the current analysis, a representative sample of 257 children was selected from the DAISY population of 1433 children for the measurement of plasma micronutrients, as described below. A stratified random sampling strategy was used to select the subcohort of children, whereby subjects had a similar distribution of high-risk HLA type as the entire DAISY cohort, thus demonstrating that children in this study were representative of the larger population. Plasma samples from all 815 visits of the children were measured for micronutrients. This included 58 children with one visit, 46 children with two visits, 39 children with three visits, 55 children with four visits, 37 children with five visits, 14 children with six visits, six children with seven visits, one child with eight visits and one child with nine visits.
Measurement of plasma micronutrients
Blood samples were protected from light by placing the blood in foil-wrapped tubes directly following the blood draw; plasma was separated immediately, snap-frozen in liquid nitrogen, and stored in amber tubes at − 70°C until being sent for analysis to the University of Colorado Pediatric General Clinic Research Center Core Laboratory at The Children's Hospital in Denver. Total lipids were analysed in the plasma sample using a colorimetric assayReference Knight, Anderson and Rawle9. β-Carotene, α-carotene, β-cryptoxanthin, lutein/zeaxanthin, lycopene, α-tocopherol and γ-tocopherol were measured using high-performance liquid chromatographyReference Kaplan, Miller and Stein10. 25-Hydroxyvitamin D was measured by radioimmunoassay, using a kit from DiaSorin Inc.
Quality control was assessed by asking the laboratory to assay 109 blinded duplicate plasma samples. Excellent agreement was observed for all vitamin and carotenoid values, as described by the following intra-class correlation coefficients: 25-hydroxyvitamin D (0.91), γ-tocopherol (0.94), α-tocopherol (0.99), β-carotene (0.996), lycopene (0.98), leutin (0.96), β-cryptoxanthin (0.99), retinol (0.94) and total lipids (0.94).
Questionnaire data
Maternal report of early childhood diet was measured using the Willett food-frequency questionnaire (FFQ) that has been altered for use in pre-school children. The FFQ is first administered to mothers when the child is 2 years old (regarding the previous year) and repeated annually thereafter. Nutritional analysis of the FFQ was completed by the Channing Laboratories using their nutrient database (US Department of Agriculture (USDA) database version SR15). The nutrient variables include intake from both foods and supplements (e.g. multivitamins). We conducted a validation study in 68 DAISY children, in which the nutrients obtained from the FFQ were compared with those obtained from four 24-hour recalls throughout the corresponding year, and were found to be significantly correlatedReference Parrish, Marshall, Krebs, Rewers and Norris11. Data were collected to evaluate the subject's exposure to environmental tobacco smoke (ETS) via a questionnaire that inquired about whether either the child's parents smoked inside or outside the home. The questionnaire also asked if the child had regular contact with any other person, such as a babysitter or grandparent, who smoked. A subject was considered exposed to ETS if either a parent or another caretaker of the child smoked. Seifert et al. Reference Seifert, Ross, Deutsch, Awad and Norris12 showed that the responses to this ETS questionnaire were significantly associated with urine cotinine concentrations (a marker of tobacco smoke inhalation). We did not have complete longitudinal data on ETS exposure; therefore it was analysed as a static variable.
Statistical analysis
The relationship between plasma vitamins and the potential correlates of vitamin status were analysed using Proc Mixed in SAS for Windows Version 9.1 (SAS Institute, Inc.). Means ± 2 standard deviations (SDs) were plotted vs. age for each plasma nutrient. A natural log transformation of the dietary and plasma variables was used to normalise the distributions prior to analyses when appropriate. The procedure discussed by Cnaan et al. Reference Cnaan, Laird and Slasor13 was used to determine best-fit polynomials for both the fixed and random effects of age. These models distinguish variability between subjects and variability between repeated measurements over time within subjects. The between-subject covariance matrices were restricted to be positive definite.
First, each of the plasma micronutrients was modelled as a polynomial in age. The − 2 log likelihood statistic and plots of the means and SDs of the raw data were used to determine which degrees of polynomial in age best described both the fixed and random effects of the model. Using the best-fitting univariate model on age determined for each plasma micronutrient, we calculated the mean ± 2SD in order to present age-specific normal ranges of these micronutrients (Table 2). The predicted means were determined as the natural antilogs of the predicted means from the best-fitting mixed models of ln(plasma micronutrient) on age. The normal limits were determined as the antilog of the predicted mean − 2 SD and the antilog of the predicted mean +2 SD. The SD was determined as the square root of the sum of between-subject, within-subject and parameter estimation error variances.
In order to examine predictors of plasma micronutrient levels, we used the best-fitting univariate model on age determined for each plasma micronutrient as a base model (as described above); and we built a multivariate model in which the dietary variable corresponding to each plasma variable was included, in addition to a standard set of covariates (e.g. ethnicity/race (non-Hispanic white vs. other)), calorie intake, season of the year (warm months (April–September) vs. cool months (October–March)) and exposure to ETS (any vs. none)). This strategy of including these covariates in all of the mixed models was implemented for the sake of uniformity and to facilitate comparisons across nutrients (Table 3, model 1). β-Carotene, α-carotene, β-cryptoxanthin, lutein/zeaxanthin, lycopene, α-tocopherol and γ-tocopherol are carried exclusively in lipoproteins; therefore, we included total lipids in a second set of statistical models (Table 3, model 2) to correct for variation in serum lipids concentration.
As DAISY's selection criteria were based on the subject's genotype and whether they had a first-degree relative with type 1 diabetes, the variables for HLA genotype and first-degree relatives with type 1 diabetes were included in the final models to account for the recruitment selection regardless of whether they were significant correlates of the plasma concentrations.
For each of the plasma predictor values, the mixed model provides a regression coefficient, a standard error of that coefficient and a P-value that indicates the significance of the contribution of the variable towards explaining the plasma vitamin concentrations.
Results
The characteristics of the study subjects are shown in Table 1. Fourteen per cent of children had a first-degree relative with type 1 diabetes, and 49% were HLA-DR3/4 positive (i.e. the genotype at high risk of type 1 diabetes), reflecting the selection criteria of DAISY. While none of the children developed diabetes during the course of the study, 16 children did develop islet autoantibodies. All visits subsequent to the development of islet autoantibodies were excluded from the analysis. Males comprised 52% of the population, and 74% of the children were non-Hispanic white. Of those that were not non-Hispanic white, 54 were Hispanic, seven were African-American, three were Asian and two were American Indian. The age of the children ranged from 9 months to 8 years, with the mean age at first collection of a plasma sample for micronutrient measurements being 2.7 years.
Table 1 Baseline characteristics of the cohort, Denver Metropolitan Area, August 1997–August 2004 (n=257 subjects)

SD – standard deviation.
* Age at first clinic visit.
Age-specific normal ranges of plasma micronutrients
The predicted means and normal ranges of the plasma micronutrients at nine different ages are presented in Table 2. Within- and between-person variance is accounted for in these SDs.
Table 2 Estimated means and normal ranges* of plasma micronutrients from 815 measurements of 257 children from the Denver Metropolitan Area, August 1997–September 2004
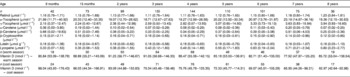
* Normal ranges represent 2 standard deviations from the mean. Within- and between-person variance is accounted for in these standard deviations. All micronutrients were transformed for the analysis, and then back-transformed for presentation in Table 2.
Predictors of plasma micronutrients
The adjusted estimates for the predictors of plasma micronutrients are shown in Table 3. Model 1 represents the adjusted estimates without controlling for lipid concentration, whereas model 2 represents the adjusted estimates controlling for plasma lipid levels. In both models 1 and 2, the concentration of plasma 25-hydroxyvitamin D was higher in those who consumed more dietary vitamin D, in non-Hispanic white children compared with other ethnicities, and during the warm months of the year compared with the cooler months.
Table 3 Predictors of plasma micronutrient levels* in 257 children, Denver metropolitan area, August 1997–August 2004 (n=815 visits)
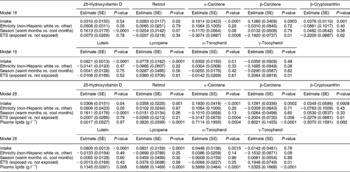
SE – standard error; ETS – environmental tobacco smoke; FFQT – food-frequency questionnaire.
* Plasma and FFQ variables were log-transformed prior to analysis (with the exception of lutein intake). Plasma 25-hydroxyvitamin D is presented in nmol l− 1 and the remainder of the plasma micronutrients are presented in μmol l− 1. The units for micronutrient intake are IU for vitamin D, retinol, α-tocopherol, and γ-tocopherol. All other micronutrient units are presented in μg.
† All models included the best-fitting age variable. If the relationship between the plasma variable and age was linear, then a simple age term was included in the model. If the relationship between the plasma variable and age was non-linear, quadratic and cubic age terms were included in the model, where applicable. In addition to the covariates listed, all models include human leukocyte antigen and family history of type 1 diabetes to account for selection criteria. Data were missing for ETS exposure on 27 children.
In both models 1 and 2, the plasma retinol level was significantly associated with retinol intake. Model 2 demonstrated that plasma lipids were also significantly associated with retinol concentration (Table 3, model 2). Dietary intake of each carotenoid (α-carotene, β-carotene, β-cryptoxanthin, lutein and lycopene) was significantly associated with each of the corresponding plasma concentrations, both when unadjusted for plasma lipids (Table 3, model 1) and when adjusted for lipid concentration (Table 3, model 2). Plasma lipid concentration was significantly associated with each of the plasma carotenoid concentrations (Table 3, model 2).
Plasma concentrations of α-carotene, β-carotene and β-cryptoxanthin were lower in children exposed to ETS. Unlike the other three carotenoids, lutein and lycopene were not significantly different in those children exposed to ETS vs. those who were not exposed.
The plasma α-tocopherol concentration was significantly and positively associated with dietary α-tocopherol and plasma lipid concentrations. Since we did not have a comparable dietary intake marker for plasma γ-tocopherol concentration, we tested to see whether α-tocopherol intake was associated with γ-tocopherol concentration, and it was not associated. γ-Tocopherol concentration was positively associated with plasma lipid concentration and with ETS.
Discussion
One of the purposes of this study was to generate standard reference values of micronutrients in a healthy paediatric population and relate these data to dietary intake of these nutrients. The children in the larger DAISY cohort were selected because they were at increased risk for type 1 diabetes, defined by HLA or family history of type 1 diabetes. However, the children in this study were free of disease at the time of testing. Furthermore, since HLA type and family history of type 1 diabetes were not associated with plasma concentrations, the fact that these children have a higher prevalence of these two factors than the general population should not impact the representativeness of the measures. Many of the previous studies have examined the relationship between biomarkers and disease outcome, whereas our study represents a healthy paediatric population.
Clinicians have differing opinions regarding whether micronutrient levels should be adjusted for total plasma lipids. Even though carotenoids and tocopherols are carried in plasma lipids, it is thought that the absolute rather than the adjusted levels may be the more important parameter related to human health. We present our means and normal ranges for the absolute levels of micronutrients, i.e. those that have not been adjusted for lipids, because this may be of most use to the clinician in the field who may be testing only one parameter to assess the health status of their patient. However, in order to investigate predictors of plasma micronutrient levels, we ran two sets of models, one set predicting the absolute micronutrient level and the other set adjusting for total lipids. Interestingly, while total lipids was a strong predictor of carotenoid and tocopherol levels, both sets of models produced similar results regarding the other predictors.
Total vitamin D intake was significantly predictive of 25-hydroxyvitamin D concentration, independent of ethnicity and season of blood draw. In general, plasma 25-hydroxyvitamin D levels were higher in the warmer (i.e. April–September) months. Our results highlight the importance of accounting for seasonality. For example, an earlier studyReference Lips, van Ginkel, Jongen, Rubertus, van der Vijgh and Netelenbos14 showed a significant correlation between vitamin D intake and serum 25-hydroxyvitamin D levels only among patients with low sunshine exposure (r = 0.54). We did not observe any gender differences (data not shown), as has previously been reported in adults whereby men have higher 25-hydroxyvitamin D levels than womenReference Omdahl, Garry, Hunsaker, Hunt and Goodwin15. In our population, 25-hydroxyvitamin D levels were higher in non-Hispanic whites, which probably reflects increased production of 25-hydroxyvitamin D in individuals with lighter skin colour.
Retinol and each of the carotenoid concentrations was significantly associated with each corresponding dietary value. Many previous studies did not evaluate the carotenoid values separately via an FFQ. For example, the carotenoid biomarkers were evaluated in relation to fruit and vegetable consumption rather than total nutrient consumptionReference Block, Dresser, Hartman and Carroll16, Reference Drewnowski, Rock, Henderson, Shore, Fischler and Galan17. Thus, our findings provide support for the FFQ as a valid measure of carotenoid status.
We were also able to examine the impact of ETS and its effect on the plasma biomarkers. Our results show that exposure to ETS is associated with lower levels of α-carotene, β-carotene and β-cryptoxanthin, independently of dietary intake. Our findings in a healthy paediatric population are generally in agreement with what has previously been reported in adults, where concentrations of β-carotene, α-carotene and β-cryptoxanthin were lower in individuals who were exposed to tobacco smoke, independent of dietary intake (reviewed in AlbergReference Alberg18). Our results are consistent with previous reports that showed that lycopene and lutein/zeaxanthin status is less strongly correlated with active smoking statusReference Alberg18. Fewer studies have examined β-cryptoxanthin, lycopene and lutein/zeaxanthin in comparison with α- and β-carotene. This may be due to a lack of information regarding the content of these nutrients in food. However, improved methods and nutrient analysis of the USDA food database will allow for more accurate analysis of these nutrients in the future. The observation that the association with ETS was seen in the provitamin A carotenoids (α-carotene, β-carotene and β-crypoxanthin) and not the non-provitamin A carotenoids (lutein and lycopene) suggests that these distinct types of carotenoids may respond differently to free radical exposure (e.g. exposure to ETS) in humans. In addition, ETS was not associated with α-tocopherol levels, but was associated with increased γ-tocopherol levels. A previous report showed no association between tocopherol status and smokingReference Alberg18. It is unclear why γ-tocopherol levels may be higher in children exposed to ETS; perhaps this observation may be due to our inability to control adequately for the influence of dietary intake on levels.
One of the strengths in this study is that these clinical values are based on prospective, longitudinal measurements rather than a cross-sectional measurement, as was the case in previous studiesReference Ford, Gillespie, Ballew, Sowell and Mannino19, Reference Gruber, Chappell, Millen, LaRowe, Moeller and Iannaccone20. This allows us to describe the interesting non-linear relationship between age and plasma micronutrients. In addition, our study population is much younger than that of previous studies, which analysed serum levels of vitamins and carotenoids in healthy 4–11-year-oldsReference Lips, van Ginkel, Jongen, Rubertus, van der Vijgh and Netelenbos14 and 6–16-year-oldsReference Omdahl, Garry, Hunsaker, Hunt and Goodwin15. An additional strength of this study is that we were able to account for potentially confounding variables, as the amount of data collected in DAISY is quite detailed. This is particularly important with regard to the lower levels of carotenoids in children exposed to ETS because we were able to show that these results were independent of dietary intake and other socio-economic factors.
In summary, we have explored factors that influence these plasma levels and have presented age-specific ranges of plasma micronutrients in a group of healthy infants and children from the DAISY study. Given that our data show that certain environmental factors (e.g. diet and ETS exposure) influence plasma levels, further research examining the impact of plasma levels on childhood diseases, such as type 1 diabetes or obesity, is warranted.
Acknowledgements
Sources of funding: This research was supported by National Institutes of Health grants R01-DK49654 and DK32493, Diabetes Endocrine Research Center, Clinical Investigation & Bioinformatics Core P30 DK 57 516, and the General Clinical Research Centers Program, National Center for Research Resources M01RR00069.
Conflict of interest declaration: The authors have no conflicts of interest.
Authorship responsibilities: The authors contributed as follows. Drafting the manuscript (H.B., J.M.N.), review of the manuscript for scientific content (M.M.L., R.J.S., J.A.S., M.J.R.), data collection and coordination (H.B., M.M.L., J.A.S.), data analysis (H.B., M.M.L., C.A.R., J.M.N.), design of the study (J.M.N., R.J.S.) and obtaining funding for the study (J.M.N., M.J.R.).
Acknowledgments: The authors would like to acknowledge the dedicated and talented staff of the DAISY study for their clinical, data and laboratory support. We are indebted to all the children and their families who generously volunteered their time and knowledge.


