


As starch is the major energy-yielding component of non-ruminant diets, its apparent digestibility in the small intestine is an important variable which governs the dietary energy value of compound diets(Reference Wiseman1). In young piglets, this variable has been shown to be considerably reduced in both the mid (0·5) and distal (0·75) regions of the small intestine (regions taken proportionally at 0·5 and 0·75 along from the gastric pylorus to the ileo-caecal valve, respectively) in the period following weaning, when the animal is introduced to a diet based on raw cereals(Reference White, Doucet and Hill2, Reference Doucet, White, Wiseman, Garnsworthy and Wiseman3). This reduction in starch digestion can, however, be lessened when cereals are processed, with extrusion under controlled conditions appearing to be a more favourable treatment than micronisation(Reference White, Doucet and Hill4). The digestibility of starch at weaning may be an important consideration in helping to alleviate, in part, the post-weaning growth-check commonly observed. The growth-check, resulting from a period of underfeeding along with a number of environmental and psychological stresses, can greatly compromise the overall growing and finishing performance of the animal(Reference Pluske, Hampson and Williams5). The recent removal of in-feed antibiotic growth promoters in the European Union may exacerbate this problem.
The optimum apparent digestibility of starch in the 0·5 and 0·75 small-intestinal regions of the young piglet remains unknown. For instance, an elevated apparent digestibility coefficient within the 0·5 region suggests enhanced digestion and a more rapid uptake of glucose. However, it is unclear whether a diet containing rapidly, in contrast to slowly, digestible starch is more beneficial for the piglet, although there is some evidence that the latter may lead to better overall performance in broiler chickens(Reference Weurding, Veldman and Veen6). In contrast, a low apparent digestibility coefficient indicates that a significant amount of starch has escaped digestion in the small intestine and is subsequently available for fermentation within the large intestine(Reference Giroux, Martineau and Robert7). Opinion is divided as to whether starch bacterial fermentation in the hindgut is beneficial (generation of volatile fatty acids, leading to a lowering of pH and subsequent absorption by colonocytes) or detrimental (proliferation of pathogenic microbes leading to post-weaning scouring); the latter may predominate.
Starch digestibility in piglets is highly variable. Frequently overlooked factors associated with the starch source that may affect digestibility include endosperm texture(Reference White, Doucet and Hill2, Reference Wiseman8), genetic variability between and within cereal species(Reference Wiseman8, Reference Rudi, Uhlen and Harstad9), processing techniques and variables(Reference White, Doucet and Hill2–Reference White, Doucet and Hill4) and concentration of endogenous amylase(Reference White, Doucet and Hill2). The analysis of starchy materials (for example, cereals) used in piglet diets has generally consisted of, and is often limited(Reference Doucet, White, Wiseman, Garnsworthy and Wiseman3) to, the determination of their gross chemical composition (i.e. DM, ash, crude protein, crude fat, and starch), and of gelatinised starch as a proportion of total starch using enzymic hydrolysis(Reference Medel, Salado and de Blas10, Reference Medel, Latorre and de Blas11). However, these measurements provide no useful information on the properties of the starch component in relation to its digestibility in piglets. These limitations can be overcome with the application of reliable quantitative laboratory tests(Reference White, Doucet and Hill2–Reference White, Doucet and Hill4) that have been used in the field of human food development for a number of years. The physico-chemical properties of starch that are believed to be fundamentally associated with the quality of feed materials and that were found to correlate to varying extents with in vivo starch digestibility(Reference White, Doucet and Hill2–Reference White, Doucet and Hill4) fall into three categories (Table 1): (1) hydration properties; (2) structural properties; (3) in vitro amylolytic digestion. A number of complementary tests are required to build a complete and accurate representation of starch properties (Table 1) and have been described in detail elsewhere(Reference Doucet, White, Wiseman, Garnsworthy and Wiseman3). Recent studies(Reference White, Doucet and Hill2–Reference White, Doucet and Hill4) demonstrated that (1) these tests were successful in showing that variations in processing techniques (unprocessed v. micronised v. extruded cereals) and variables (for example, heat, mechanical stress, moisture content) affected the physico-chemical properties of starch differently, (2) the effects of these variations were apparent in the biological responses of piglets, and (3) there was a good correlation between measured in vitro starch characteristics and in vivo starch digestibility within the small intestine of the weaned piglet. The good correlation suggests that in vivo starch digestion could be predicted with reasonable accuracy from in vitro measurements of cereal diet characteristics. The present study examined the validity of this hypothesis using principal components analysis (PCA).
Table 1 In vitro variables describing the hydration and structural properties and the in vitro amylolytic digestion of starch in relation to its digestibility in piglets
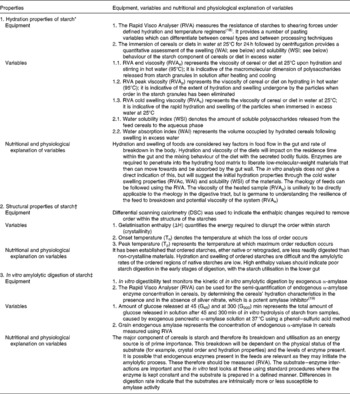
* Hydration and subsequent solubility and swelling are key differences between cereal diets and these factors are changed on processing feeds. The RVA profile ideally fingerprints the material so that the feeds can be compared and the changes in the hydrodynamic volumes of the feeds are expected to impact on enzyme penetration into the hydrating matrix, product release and mixing within the gut.
† The structural characterisation of starch granules in raw and processed cereals allows the identification of the amount and stability of native starch granules used in diets and the quantification of starch conversion following processing. This can help explain the changes in hydration properties that are caused by different types of processing conditions. The combined structural and hydration examination of starch helps to identify possible artifacts that are inherent to specific methodologies.
‡ The botanical source of the starch and how it is processed influence the intrinsic hydration and structural characteristics of raw and processed starches and this in turn affects the rate and extent of starch hydrolysis by α-amylase(20).
Materials and methods
Piglet trials
Diets
Seventeen experimental diets were evaluated through five piglet trials, which have been described in detail elsewhere(Reference White, Doucet and Hill2–Reference White, Doucet and Hill4). Each diet contained a different source of starch, either in the form of raw cereal or as processed hard or soft wheat (micronised or extruded), incorporated at the same rate of 586 g/kg (Table 2). Diets also included (g/kg): hipro soya (150), skimmed milk (175), vegetable oil (50), lysine (4·6), methionine (1·6), threonine (1·7), tryptophan (0·3), salt (5·0), limestone (4·1), dicalcium phosphate (9·2) and a vitamin–mineral premix (12·5). None of the diets contained antibiotic growth promoters or zinc oxide. Two wheat cultivars were used throughout the trials, which were of similar genetic background, identical chemical composition (including protein levels), grown under the same agronomic conditions, but differing in endosperm texture (hard (11·2) and soft (6·3) as measured with the Bran & Luebbe Infra-analyser 260 NIR(Reference White, Doucet and Hill4)). Two batches of soft wheat were used in the research programme; the first batch for trials 1, 2 and 3, the second batch for trials 4 and 5. Soft wheat batches were of the same variety, grown by the same breeder at the same location, but were from two different harvest years. The cereals were ground through a 1·5 mm screen using a hammer mill and mixed with the basal diet. Diets were manufactured in the University of Nottingham experimental animal feed mill.
Table 2 Description of starch sources and processing conditions for all experimental diets, and dietary numbers allocated for principal components analysis (PCA)
HW, hard wheat; SW, soft wheat; SME, specific mechanical energy.
* SME corresponds to the level of mechanical input used during extrusion processing. It is calculated as follows:
† Elevated endogenous amylase content.
‡ Pigs from different supplier.
Trials
Five piglet trials examined the extent to which in vivo apparent starch digestibility coefficients in the small intestine (taken proportionally at 0·5 and 0·75 along from the gastric pylorus to the ileo-caecal valve) as well as other biological responses(Reference White, Doucet and Hill2, Reference White, Doucet and Hill4) were affected by diets differing in the source of starch. Starch sources and exact processing conditions used for each trial are summarised in Tables 2, 3 and 4. Two diets were evaluated in trial 1, which either contained raw hard wheat (diet 1) or raw soft wheat (diet 2) as described above. Four diets were evaluated in trial 2, containing either hard wheat micronised at high (diet 3) or low (diet 5) degree of cook, or soft wheat micronised at high (diet 4) or low (diet 6) degree of cook. Four diets were evaluated in trial 3, containing either the raw soft wheat used in trial 1 (diet 2), or soft wheat extruded at low (diet 7) or high (diet 9) specific mechanical energy (SME), or hard wheat extruded at high SME (diet 8). Four diets were evaluated in trials 4 and 5: trial 4 diets contained either soft wheat from a different batch from that in trial 1 (diet 10), barley (diet 11), rye (diet 12) or triticale (diet 13); trial 5 diets contained either the same soft wheat as in trial 4 (diet 14), naked oats (diet 15), whole oats (diet 16) or maize (diet 17). Soft wheat in trial 5 was allocated a separate dietary number from the soft wheat used in trial 4 because piglets used in trial 5 shared the same genotype, but were sourced from a different supplier from those animals in the other four trials. The same rate of inclusion of all cereals was employed (586 g/kg) for consistency because this represents an approximate average employed in practice, accepting that different cereals would have different rates of inclusion.
Table 3 Micronisation processing variables used in the study
Table 4 Extrusion processing variables used in the study
SME, specific mechanical energy.
* During processing (water added).
Animals, housing and management
Entire male piglets (Large White × Landrace) weaned at age 28 d (8–12 kg live weight) were employed. Animals were individually weighed and transferred to an environmentally controlled (28–32°C; lighting regimen of 16 h light and 8 h dark) experimental unit. Animals were housed in individual pens with semi-slatted floors, two nipple drinkers and a feed trough. The piglets were randomly allocated to a specific experimental diet (ten piglets per diet for each trial), which was fed in meal form and on an ad libitum basis. Fresh water was also available ad libitum.
Experimental procedure
For each trial, ‘control’ piglets were slaughtered on day 0 (day of weaning), as these animals possessed the same intestinal gut morphology as a suckling piglet and therefore acted as control groups for each of the studies. Two (trial 1) or four (trials 2 to 5) animals were slaughtered on day 0, with two piglets from each dietary group slaughtered at days 2, 4, 6, 10 and 14 post-weaning (n 4 (trial 1) or 8 (trials 2 to 5) on each day). The experimental period was 14 d. Experimental protocols were all within the relevant and official University of Nottingham codes of practice applying to care and management of animals.
In vivo analysis
General procedures post-slaughter involving the collection of tract digesta have been described elsewhere(Reference White, Doucet and Hill2).
Determination of apparent starch digestibility
All analyses were conducted in duplicate with repetition if variation was > 5 %. Diet samples were dried for approximately 48 h in a forced draft oven set at a temperature of 105°C for determination of DM. Digesta were freeze-dried before laboratory analysis. Starch content was estimated by solubilisation of starch with dimethyl sulfoxide, sodium acetate buffer and amyloglucosidase enzyme solution using a total starch assay kit (Megazyme International Ireland Ltd, Bray, Co. Wicklow, Republic of Ireland; AOAC method 996.11, AACC method 76.13). A GOPOD glucose determination reagent solution was used to quantify the released glucose by reading the absorbance with a SP6-500 UV spectrophotometer (Pye Unicam Ltd, Cambridge, Cambs, UK) at 510 nm. Coefficients of apparent digestibility for starch were calculated. These were determined through estimation of the concentration of acid-insoluble ash (thus representing an inert marker) in the trial samples. In vivo data employed in subsequent PCA were means across all time points; preliminary examination of individual time points did not reveal any meaningful responses.
In vitro feed characterisation
Several methodologies (Table 1) were used to examine differences in structure, hydration and in vitro digestive properties between raw and processed starches in cereals and in diets. A total of seventeen in vitro variables were determined and selected for PCA (Table 5).
Table 5 List of seventeen in vitro starch variables measured for each experimental diet

RVA, Rapid Visco Analyser.
Structural properties
Differential scanning calorimetry is a thermo-analytical technique that measures the difference in the amount of heat required to increase the temperature of a sample and inert reference material in two sealed containers. This analysis was used to monitor the degree of thermal transition in each cereal, based on the principle that native starch has no loss of crystallinity (0 %) and that a theoretically fully cooked sample has lost all crystallinity (100 % loss). In the present experiments cereal samples were immersed in excess water and then heated at 10°C per min. This caused complete gelatinisation of any amylopectin crystallites present in the starch. Four variables were recorded for each cereal: the onset temperature (To) at which gelatinisation starts; the peak temperature (Tp), also called temperature of gelatinisation; the end temperature (Te), at which gelatinisation is complete; and the gelatinisation enthalpy (ΔH), also called enthalpy of transition, which is calculated to quantify the degree of crystallinity of the starch component.
Hydration properties
The Rapid Visco Analyser (RVA) was used to analyse the pasting of starch. It measures the torque required to stir starch–water suspensions under defined hydration and temperature regimens. The process provides viscosity estimates of the system as it is heated and then cooled at a uniform rate. In the present experiments, six variables (three for cereals and three for the corresponding diets) were recorded: the cold swelling viscosity (RVAc; a measure of the rapid absorption of water by the cereal or diet particulates when immersed in excess water at 25°C, often associated with precooked starches); the gelatinisation, or peak, viscosity (RVAp; a measure of the maximum viscosity upon heating samples to temperatures over 60°C, often associated with the gelatinisation and hence swelling of starch granules); and the end viscosity after the samples had been heated to 95°C for 6·5 min, cooled back to 25°C over 10 min, and finally held at 25°C for 7 min (RVAe; a relative measure of the viscosity of the stirred gelatinised starch paste once cooled and stabilised at ambient temperature).
The water absorption index (WAI) and water solubility index (WSI) are two quantifiable parameters which are commonly used to assess the swelling and solubility behaviour of the starch component of cereals in excess water. WAI represents the volume occupied by the hydrated starch following swelling in excess water, whereas WSI denotes the amount of soluble polysaccharides released from the granules to the aqueous phase. WAI and WSI were determined for each cereal and the corresponding diets, giving four additional variables.
In vitro amylolytic digestion
This analysis monitors the hydrolysis of each sample initiated by exogenous pancreatic α-amylase solution at 37°C using a phenol–sulfuric acid method to determine the total amount of glucose released over time. In the present experiments, this analysis provided two additional variables: amount of glucose released at 45 min (G45) and at 300 min (G300). A variation of this protocol (i.e. no exogenous enzyme added) was also used to give another variable: the concentration of endogenous α-amylase in all cereals. Endogenous amylase concentration in cereals has hitherto been a largely neglected factor in animal trials. However, recent work(Reference White, Doucet and Hill2) has provided strong evidence that this may be an important variable that needs careful consideration in the planning of animal feed studies.
Multivariate analysis
An individual number was allocated to each of the seventeen dietary treatments analysed in the five piglet trials (Table 2). Each of the raw wheat batches was allocated a different dietary number in order to identify whether variation in endogenous amylase content could be distinguished using the model. In addition, the soft raw wheat from trial 5 was also allocated an individual dietary number in order to determine whether animal variation (different pig suppliers used for this trial) had any notable effect.
Variations in starch properties in the seventeen experimental diets as a consequence of cereal source and processing were quantified using the aforementioned complementary set of in vitro methodologies, with PCA then being used to confirm that they were able to separate out the seventeen experimental diets by showing any segregation or different groups of diets within the in vitro dataset. In vitro analyses of all cereals evaluated were then employed using PCA to predict in vivo apparent starch digestibilities at the 0·5 and 0·75 small-intestinal regions in piglets.
In vitro differences between diets
PCA was used to analyse the in vitro dataset consisting of seventeen measurements (Table 5) of the seventeen diets (Tables 2, 3 and 4), using Matlab (R14 l; The MathWorks Inc., Natick, MA, USA) and the PLS Toolbox v. 3·5 software (Eigenvector Research, Inc., Wenatchee, WA, USA). Data were pre-processed using auto-scaling, i.e. per variable (measurement) the average is subtracted and consequently scaled to unit variance, in order to correct for the differences in variance between the different types of measurement. The use of PCA enabled as efficient a deconvolution of the variance present in the dataset as possible into a set of linear combinations (also called principal components), consisting of scores (weight factors per sample) and loadings (correlated measurement trends). The principle is that, as the algorithm maximises the explained variance, each consecutive principal component then explains less variance than the previous one. Therefore, the bulk of the variance is explained in the first few principal components and it is sufficient to inspect only those, approximating the dataset as a set of a few simple linear combinations of the original measurements. The scores found by PCA described the dis-(similarities) between samples, effectively showing a clustering of similar samples, whilst the loadings described the measurements and their correlation that lead to the clustering. Inspection of graphical representations of the loadings and scores enabled a very fast and intuitive visualisation of the main trends present in the dataset of measurements, simplifying the inspection of many measurements on many samples greatly.
Linking in vitro starch variables to in vivo apparent starch digestibility coefficients
An average coefficient of apparent digestibility value for starch at the 0·5 and 0·75 small-intestinal regions in piglets (ten piglets per diet) was calculated for each individually numbered diet. In order to model the correlation of the in vitro variables with the in vivo digestibility coefficients, partial least squares (PLS) regression was applied. PLS works along similar lines as PCA, but, instead of purely describing a dataset of measurements, it achieves a representation of the regressors (herein the in vitro starch variables, where the standard errors are less than 2 %) that shows maximum correlation with the regressand (herein the in vivo starch digestibility coefficients). The regression model found with PLS was used both to predict the dependent variable(s) and to inspect the regression coefficients to find the most important relationships between independent and dependent variables. The advantage of PLS regression over, for example, multiple linear regression was that PLS can cope with correlated independent variables, as the PLS algorithm uses the correlation between the independent variables to summarise the data whilst predicting the dependent variable.
Before applying PLS, the dataset was auto-scaled analogous to PCA modelling. Leave-one-out cross-validation was used to estimate how many latent variables (the PLS term analogous to the ‘PCA principal components’) were necessary to build a stable regression model. Selection of the in vitro variables showing the strongest regression coefficients was then applied to find a more concise PLS regression model for the starch digestibility coefficient.
All animal protocols and procedures were conducted under both National and Institutional guidelines as approved in advance by the Ethical Review Committee of the School of Biosciences of the University of Nottingham, UK.
Results
In vitro differences between diets
PCA was conducted to explore the ability of seventeen measured in vitro variables describing the physico-chemical properties of starch, to differentiate between seventeen experimental piglet diets with varying starch sources and processing conditions. Principal component 1 (0·47) and principal component 2 (0·25) together explained 0·72 of the variation in starch properties between experimental diets. The scores plot of principal component 2 v. principal component 1 showed a clear pattern for some of the diets (Fig. 1(a)). Diets 1 and 2 (containing raw hard and soft wheat, respectively, with little, if any, endogenous amylase) and diets 3, 5 and 6 (containing hard wheat micronised at low or high degree of cook and soft wheat micronised at low degree of cook) were gathered together around the zero point or slightly negative on principal component 1 but positive on principal component 2. Inspection of the loadings plot (Fig. 1(b)) showed that the position of the samples in the scores plot must have been characterised by elevated RVAp and RVAe variables, whilst showing low values for RVAc, WAI and WSI. Diet 4 (containing soft wheat micronised at high degree of cook) was located around the zero point, signifying overall intermediate values for the in vitro parameters. A similar observation was made for diets 14 and 15. Diets 7, 8 and 9, which contained extruded hard and soft wheats, were gathered together around the zero point on principal component 2 but positive on principal component 1. They exhibited high values for RVAc, WAI, WSI, G45 and G300, and lower than average values for RVAp, RVAe and ΔH. Diets containing raw cereals or soft wheat with some endogenous amylase (diets 10 to 17; trials 4 or 5) were more widely spread, mostly within the bottom left quadrant (negative on both principal component 1 and principal component 2), and showed mostly elevated endogenous amylase concentration in combination with higher temperatures in the differential scanning calorimetry analysis and lower values for WSI, RVAp, RVAe, G45 and G300.
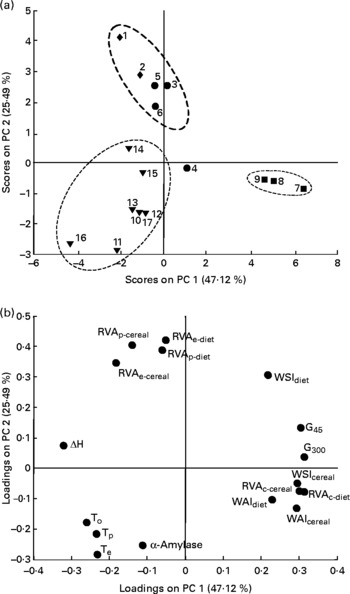
Fig. 1 Principal components (PC) analysis of in vitro starch variables, auto-scaled data (total variance explained: R 2 0·72). (a) Samples/scores plot (seventeen experimental diets, see Table 2; ♦, raw hard and soft wheats with negligible amount of endogenous amylase; ▾, raw cereals with some endogenous amylase; ●, micronised hard and soft wheats; ■, extruded hard and soft wheats. (b) Variables/loadings plot (seventeen in vitro variables; see Table 5).
Linking in vitro starch variables to in vivo apparent starch digestibility coefficients
Having shown that the in vitro analyses describe the diets, an attempt was made to correlate the physico-chemical data from the diets (in a normalised format by mean centring and unit variance scaling) with the starch digestibility coefficients. It is important to point out that the animal variability in starch digestibility is such a large contributor to the starch digestibility variance that it would be impossible to build significant multivariate regression models based on individual piglet data. The pooled variance between replicate piglets (two animals per diet per time point) was 0·055 compared with the total variance for the starch digestibilities, which was 0·062. By averaging the in vivo apparent starch digestibility coefficient at the 0·5 intestinal region over the piglets, a model can be obtained that will describe an average trend that is valid for at least ten piglets. Consequently, the model should only be seen as a quantitative description of a general trend for post-weaning piglets aged between 4 and 6 weeks, rather than a tool to predict individual piglet data. PLS regression, along with leave-one-out cross-validation, showed that a PLS model, using two latent variables, can predict (R 2 0·74) the in vivo starch coefficients in the 0·5 small-intestinal region in the piglet from the seventeen in vitro variables. Reducing the number of in vitro variables from seventeen to the seven with the strongest regression coefficients decreased the regression coefficient only marginally (R 2 0·71) but led to a more concise and interpretable model with not only fewer variables (seven instead of seventeen) but also made use of only one latent variable. The seven strongest in vitro variables to predict the in vivo starch digestibility coefficient at 0·5 small-intestinal region are:
RVAe, i.e. viscosity of diet at 25°C upon hydration in hot water (95°C) (indicative of the macromolecular dimension of polysaccharides released from starch granules in solution);
RVAp, i.e. viscosity of diet on hydrating in hot water (95°C) (indicative of the extent of hydration and swelling undergone by starch granules in hot water);
ΔH, gelatinisation enthalpy (provides an estimate of helical order or degree of crystallinity in starch);
WSI, denoting the amount of soluble polysaccharides released from starch granules to the aqueous phase;
Grain endogenous amylase, i.e. concentration of endogenous α-amylase in cereals, assessed by pasting cereal flours in 25 g of AgNO3 (amylase inhibitor) v. water using RVA.
G45, glucose released at 45 min, i.e. amount of glucose released in solution after 45 min of in vitro hydrolysis of starch from samples caused by exogenous pancreatic α-amylase;
G300, glucose released at 300 min, i.e. amount of glucose released in solution after 300 min of in vitro hydrolysis of starch from samples caused by exogenous pancreatic α-amylase.
The seven strongly correlated in vitro variables along with their correlated regression coefficients are shown in Table 6, whilst the quality of the regression (one latent variable after leave-one-out cross-validation, auto-scaling as pre-processing) is visualised in the plot of leave-one-out cross-validation predicted v. measured in vivo starch coefficients (Fig. 2).
Table 6 Regression coefficients depicting in vitro variables strongly correlated with in vivo digestibility coefficients of starch at the 0·5 small-intestinal region in the weaned piglet
RVA, Rapid Visco Analyser; ΔH, gelatinisation enthalpy; DSC, differential scanning calorimetry; WSI, water solubility index.
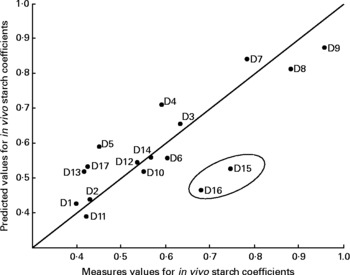
Fig. 2 Predicted v. observed values for in vivo starch coefficients at the 0·5 site of the small intestine for the seventeen experimental diets (D1 to D17; see Table 2). Partial least squares model with two latent variables and auto-scaled data (R 2 0·71). Each prediction is done on a ‘leave-one-out’ basis, i.e. the predicted sample was not used to build the predicting model, giving a reasonable estimation of real prediction error for unknown samples.
The resulting location of the data points in the regression graph revealed that the extruded wheat diets (diets 7, 8 and 9) were clearly separate from the other dietary values. Data from the micronised wheat diets (diets 3, 4, 5 and 6) were not noticeably different from the values from the raw cereals. The model was also able to distinguish between the batches of soft wheat with high amylase content (diets 10 and 14) and the second batch of wheat with a lower concentration of enzyme (diet 2). Only two diets (diets 15 and 16), that contained naked oats and whole oats, respectively, out of the seventeen cereal-based diets studied, were clearly remote from the measured values, both being predicted by the linear regression.
Repetition of the PLS model using the starch coefficients from the 0·75 small-intestinal region revealed a less strong correlation with the in vitro variables and did not lead to meaningful regression models (data not shown).
Discussion
In vitro differences between diets
Although starch is generally the most abundant and major energy-yielding component of piglet diets, it remains a largely misunderstood parameter in animal nutritional trials. The basis of this misunderstanding is founded on two commonly encountered, but essentially incorrect, assumptions. The first assumption is that cereal starch is of comparatively constant nutritional value, regardless of variety, endosperm texture and growing environment. However, this assumption is undermined by the wide range found in the structural and hydration properties of starch among raw cereal species and among varieties within species, whether closely or distantly related. These variations in starch properties have important implications for starch digestibility in newly weaned piglets(Reference White, Doucet and Hill2). For instance, raw cereal starches with an elevated concentration of endogenous amylase may be more rapidly digested by piglets than those with a lower endogenous amylase concentration. The second assumption is that processing of starch (or cereal) supplies a ‘cooked starch’ (or ‘cooked cereal’); such processed products are labelled as such regardless of the processing technique and variables used(Reference Doucet, White, Wiseman, Garnsworthy and Wiseman3). However, progress in human food science has shown that processing causes a continuum of complex structural changes to the starch component of cereals (commonly termed ‘starch conversion’(Reference Frazier, Donald and Richmond12)). The nature and extent of these changes depend on the type of processing, the processing variables used and the physico-chemical properties of the raw cereal before processing(Reference Doucet, White, Wiseman, Garnsworthy and Wiseman3, Reference White, Doucet and Hill4, Reference van den Einde, van der Goot and Boom13, Reference Sauer, Mosenthin and Pierce14). These changes in starch structure result in a wide range of hydration characteristics, which have been shown to influence starch digestibility in the small intestine of the young piglet(Reference White, Doucet and Hill2–Reference White, Doucet and Hill4).
The five aforementioned trials used a selection of in vitro food science tests to provide seventeen in vitro variables believed to give a thorough description of the structure, hydration properties and in vitro amylolytic degradation of the starch component for all seventeen experimental diets. Previously-presented data from the individual trials(Reference White, Doucet and Hill2, Reference White, Doucet and Hill4) has indicated fundamental differences in starch properties between diets. PCA was conducted in the present study and supported these initial observations. The degree to which PCA was able to show any segregation or different groups of experimental diets within the dataset was encouraging. Although a larger number of diets are required to assert this preliminary finding, the inclusion of seventeen different dietary samples in PCA was sufficient to identify clear patterns, with 0·72 of the variation in starch properties between diets being explained by two principal components generated from the seventeen in vitro variables.
Based upon their physico-chemical properties, the seventeen experimental diets could be sub-divided into three distinct groups. Group A was composed of diets containing either raw (diets 1 and 2) or micronised (diets 3, 5 and 6) wheat with very low endogenous amylase concentration. These diets exhibited elevated RVA viscosities on hydration in hot water, no swelling in excess cold water, and low water absorption and solubility. These similarities in properties for raw and micronised wheat confirmed that the micronisation regimens used were very mild and did not disturb starch granules, an observation already made with the associated piglet studies(Reference White, Doucet and Hill4).
Group B included diets based on extruded wheat (diets 7, 8 and 9) and was characterised by diets with low RVA viscosities on hydration in hot water, major swelling in excess cold water, elevated water absorption, water solubility and rate of amylolytic digestion, and low crystallinity. The location of this group in the PCA plot indicated that extruded wheat diets were clearly separate from the other diets. Diet 4 (soft wheat micronised under high cook conditions) was located at an intermediate position between raw and extruded soft wheat, confirming that only starch in diet 4 had undergone some degree of disruption as a result of micronisation processing(Reference White, Doucet and Hill4).
Group C was more widely spread and contained raw cereals with varying concentrations of endogenous amylase (diet 10 to diet 17). Elevated endogenous amylase concentrations were positively correlated with low RVA viscosity on pasting, confirming that cereal starches will undergo enzymic degradation as soon as the crystalline structure is lost(Reference White, Doucet and Hill2). Overall in the linear equation linking the variables there was negative correlation between the endogenous amylase concentration and the rate of in vitro digestion. It should be noted that the in vitro measures are carried out on ground samples that should still retain the features, such as endosperm structure and starch crystallinity, of the original cereals. The model was therefore clearly able to distinguish between diets formulated from the batch of soft wheat with a high amylase content (diets 10 and 14) and the second batch of wheat with a lower enzyme concentration (diet 2), confirming the importance of this hitherto neglected variable on starch properties(Reference White, Doucet and Hill2).
At its present stage, the model was unable to distinguish between samples extruded under different conditions, or between raw wheats with varying endosperm texture. The future inclusion of a larger number of experimental diets is likely to improve the level of sensitivity of the computer model.
Linking in vitro starch variables to in vivo apparent starch digestibility coefficients
The selection of variables composing the regression equation supports the published argument(Reference Doucet, White, Wiseman, Garnsworthy and Wiseman3) whereby the combined knowledge of three types of starch properties (i.e. structure, hydration and in vitro amylolytic digestion) is required before selecting and incorporating starch-based materials in animal feeds. Each of these properties is represented in the equation: starch amount and structure (ΔH for cereal); starch hydration (RVAe of diet, RVAp of diet and WSI of cereal); amylolytic digestion (G45 and G300). However, these parameters will be interdependent and reflect not only the primary factors in the cereals, but also the methodologies used in the sample preparation and the assay techniques employed. Although quite a comprehensive range of in vitro techniques was employed to correlate with the starch digestibility data, many other factors could have been measured. Little is understood about the key factors in the composition and microstructure of foods that facilitate their digestion within the gut. The current model suggests that seven variables need to be determined for each experimental diet in order to obtain a good prediction of the resulting in vivo starch coefficient at the 0·5 site. It should, however, be remembered that the use of the model is currently limited to diets based on cereals, included in the diet at a rate of 586 g/kg. Additionally, it should be noted that the selection of variables for the final model (based on seven measurements) could be carried out using different methods which would result in different subsets of selected variables. As shown by the PCA, the in vitro measurements are highly correlated, and therefore it is perfectly feasible that different subsets of variables will carry the same information. The seven variables selected by the size of their regression coefficients might therefore be substituted by another subset which would be expected to describe again the three types of starch properties (i.e. structure, hydration and in vitro amylolytic digestion). A much larger study and application of different variable selection methods would be needed to give a more definitive selection of ‘best’ in vitro variables. The present study is aimed at showing the feasibility of applying multivariate statistical methods to arrive at interpretable and predictive models.
Although the model may need more refining to differentiate between wheats with varying endosperm texture (and also a measure of the hardness should be included in the physico-chemical parameters), it was able to distinguish between batches of soft wheat with varying endogenous amylase concentrations. The model indicates that an elevated concentration of endogenous amylase is negatively correlated with digestion coefficients. This model also contains negative correlations for RVA values and positive correlations for in vitro digestibility. The endogenous amylase could be expected to have a major lowering effect on the viscosity parameters and an increasing effect on the digestion rates; hence within the model the negative values for amylases might act as a modifier for the other values. This underlines the complex nature of multi-factored models and each component cannot be considered individually. The model strongly suggests that well-designed animal trials must involve pre-testing of all dietary cereals for endogenous amylase concentration before their inclusion in experimental diets and the recognition that it can affect other in vitro data. To highlight this potential additional variable, it is suggested that measured endogenous amylase concentrations should be reported in all animal feed trials.
The model was also able to emphasise the beneficial effect of extrusion over micronisation for the improvement of starch coefficients at the 0·5 site. This confirmed the importance of carefully selecting processing techniques to be used before running animal trials(Reference Doucet, White, Wiseman, Garnsworthy and Wiseman3, Reference White, Doucet and Hill4). Whilst micronisation is a commonly applied heat-processing technique in animal studies, the in vitro tests performed in the present trials demonstrated that this method of processing, as carried out for the present studies, had caused only very limited disruption to the starch granules, which in turn limited the improvement in starch digestibility in vivo (Reference Doucet, White, Wiseman, Garnsworthy and Wiseman3, Reference White, Doucet and Hill4).
Extrusion, on the other hand, was more effective in improving the hydration properties of starch and induced nearly complete digestion of starch (coefficient of apparent digestibility > 0·8) in the small intestine of piglets. Extrusion processing has already been shown to lessen the reduction in apparent starch digestibility on day 4 post-weaning, typically seen at the 0·5 intestinal region in piglets fed an unprocessed wheat diet, which may have implications in helping to alleviate the post-weaning growth-check(Reference White, Doucet and Hill4). It is a versatile technique that is already used routinely in the human food industry to produce starch materials with very specific physico-chemical properties, in a reproducible manner. Although studies examining the use of extrusion processing in weaned piglet diets appear to give somewhat mixed conclusions(Reference Medel, Salado and de Blas10, Reference Hongtrakul, Goodband and Behnke15), it is possible that at least some of this disparity may originate from a misconception about the amount of starch conversion resulting from the processing method. This is illustrated by the fact that processing variables are rarely cited in the published literature, making comparison between studies difficult.
Only two diets, containing either naked or whole oats, did not appear strongly to fit the model, with the corresponding in vivo digestibility coefficients being largely underestimated. Although no experimental attempt was made to explain the observed divergence between measured and predicted values, it is conceivable that components other than starch in oats may have affected some of the in vitro variables obtained. For instance, oats (but also barley) differ markedly from the other cereals in the amount of β-glucan they contain(Reference Sirkka and Jorma16). It is known that β-glucan swells progressively and rapidly when placed in excess water(Reference Brennan and Cleary17). This swelling behaviour may have affected some of the measured in vitro variables, especially the WAI and WSI values. In addition, the in vitro amylolytic digestion method used is a relatively simple α-amylase assay, and β-glucan may have interfered with the ability of the exogenous enzyme to interact with the starch. The use of xylanase, in lieu of amylase, in a more complex assay may have given digestibility data in better agreement with the other cereals. Future work on quantitative assessments of NSP may thus be warranted. Extruding or micronising the oats might have brought them in line with the other cereal values, although this was not tested in the present study.
Conclusion
The present study provides evidence that in vitro measurements of physico-chemical properties of starch granules from raw and processed cereals (determined using a range of accurate and quantitative tests developed in the field of human food science) can be used to predict apparent starch digestibility coefficients at the 0·5 site of the small intestine in the weaned piglet. The present findings provide a link between dietary composition and average digestibility over a 14 d period. Thus, the average digestibility of a diet offered for the first 2 weeks post-weaning could be predicted. The present study does not contain sufficient data to investigate in more detail the digestibility at various stages during post-weaning and, because the model is preliminary at present, further animal trials would be needed to validate these findings. In future the multivariate modelling approach presented could be extended by examining changes in digestibility over time, allowing for investigation of dietary manipulations during critical time windows in the first 2 weeks post-weaning. It should also been remembered that the use of the model is currently limited to diets based on cereals, included in the diet at a rate of 586 g/kg, but did encompass different cereals, processes and piglets demonstrating very different rates of growth. In its current form, the predictive model does not apply to diets that contain variable amounts of cereals, since most of the in vitro variables used in the equation (for example, RVAe, RVAp, WSI) do not correlate linearly to the amount of starch in diets. It is clear that such an approach could be used to identify not only variation between cereal types and endogenous amylase concentration between different batches of a named cereal, but also the effect these parameters have on starch digestibility within the small intestine of the young piglet.
Acknowledgements
The present study was supported by ABNA Ltd, Frank Wright Ltd, Home-Grown Cereals Authority, Meat and Livestock Commission/British Pig Executive, Primary Diets Ltd and Provimi Ltd with match funding from the Department for Environment, Food and Rural Affairs (Defra), through the Sustainable Livestock Production LINK programme (LK0652). The authors would like to thank Dr Eunice Lee, Marcus Mitchell, John Corbett and Neil Saunders for technical assistance. The research was performed at the University of Nottingham School of Biosciences, UK.
The contribution of each author was agreed as follows: F. J. D., conception, rheology; G. A. W., rheology, generation of animal data; F. W., statistical analyses, PCA; S. E. H., conception; J. W., conception. All authors were involved in data interpretation and preparation of the manuscript.
The authors had no conflicts of interest.
The supplementary material for this article can be found at http://www.journals.cambridge.org/bjn


