


In order to prevent overweight, insight into the role of energy balance-related behaviours (EBRB) is important, as it supports the design of interventions targeting these behaviours. Multiple Health Behaviour Research (MHBR) seems to be of great importance when interventions are developed and evaluated(Reference Prochaska, Spring and Nigg1). The rationale for this is that health behaviours tend to co-occur, although controversies about their co-occurrence as well as in their association with adolescent overweight exist. Sedentary behaviour is found to be associated with snacking behaviour, lower fruit and vegetable intake or lower physical activity (PA) levels(Reference Zabinski, Norman and Sallis2–Reference Lioret, Touvier and Lafay6). Other researchers found low correlations between sedentariness and PA, and between fruit and vegetable intake and PA(Reference Van der Horst, Chin A Paw and Twisk7, Reference Keller, Maddock and Hannöver8). Regarding associations between being overweight and health behaviours, no clear relation is found for fruit and vegetable intake(Reference Field, Gillman and Rosner9–Reference Te Velde, Twisk and Brug11). Several cross-sectional studies show that the combination of high sedentary behaviour and low levels of PA results in the highest odds for being overweight(Reference Zabinski, Norman and Sallis2, Reference Driskell, Dyment and Mauriello12–Reference te Velde, de Bourdeaudhuij and Thorsdottir15). In a large cohort of the Health Behaviour in School-aged Children (HBSC) study, an inverse relation was found between the intake of sweets and being overweight(Reference Janssen, Katzmarayk and Boyce10).
Until now, most of the studies have investigated associations of health behaviours by cross-sectional design. The present study is longitudinal and has two aims. First, it examines the existence of longitudinal associations between four EBRB in Norwegian adolescents (in order to improve the understanding of obesogenic behavioural patterns). Second, the aim is to examine whether clusters of EBRB are cross-sectionally associated with BMI.
Methods
Study sample
The present study is part of the ‘Fruits and Vegetables Make the Marks’ (FVMM) project. FVMM is an intervention project including thirty-eight out of forty-eight randomly selected elementary schools in two Norwegian counties(Reference Bere, Veierod and Skare16). The study sample of the present study consists of sixth and seventh graders from the twenty control schools. All schools were public schools, as are most schools in Norway. Prior to the study, informed consent was obtained from the children and their parents. Ethical approval and research clearance were obtained from the National Committees for Research Ethics in Norway and from the Norwegian Social Science Data Services. Out of 1065 eligible adolescents, 884 completed the baseline questionnaire. The average age of the sample at baseline (September 2001) was 11·8 years: 11·3 for the sixth graders and 12·3 for the seventh graders. A total of 809 and 724 adolescents participated in the follow-up surveys in May 2002 and May 2005, respectively. Besides the adolescents, parents also completed a questionnaire. At baseline, a total of 738 parents participated.
Questionnaire
A survey questionnaire was completed by the pupils in the classroom in the presence of a trained project worker. One school lesson (45 min) was used to complete the questionnaire. Habitual fruit and vegetable (FV) intake was measured by four frequency questions: ‘How often do you eat vegetables for dinner?’ ‘How often do you eat other vegetables (e.g. carrot for school lunch)?’ ‘How often do you eat an apple, orange, pear or banana?’ ‘How often do you eat other fruits or berries?’ All four questions had ten response alternatives, ranging from never (0) to several times every day (10), which resulted in a score ranging from 0 to 40. A test–retest correlation of this scale in a sample of 114 sixth graders was 0·75. A validation study among eighty-six sixth grade pupils showed a correlation of 0·32 between this scale and a 7d food diary, which is similar to results found in other studies of the same age group(Reference Andersen, Bere and Kolbjbrnsen17).
A sum score of snacking and soda (SS) consumption was created from the following three items: ‘How often do you drink soda (including sugar)?’ ‘How often do you eat candy (e.g. chocolate, mixed candy)?’ ‘How often do you eat potato chips?’ The same response alternatives were used as applied for habitual fruit and vegetable intake, giving the SS consumption a scale range from 0 to 30. The reliability coefficient of the SS consumption scale in a sample of 114 sixth grade pupils was 0·81.
Habitual FV intake and SS consumption were split into quartiles. For FV, the lowest quartile served as a risk category, whereas the highest three quartiles were used as the category of reference. For SS, the lowest three quartiles served as the reference category. Gender-specific quartiles were created for both FV and SS because for each measurement significant differences in the distribution of those two EBRB between boys and girls were found.
Sedentary behaviour (watching television (TV)) was measured by the question: ‘Outside school time, how many hours a day do you watch TV or sit behind the computer?’. The cut-off point for TV was set at 2 h/d, in concordance with the recommendations of the American Academy of Pediatrics(18). Less than 2 h/d served as the reference category.
PA was measured by the question: ‘Outside school time: how many times a week do you have exercise that makes you sweat and/or out of breath?’. The cut-off point for PA was set at three times a week. More than three times a week served as the category of reference. The rationale for this is that the question refers to activities outside school hours and thereby excludes exercise during school time.
BMI was calculated by self-reported height and weight at follow-up 3. Parental education level (Low: no college or university education, High: having attended college or university) was also included in the analysis, which was measured in the parental questionnaire at baseline.
Statistical analyses
Gender differences in the distribution of the EBRB were statistically tested with χ 2 tests. Attrition bias was investigated with logistic regression analysis to compare baseline characteristics of participants at follow-up 3 with the dropouts at that time point. Both analyses were performed in the Statistical Package for Social Sciences statistical software package version 15·0 (SPSS Inc., Chicago, IL, USA).
To investigate the associations between EBRB, longitudinal multi-level mixed model logistic regression analyses were performed(Reference Twisk19), for which the EBRB were dichotomized into high-risk v. low-risk behaviour. The dichotomized EBRB served both as dependent as well as independent variables. In a mixed model analysis, all repeated measurements are analysed simultaneously, taking into account the dependency of the observations within one individual. The resulting OR can be interpreted as a sort of average OR over time. For each individual, the EBRB were measured three times. In the longitudinal analyses, cases with missing data at one or more time points were included. All models were adjusted for school and time. Interactions with time were analysed for each association to evaluate whether the association remained stable over time. For the interactions, a P value <0·10 was used.
To investigate the cross-sectional relationship between the EBRB and BMI, clusters were created by applying K-means cluster analysis and a linear regression was performed. As BMI is measured at the third follow-up only, EBRB of the third follow-up are included in the present analysis. The independent variables were now not dichotomized but inserted as the original continuous or categorical variable.
In all analyses, gender and parental education were considered as possible effect modifiers (P = <0·10) and confounders. All multi-level analyses were performed with MLwiN, version 1·1(Reference Rasbash, Browne and Healy20) and the P value was set at 0·05. Three levels were recognized: repeated measures, individuals and schools.
Results
Table 1 shows characteristics of the participating adolescents. For sedentary behaviour, there were significant gender differences in the two surveys (P = <0·01 and P = <0·05). There was a significant difference in prevalence of overweight and obesity between boys and girls, respectively, 17·4 % and 7·2 % (P = <0·001) based on cut-off points of the International Obesity Task Force (IOTF; 23·29 and 23·92 for 15-year-old boys and girls, 23·90 and 24·37 for 16-year-old boys and girls)(Reference Cole, Bellizzi and Flegal21).
Table 1 Characteristics of participating Norwegian adolescents in the FVMM cohort from September 2001 to May 2005

FVMM, Fruits and Vegetables Make the Marks; FV, fruit and vegetables; SS, snacking and soda; TV, television; IOTF, International Obesity Task Force.
*P ≤ 0·01, χ 2 test.
**P ≤ 0·05, χ 2 test.
***P ≤ 0·001, χ 2 test.
****Based on IOTF criteria.
Dropout analysis shows that there were significantly more adolescents with high-risk behaviours at baseline for FV (OR 1·57, 95 % CI 1·08, 2·29), SS (OR 1·49, 95 % CI 1·01, 2·18) and PA (OR 2·56, 95 % CI 1·74, 3·76) who did not participate at the last follow-up.
Table 2 presents the results of the longitudinal multi-level logistic regression to investigate the associations between EBRB. In general, for both boys and girls associations of high-risk EBRB exist, except for TV and PA, and for SS and PA. For example, boys with low FV intake (low FV) show a 1·75 odds for performing high-risk behaviour for SS consumption (high SS). Time interaction was not significant for any of the four associations.
Table 2 Longitudinal association of risk categories of Norwegian adolescents in the FVMM cohort, from September 2002 to May 2005

FVMM, Fruits and Vegetables Make the Marks; FV, fruit and vegetables; SS, snacking and soda consumption; TV, television; PA, physical activity.
*Significant P ≤ 0·05.
K-means cluster analysis results in four clusters (Table 3). A healthy cluster (n 88) consists of a high FV intake, low SS consumption, the lowest time spent on sedentary behaviour and the highest amount of PA. The ‘quite healthy’ cluster consists of a medium FV consumption, low SS consumption, medium sedentary behaviour and a relatively high amount of PA. The ‘quite unhealthy’ cluster consists of low consumption of FV, SS, high sedentary behaviour and a medium amount of PA. An ‘unhealthy’ cluster is defined by a low intake of FV, high SS consumption, high sedentary behaviour and a low amount of PA.
Table 3 Clusters of energy balance-related behaviours of Norwegian adolescents in the FVMM cohort, from September 2002 to May 2005

FV, fruit and vegetables; SS, snacking and soda; TV, television; PA, physical activity.
Table 4 shows the results of the cross-sectional linear regression analyses to investigate the relationship between clusters of EBRB and BMI. The ‘unhealthy cluster’ is significantly negatively related to BMI (β −1·27, P = 0·048). None of the other clusters is significantly associated with BMI.
Table 4 Association between clusters and BMI in the FVMM cohort among Norwegian adolescents
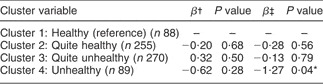
FVMM, Fruits and Vegetables Make the Marks.
*Significant P ≤ 0·05.
†Crude analysis.
‡Adjusted for gender and parental education level.
Discussion
The present study was carried out to investigate whether longitudinal associations exist among four EBRB in Norwegian adolescents. Second, cross-sectional analyses were performed to investigate how clusters of health-related behaviours were associated with BMI of these adolescents. The present study showed that most of the risk behaviours are longitudinally associated. The presence of associated EBRB confirms the statement that health behaviours tend to co-occur, the rationale of MHBR(Reference Prochaska, Spring and Nigg1). Furthermore, one cluster was found to be cross-sectionally associated with BMI, in an unexpected direction.
Similar results in associations of EBRB were shown in the cross-sectional study of Lowry et al.(Reference Lowry, Wechsler and Galuska3) who found that sedentary behaviour was associated with eating insufficient FV among high-school students in the USA. Utter et al.(Reference Utter, Scragg and Schaaf5) found an association between high level of TV viewing and high SS intake in a cross-sectional study among New Zealand children and young adolescents. A national sample of Iranian adolescents showed that youth, being in the lowest tertile of PA, had significantly lower FV intake(Reference Kelishadi, Ardalan and Gheiratmand22). Two reviews also found no association between sedentariness and low PA(Reference Van der Horst, Chin A Paw and Twisk7, Reference Biddle, Gorely and Marshall23). Besides the fact that the association between EBRB exists, the results of the present study also show that this association remains stable over time. This indicates the seemingly great importance of starting interventions aimed at influencing these health behaviours at an early phase in life, before unhealthy behaviours start becoming habitual. Second, it suggests the importance of targeting multiple health behaviours at the same time to possibly gain more health benefits from interventions aimed at reducing health risk behaviours. Most of the interventions that were included in the two reviews that are effective in skin-folds and/or BMI reduction have a dietary as well as a PA focus(Reference Doak, Visscher and renders24, Reference Summerbell, Waters and Edmunds25).
Adolescents in the unhealthy cluster (Table 4) show a significantly lower BMI than adolescents in the healthy cluster. However, owing to the lack of a baseline measurement of height and weight, there is no possibility interpreting this as a causal association. The HBSC cohort similarly found an inverse relation between adolescents with high sweets intake and being overweight(Reference Janssen, Katzmarayk and Boyce10). Several explanations for the lower BMI in adolescents with unhealthy patterns can be mentioned. One could be restrictions in SS consumption of the overweight/obese adolescents to control their weight. Another possibility is that under-reporting of snacks and sweets intake by adolescents with a higher BMI might have occurred, because overweight and obese adolescents tend to under-report their dietary intake more often than adolescents with normal weight do(Reference Garaulet, Martinez and Victoria26, Reference Bandini, Schoeller and Cyr27). Furthermore, the questions assessing SS consumption do not measure portion size. Since BMI is used as an indicator for a healthy or unhealthy weight, it could also be that adolescents in the healthy cluster have a higher muscle mass(Reference Stevens, McClain and Truesdale28).
There are several other limitations of the present study that have to be mentioned. First of all, weight and height are self-reported. As many studies show that self-reported height and weight in adolescents lead to under-classification of overweight and obesity, there is a chance that this has occurred in the present study as well(Reference Sherry, Jefferds and Grummer-Strawn29–Reference Rasmussen, Eriksson and Nordquist32). Second, a significant difference between boys and girls in the prevalence of overweight and obesity was found (17·4 % boys, 7·2 % girls, P = <0·001). Objective measurements in Norway show a lower prevalence rate for boys (14·6 %) and a considerably higher rate for girls (17·7 %)(Reference Juliusson, Roelants and Eide33). Since this prevalence rate is a mean percentage of 4–15-year-old children and adolescents, a better comparison could possibly be made with data from the HBSC study. They found a prevalence of overweight and obesity of 14·6 % and 9·5 % for 15–year-old Norwegian boys and girls, respectively(Reference Mulvihill, Németh and Vereecken34). It could either mean that the girls with overweight or obesity who participated in the third follow-up are an underestimation of the actual overweight and obesity prevalence or that the prevalence is low due to loss to follow-up. Third, the question concerning PA does not measure the duration of the activity, which can cause bias in measurement. Furthermore, the questions do not separately address behaviours during weekdays and weekends, while the literature shows that there are differences in weekday and weekend patterns of sedentary behaviour and PA(Reference Hardy, Bass and Booth35–Reference Armstrong, Balding and Gentle37).There are no significant differences found either in the level of PA between boys and girls or between the three-time measurements. A study among Swedish 15- and 16-year-olds shows comparable activity patterns between genders(Reference Ekelund, Sjöström and Yngve38). In contrast, there are other studies showing differences in activity patterns, with boys being more active than girls, and a decrease in PA over time(Reference Van Mechelen, Twisk and Berthekepost39–Reference Myers, Strikmiller and Webber41). Fourth, dropout analysis shows that an attrition bias had occurred during the last follow-up. This negatively affects the results because it seems that pupils participating at the last measurements are, on average, performing more healthy behaviour than pupils participating at baseline. Owing to lesser variation in behaviours, it might have become more difficult to show an association with BMI.
Despite the limitations mentioned, a strength of the present study is that the EBRB are longitudinally associated, while most previous research that investigated associations of these behaviours was performed cross-sectionally. Furthermore, multi-level analyses were performed, which takes the dependency of repeated measures of the adolescents and going to the same school into account.
Conclusion
Longitudinal associations of EBRB show that it is important to start at an early phase in life to prevent unhealthy behaviours becoming habitual. Besides this, it underlines the importance of targeting multiple behaviours at the same time to possibly obtain more health benefits than when these behaviours are targeted separately. An association between clusters of these EBRB and BMI was only found for SS consumption, in an unexpected direction. More research is needed to investigate associations between health behaviours and body weight among adolescents, preferably using longitudinal and more objective data measuring body weight.
Acknowledgement
Sources of funding: The present study was supported by the Norwegian research Council, and has been facilitated by the EU-funded HOPE project: ‘Health-promotion through Obesity Prevention across Europe (the Commission of the European Communities, SP5A-CT-2006-044128). Conflicts of interest declaration: The study does not necessarily reflect the Commission’s views and in no way anticipates the Commission’s future policy in this area. The authors have no conflict of interest. Authorship responsibilities: K.I.K. and E.B. designed the study and collected the data. M.E.S., N.L., I.H.M.S. and M.W. formed the research questions. M.E.S. conducted the analyses and drafted the manuscript. J.W.R.T. provided statistical advice. All authors read and commented on the drafts and have approved the final version.


