


A common variant, rs9939609, of the fat mass and obesity-associated (FTO) gene has consistently shown a strong association with obesity(Reference Frayling, Timpson and Weedon1–Reference Dina, Meyre and Gallina3). We have earlier confirmed the association between the FTO variant and BMI in the Finnish Diabetes Prevention Study (DPS)(Reference Lappalainen, Tolppanen and Kolehmainen4). Furthermore, we have reported that there was no association between rs9939609 and the magnitude of weight reduction achieved by a long-term lifestyle intervention in the DPS(Reference Lappalainen, Tolppanen and Kolehmainen4). However, the extent to which lifestyle factors may modify this genetic risk is still quite unclear. Some studies have suggested that the ‘obesogenic’ effects of FTO may be accentuated by a high-fat and low-carbohydrate diet(Reference Sonestedt, Roos and Gullberg5) or lower physical activity(Reference Andreasen, Stender-Petersen and Mogensen6), or blunted by higher physical activity(Reference Rampersaud, Mitchell and Pollin7). These findings are suggestive for a role of lifestyle in modifying the association between FTO and obesity.
The discovery of FTO as an obesity-susceptibility gene has launched a series of studies to unravel the physiological mechanisms through which the risk alleles confer obesity. Major effects of FTO appear to be focused on energy intake instead of energy expenditure(Reference Wardle, Llewellyn and Sanderson8–Reference Berentzen, Kring and Holst11). Children and adults carrying the FTO risk allele have been reported to have higher energy intake(Reference Wardle, Llewellyn and Sanderson8–Reference Haupt, Thamer and Staiger10, Reference Timpson, Emmett and Frayling12, Reference Wardle, Carnell and Haworth13). Intake of all macronutrients has been shown to be greater in carriers of the risk allele but especially so for fat intake(Reference Cecil, Tavendale and Watt9). The abundant hypothalamic expression of FTO also supports a potential role in the control of satiety or appetite(Reference Willer, Speliotes and Loos14–Reference Stratigopoulos, Padilla and LeDuc16).
Long-term studies using high-quality, well-documented dietary data are warranted to further define how and to what degree the genetic risk by FTO is modified by dietary factors. Understanding the interactions between genetic variations and dietary intake would provide a basis for determining the role of dietary habits in the prevalence and pathogenesis of obesity.
Methods
The Finnish Diabetes Prevention Study
The Finnish DPS was a multicentre study carried out in 1993–2000 in five participating centres in Finland, located in Helsinki, Kuopio, Oulu, Tampere and Turku(Reference Eriksson, Lindstrom and Valle17–Reference Lindström, Louheranta and Mannelin19). The main aim of the DPS was to assess the efficacy of an intensive diet and exercise programme to prevent or delay the onset of type 2 diabetes among high-risk individuals with impaired glucose tolerance. The main inclusion criteria were BMI over 25 kg/m2 and age from 40 to 64 years. Impaired glucose tolerance was defined according to the WHO criteria (1985)(Reference WHO Study Group20). A total of 522 subjects were randomly assigned to an intensive diet and exercise counselling (n 265) or to a control (n 257) group. The main goals of the intervention group were weight reduction ≥ 5 %, moderate intensity physical activity ≥ 30 min/d, dietary fat < 30 % of total energy (E %), saturated fat < 10 E % and fibre ≥ 15 g/4184 kJ (1000 kcal). Baseline characteristics by randomisation group are presented in Table 1. After a mean follow-up of 3·2 years, the risk of diabetes had reduced by 58 % in the intervention group compared with the control group, and the intervention phase was terminated after a mean duration of 3·9 (range 0–6) years(Reference Tuomilehto, Lindstrm and Eriksson18, Reference Lindström, Ilanne-Parikka and Peltonen21). In the present study, however, the intervention and control groups were analysed together and analyses were adjusted for the intervention. Biochemical and anthropometric measurements were performed at baseline and at the annual visits. The study protocol was approved by the Ethics Committee of the National Public Health Institute in Helsinki. All participants volunteered for the study and gave their written informed consent.
Table 1 Baseline characteristics of the intervention and control groups in the Finnish Diabetes Prevention Study (original n 522, in the present study n 479) (Mean values and standard deviations)

* General linear model univariate.
Assessment of dietary intake
The study participants completed a 3 d food record at baseline and before each annual study visit(Reference Lindström, Louheranta and Mannelin19, Reference Lindström, Peltonen and Eriksson22). They were asked to write down everything they ate and drank using a picture booklet of portion sizes of typical foods as the reference. The completeness of the food records was checked at a session with the study nutritionist during the study visit. The average annual nutrient intakes were calculated with a dietary analysis program developed at the National Public Health Institute(Reference Ovaskainen, Valsta and Lauronen23). In the present study, the average intakes at baseline and during the years 1, 2 and 3 were used in the statistical analyses.
Genotyping
The original number of the study subjects in the DPS is 522 but all of them did not give permission for the genetic analyses, and thus the FTO variant rs9939609 was genotyped only from the available 479 DNA samples (160 men and 319 women). The marker did not deviate from Hardy–Weinberg equilibrium expectation (P =0·71). The custom Golden Gate genotyping reagents and consumables were ordered from Illumina, Inc. A representative sample (thirty-two replicates) was repeated to confirm the genotype and the success rate was 100 %.
Statistical analyses
Statistical analyses were performed using SPSS statistical software for Windows (version 14.0; SPSS, Inc.). Results are presented as means and standard deviations. Normality of variable distributions were tested using the Kolmogorov–Smirnov test with Lilliefors correction. Logarithmic transformations were used to transform variables to normal distribution when appropriate. Homogeneity of variances was tested using Levene's test. Genetic associations with continuous variables were analysed with general linear model univariate ANOVA at baseline and with linear mixed models during the 3 years of follow-up. Selected co-variables (sex, age, group and total energy intake) were included in the models as covariates. Normality was assessed by plotting the residuals. In the mixed models, subject identifiers were included as a grouping random effect. In the follow-up data analysis, the intervention and control groups were analysed together. After the interactions between the FTO genotype and a dietary factor were modelled, more specific analyses were performed according to the tertiles of dietary intake. Furthermore, a follow-up analysis was performed for the whole study population using BMI as the dependent variable and including all the dietary factors, sex, age, group and FTO SNP rs9939609 in the same mixed model.
To assess the statistical power of the study, power calculations were performed. Given the number of samples (n 479), minor allele frequency of 42·4 %, additive inheritance model, α significance level of 0·05, estimated genetic effect of 0·1 BMI units, and estimated environmental effect of 0·05 BMI units, we had >80 % power to detect gene–environment effects greater than 0·8 BMI per one unit change in the interaction strength. Power calculations were performed using QUANTO 1.2.4 (http://hydra.usc.edu/gxe/).
Results
Baseline analyses
Associations between the FTO genotype and nutrient intakes at baseline are summarised in Table 2. FTO SNP rs9939609 was not associated with the mean values of total energy intake, or intakes of macronutrients or fibre. An additional adjustment for BMI did not change the results (data not shown). At baseline, those with the AA genotype had higher BMI than subjects with other genotypes (Table 2).
Table 2 Sex, BMI and nutrient intakes in the Finnish Diabetes Prevention Study according to the genotypes of rs9939609 of the fat mass and obesity-associated (FTO) gene (Mean values and standard deviations)

E%, percentage of energy.
* ANOVA adjusted for age and sex.
† ANOVA adjusted for age, sex and total energy intake.
‡ χ2 test.
At baseline, higher BMI by the FTO risk genotype was detected especially in those who reported a diet high in saturated fat, with mean BMI of 30·4 (sd 3·6), 31·9 (sd 4·2) and 33·6 (sd 5·3) kg/m2 for TT, TA and AA carriers, respectively (P =0·004, unadjusted; Table 3). The observed increase in BMI across the FTO genotypes was also restricted to those who reported a diet high in total fat (Fig. 1). Furthermore, higher BMI was observed in those who had a diet low in carbohydrates (P =0·028) and fibre (P =0·015; Table 3). However, in the analyses adjusted for total energy intake, age and sex, significant interactions between FTO and dietary intakes were not found. A trend for interaction (P =0·097) was detected only for carbohydrates (Table 3). Total energy intake seemed to modify the association between the FTO genotype and BMI to a lower degree (Table 3).
Table 3 BMI by tertiles of dietary intake and fat mass and obesity-associated (FTO) genotype rs9939609 in the Finnish Diabetes Prevention Study at baseline (Mean values and standard deviations)

E%, percentage of energy; CHO, carbohydrates.
* Differences in BMI of an additive genetic model by general linear model.
† Differences in BMI of an additive genetic model by general linear model adjusted for sex, age and total energy intake.
‡ Interaction: genotype × dietary factor (as a continuous variable) when adjusted for sex, age and total energy intake.
§ TT v. TA/AA, P < 0·05.
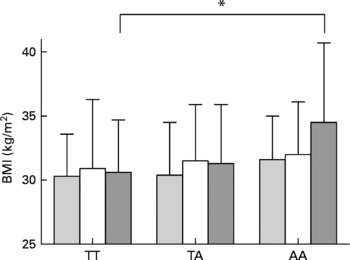
Fig. 1 BMI by dietary fat intake tertiles (low (![]() ), medium (□) and high (
), medium (□) and high (![]() )) and by fat mass and obesity-associated (FTO) genotype rs9939609 at baseline. *P < 0·05.
)) and by fat mass and obesity-associated (FTO) genotype rs9939609 at baseline. *P < 0·05.
Follow-up analyses
When the dietary intakes divided into tertiles were examined in relation to the FTO genotype and BMI, we observed that during the 3-year follow-up, individuals with the AA genotype did not differ from the other genotypes when they followed a diet low in energy (Fig. 2). However, the test for interaction between FTO and total energy intake was not significant (P =0·086) after adjustment for sex, age and group. The additional adjustments for physical activity, smoking or recruitment centre did not change the results considerably (data not shown). The interactions between FTO and other dietary factors did not reach statistical significance either, but it appeared that the diets low in fat, high in carbohydrates or high in fibre were advantageous in relation to BMI for the risk allele carriers (Fig. 2).
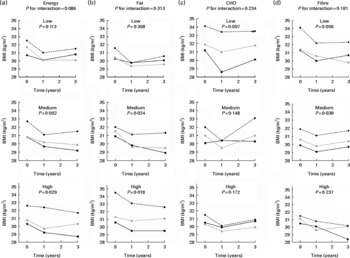
Fig. 2 BMI by (a) energy, (b) fat, (c) carbohydrate (CHO) and (d) fibre intake tertiles (low, medium and high) and by fat mass and obesity-associated (FTO) genotype rs9939609 during the 3-year follow-up. Analyses are adjusted for total energy intake (for (b)–(d)), sex, age and group. The P value for interaction between the FTO genotype and a dietary factor on BMI was first modelled. Then data were divided into tertiles according to dietary intake and comparisons between the genotype groups were analysed within the tertile groups. ![]() , TT;
, TT; ![]() , TA;
, TA; ![]() , AA.
, AA.
In the linear mixed model including all the dietary factors, sex, age, group and FTO SNP rs9939609 predicting the BMI during the 3-year follow-up, FTO SNP (P < 0·001), sex (P < 0·001), age (P < 0·001), SFA intake (P < 0·001) and protein intake (P =0·020) remained significant predictors while adjusting for all the other variables.
The stratified analyses according to randomisation group were also performed, but there were no significant interactions between FTO and dietary factor (data not shown).
Discussion
Understanding the interactions between dietary intake and genetic variation provides a basis for determining the role of dietary habits in the prevalence and pathogenesis of obesity. In the present study, we suggested that at baseline and during the follow-up, the association between FTO and BMI was more pronounced in those having a diet high in fat and low in carbohydrates and fibre. Although the FTO × diet interactions did not reach conventional statistical significance (P < 0·05) in the present study, we would like to highlight the importance of detected trends. One could argue the relevance of the present findings because of the absence of interaction, i.e. it appears that also non-risk allele carriers of FTO rs9939609 benefited in relation to BMI from a diet low in energy and fat, but high in carbohydrate and fibre (Fig. 2). However, the present findings emphasise the importance of the same diet for the risk allele carriers of FTO, as well. In the whole study population, the mean values for the lowest tertiles of fat intake were 29·6, 26·5 and 26·1 E %, and for saturated fat 12·3, 10·2 and 9·8 E % at baseline, at the first and third year, respectively. Corresponding values for the highest tertiles of daily fibre intake were 28, 28·5 and 28·5 g. The mean values of the lowest tertiles of reported carbohydrate intake were 35·7, 37·6 and 38·3 E %. Thus, we consider that the present results highlight the validity of the current dietary recommendations especially for those people with known genetic risk of obesity: reducing the intake of total and saturated fat and increasing the relative intake of carbohydrates rich in fibre. Typically, reduction in energy intake can also be achieved by following these guidelines(Reference Poppitt24). Previously, Lindström et al. (Reference Lindström, Peltonen and Eriksson22) have likewise shown that a long-term weight loss and concomitant type 2 diabetes risk reduction was best achieved by increasing fibre intake and decreasing the intake of dietary fat in the Finnish DPS.
The present findings are in accordance with two recent reports(Reference Sonestedt, Roos and Gullberg5, Reference Moleres, Ochoa and Rendo-Urteaga25). A study by Sonestedt et al. (Reference Sonestedt, Roos and Gullberg5) was based on an analysis of cross-sectional data, and they showed similarly that an increase in BMI across FTO genotypes was restricted to those who reported a high-fat diet. In addition, they observed higher BMI for AA carriers of FTO rs9939609 among individuals with a low carbohydrate intake. However, they did not observe an interaction between fibre intake and the FTO genotype on BMI. Moleres et al. (Reference Moleres, Ochoa and Rendo-Urteaga25) have shown in children that risk allele carriers consuming saturated fat more than 12·6 E % had an increased obesity risk compared with other genotype carriers. Furthermore, Razquin et al. (Reference Razquin, Martinez and Martinez-Gonzalez26) have demonstrated that a Mediterranean-based diet, rich in mono- and polyunsaturated fat, provides FTO risk allele carriers some protection against body-weight gain after 3 years of nutritional intervention. Very recently, Ahmad et al. (Reference Ahmad, Lee and Paré27) noted larger effects of the FTO risk allele on BMI in women who were less active or had higher energy intake. These and the present results support the hypothesis that the BMI-increasing effect of FTO is higher in a population with a Western lifestyle characterised by an energy-dense diet and a sedentary lifestyle, but the mechanisms behind this still remain to be explained. In general, these observations highlight the multi-factorial nature of obesity, each individual genetic variant has probably only a modest effect, and the interaction of genetic variants with environmental factors can potentially be quite important in determining the observed phenotype.
In the previous studies, the abundant FTO expression in the brain areas governing energy balance has supported a central neuronal role for FTO (Reference Willer, Speliotes and Loos14, Reference Stratigopoulos, Padilla and LeDuc16, Reference Fredriksson, Hägglund and Olszewski28). Studies in human subjects have underpinned this hypothesis, since the FTO locus has been shown to confer a risk of obesity through increased energy intake and reduced satiety, although several negative findings have been reported in this regard as well. Previous studies on the association between FTO polymorphism and dietary intake and eating behaviour are summarised in Table 4. In the present study, FTO SNP rs9939609 was not associated with the mean values of total energy intake, macronutrients or fibre at baseline. Most of the previous studies reporting an effect of FTO on elevated dietary intake were conducted in children(Reference Wardle, Llewellyn and Sanderson8, Reference Cecil, Tavendale and Watt9, Reference Timpson, Emmett and Frayling12), which may explain the discrepancy. However, by which exact mechanism FTO could particularly influence children's eating behaviour still needs further investigation.
Table 4 Studies on the association between fat mass and obesity-associated (FTO) polymorphism and dietary intake and eating behaviour

In the present study, the obvious limitation is a small sample size in terms of interaction analyses, although power calculations indicated the statistical power to be relatively good and this is explained most probably by the high minor allele frequency of FTO rs9939609. However, we acknowledge the need for larger studies to determine the exact nature of the interaction. Furthermore, we would like to emphasise that the strength of the DPS population is that it is carefully selected and clinically well characterised. Furthermore, the habitual nutrient intakes of the study participants were annually estimated using 3 d food records, which is a reliable and high-quality method in analysing dietary intakes. It is also worth noting that the present study enables the investigation of long-term gene × environment interactions, and this kind of data is seldom available.
The variables used to control for in the statistical analyses were age, sex group, total energy intake and randomisation group. The additional adjustments for physical activity, smoking or recruitment centre did not change the results considerably (data not shown). Furthermore, the stratified analyses according to randomisation group were performed, but there were no significant interactions between FTO and dietary factors (data not shown).
Taken together, the present study strengthens the view that diet plays a role in the association between the genetic variants of FTO and obesity. Thus, current dietary recommendations are particularly beneficial for those who are genetically susceptible for obesity.
Acknowledgements
This study was supported by grants from the Sigrid Juselius Foundation, the Academy of Finland (no. 118590), the EVO funding of the Kuopio University Hospital from Ministry of Health and Social Affairs (no. 5254), the Finnish Funding Agency for Technology and Innovation (40058/07) and the Nordic Centre of Excellence on ‘Systems biology in controlled dietary interventions and cohort studies’, SYSDIET (no. 070014). T. L., J. L., J. T., J. P., L. K., J. G. E. and M. U. designed the study; M. U. and J. T. conducted the research; T. L. analysed the data, performed the statistical analyses and wrote the manuscript; T. L. had primary responsibility for the final content. All authors critically reviewed the manuscript, and read and approved the final manuscript. None of the authors reported a conflict of interest.


