


FFQs are the most commonly used dietary assessment tools in large epidemiological studies. Measurement error is an inherent limitation of all self-reporting dietary assessment methods affecting many nutrients, but is particularly well documented for the under-reporting of energy and protein intakes with FFQs( Reference Prentice, Mossavar-Rahmani and Huang 1 – Reference Freedman, Commins and Moler 3 ). However, statistical methods continue to evolve to partially adjust for some systematic errors associated with self-report to improve risk estimates in aetiological studies( Reference Tinker, Sarto and Howard 4 – Reference Prentice, Shaw and Bingham 6 ). Hence, comprehensive FFQs continue to be used in nutritional epidemiology since they are designed to capture long-term dietary intake( Reference Satija, Yu and Willett 7 ), are particularly useful for episodically consumed foods( Reference Kipnis, Midthune and Buckman 8 ) and may be used in conjunction with data from more detailed instruments, such as dietary records and 24 h recalls( Reference Carroll, Midthune and Subar 9 ).
Ideally, FFQs should be designed and tested for reliability and validity in populations in which they are to be used( Reference Cade, Thompson and Burley 10 ). Such complex undertakings, however, are labour-intensive and not always feasible in settings where expertise and resources are limited. Owing to the enormity of the work involved in developing these questionnaires de novo, tailoring existing questionnaires for new populations is a reasonable option for leveraging existing resources and efficiently developing population-specific FFQs that better reflect target population dietary habits.
Food consumption patterns between the USA and Canada are assumed to be comparable owing to similarities in lifestyle patterns, food marketing and food availability. Nevertheless, there are some important differences in food availability between the USA and Canada as well as differences in fortification regulations that may make it problematic to use US dietary assessment tools in Canada without modification( Reference Barr, Kwan and Janelle 11 – Reference Anderson, Cotterchio and Boucher 13 ). Accordingly, we previously modified the US National Cancer Institute’s FFQ, the Diet History Questionnaire I (DHQ I), to reflect Canadian-specific food and nutrient values( Reference Csizmadi, Kahle and Ullman 12 ). The resulting Canadian DHQ, hereafter referred to as the C-DHQ I, comprised 134 food and eleven supplement questions, and was used to assess nutrient intakes among participants in the Alberta Tomorrow Project( Reference Bryant, Robson and Ullman 14 ), a Canadian cohort of adult men and women. A comparison of the intakes reported on the C-DHQ I using the original US and the Canadian modified nutrient databases revealed statistically significant differences in the mean estimates for several nutrients (folate, vitamins A, D (women only), B6, iron)( Reference Csizmadi, Kahle and Ullman 12 ). Hence, even in populations with relatively similar dietary habits, targeted modifications to the FFQ food list and nutrient database are warranted to optimize population-specific intakes.
Detailed knowledge of foods and beverages consumed in a population of interest is essential for the optimal design of an FFQ to ensure that it has the potential to capture intake that is representative of the target population( Reference Cade, Thompson and Burley 10 , Reference Block, Hartman and Dresser 15 ). Since recent population-based Canadian dietary survey data were not available to inform the C-DHQ I food list modifications, we relied on expert opinion to increase the face validity of the questionnaire. At a later date, the availability of dietary intake data from the Canadian Community Health Survey – Cycle 2.2 Nutrition (2004)( 16 ), hereafter referred to as CCHS, prompted us to examine Canadian food consumption patterns for the purpose of evaluating the C-DHQ I food list. In addition, the release of the updated US DHQ II in 2009( 17 ) based on US survey data motivated our work to concurrently create an updated C-DHQ II based on the US version and the CCHS data. Here we first describe methods used to examine the extent to which the original C-DHQ I captured nutrient intakes in Canada and then describe the steps involved in modifying the US DHQ II and companion nutrient database using CCHS dietary data for the purpose of creating a Canadian-specific C-DHQ II. An overview of the steps is presented in Fig. 1.
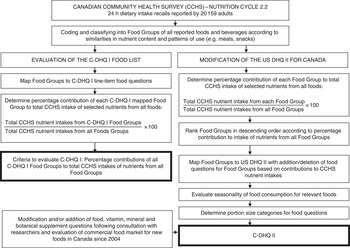
Fig. 1 Overview of steps in the evaluation of the Canadian Diet History Questionnaire I (C-DHQ I) food list and the modification of the US Diet History Questionnaire II (US DHQ II) for Canada to produce the Canadian Diet History Questionnaire II (C-DHQ II)
Methods
The CCHS – Cycle 2.2 Nutrition (2004)
CCHS participants were recruited from households in the ten provinces of Canada with the exclusion of members of the Canadian Forces, residents of the three Territories, Aboriginal Reserves and certain remote areas and institutions. Detailed descriptions of the survey design, sample and interview methods have been published( 18 ). Briefly, face-to-face interviews were conducted to collect detailed 24 h dietary intake data using an adapted version of the Automated Multiple Pass Method for 24 h recalls developed by the US Department of Agriculture( Reference Moshfegh, Rhodes and Baer 19 ). Between January and December 2004 at least one recall was completed by 20 159 adults aged 19 years and older. Second recalls, completed by telephone by roughly half of the participants, were not used in the current analysis. The survey had an overall response rate of 76 % and was designed to ensure adequate representation of age and sex groups across Canada.
Comparison of foods and nutrients in CCHS and the C-DHQ I food list
CCHS food intake data were analysed using methods previously described by Subar et al. ( Reference Subar, Krebs-Smith and Cook 20 , Reference Subar, Midthune and Kulldorff 21 ) as a means of evaluating the ability of the C-DHQ I to capture Canadian food consumption. Individual foods and recipes reported in the 24 h recalls were coded and organized into Food Groups that were mapped to questions on the C-DHQ I, using the details provided in food descriptions, cooking methods and nutrient composition. For example, the question regarding ‘macaroni and cheese’ corresponded to a Food Group that was comprised of ten variations of macaroni and cheese reported by CCHS participants. Each Food Group included foods with similar nutrient profiles and patterns of consumption (e.g. generally consumed as a snack, main meal, side dish, etc.). New Food Groups were created for foods that did not seem to fit within existing line-item questions on the C-DHQ I. The assignment of foods to existing or new Food Groups continued until all foods reported in CCHS were accounted for.
The next step was to determine the percentage contribution of each mapped C-DHQ I Food Group to the total intake of seventeen nutrients, selected to represent a broad range of nutrients of interest in chronic disease prevention (energy, protein, carbohydrate, fat, alcohol, fibre, vitamin A, vitamin D, vitamin C, vitamin B6, vitamin B12, folate, riboflavin, thiamin, niacin, calcium and iron). This percentage was derived by first summing the amount of nutrient consumed by each participant from all foods within each Food Group. The total nutrient intake from each Food Group per participant was then weighted by person-specific sampling weights that accounted for the complex survey sampling methods used in CCHS. The total weighted nutrient intakes from all adult participants were then summed for each Food Group. This amount is the numerator in equation (1) below. The total nutrient intake from all Food Groups in CCHS was calculated for each participant, weighted by the person-specific sampling weight and then summed for all participants. This amount is the denominator in equation (1) below. The weighted percentage contribution of each Food Group to the total population intake of each nutrient listed above is given by the equation:
 $$\left[ {{{\mathop{\sum}{\left( {F_{i} w_{i} } \right)} } \mathord{\left/ {\vphantom {{\mathop{\sum}{\left( {F_{i} w_{i} } \right)} } {\mathop{\sum}{\left( {T_{i} w_{i} } \right)} }}} \right. \kern-\nulldelimiterspace} {\mathop{\sum}{\left( {T_{i} w_{i} } \right)} }}} \right]{\times}100,\quad \quad i{\equals}1,\,\ldots\!\!,\,20\,159$$
where F i is the amount of the nutrient contributed by foods in a particular Food Group for the ith respondent, T i is the total amount of the nutrient from all foods for the ith respondent and w i is the CCHS sample weight for the ith respondent. The nutrient content of all foods reported in CCHS was derived from Health Canada’s Canadian Nutrient File( 22 ) version 2001b.
Based on this approach, the capacity of the C-DHQ I to capture the dietary intakes of the Canadian population was assessed by summing the nutrient intakes from all C-DHQ I Food Groups, one nutrient at a time, and then determining the percentage contribution of this sum to total CCHS nutrient intakes.
Modification of the US DHQ II food list for the C-DHQ II using CCHS
The Food Groups created from CCHS foods described above were also used to determine modifications to be made to the US DHQ II food list for an updated C-DHQ II. Using equation (1) and the methods described in the previous section, percentage contributions of all Food Groups (including newly created groups not queried in questions on the C-DHQ I) were ordered from highest to lowest and summed in descending order until 90 % of total nutrient intake was achieved for each of the seventeen nutrients listed previously. Food Groups contributing to this top 90 % for one or more nutrients were candidate Food Groups to be retained or added to the questionnaire as line-item questions on the C-DHQ II.
In addition, within each Food Group, individual food contributions to Food Group nutrient intakes were also determined using equation (1) and the methods described above; however, in this case, the numerator was comprised of nutrient intakes from a specific food within the Food Group and the denominator comprised nutrient intakes from all foods within the group. The percentage contributions from the individual foods were ordered from highest to lowest within each Food Group and foods at the top of the list for more than one nutrient were considered for specific mention as examples in the line-item questions for the C-DHQ II. Foods that contributed the largest proportion of nutrient intakes for only one nutrient were considered for line-item text inclusion if the food was considered an important source for that nutrient.
Foods and supplements identified for inclusion in the C-DHQ II
Researchers leading large-population epidemiological dietary studies in Canada were consulted to determine the dietary assessment gaps related to emerging hypotheses in diet and chronic disease prevention, including those for dietary supplements. Ad hoc consultations took place in face-to-face meetings and by conference calls. Commercial foods not available on the market at the time of CCHS data collection but which have been identified in recent Canadian food market databases( 23 , 24 ) and of relevance to chronic disease prevention were also considered for C-DHQ II inclusion.
Evaluation of seasonal consumption of C-DHQ II Food Groups
All Food Groups associated with seasonal food consumption were evaluated for the frequency of reported intake during the summer (July, August and September), autumn (October, November and December), winter (January, February and March) and spring (April, May and June). The seasonal proportions of annual intakes were examined to determine if intakes varied by season. Twenty-one Food Groups corresponding to DHQ II line-items were evaluated for seasonal intake in four broad categories: fruits (e.g. strawberries; peaches; melons), vegetables (e.g. corn; tomatoes), beverages (e.g. milkshakes; soft drinks; energy drinks; beer; water) and other foods (e.g. hot breakfast cereals; soups).
Evaluation of portion sizes for each food/Food Group on the C-DHQ II
For each Food Group mapped to a line-item on the C-DHQ II, gram-weight intake distributions weighted to account for survey sampling were determined in CCHS. The 25th and 75th percentiles were used as cut-off points to establish small (less than the 25th percentile), medium (25th to 75th percentiles) and large (greater than the 75th percentile) portion sizes for men and women combined. The gram-weight cut-off points were converted to standard units or household measures of relevance to consumers and used to describe portion sizes on the questionnaire. For example, portions of milk were described as ‘less than 1 cup (8 ounces)’, ‘1 to 1½ cups (8 to 12 ounces)’ and ‘more than 1½ cups (12 ounces)’ which corresponded to small, medium and large portion sizes based on CCHS data. The cut-off points for portion size categories were established to maximize the ability to discriminate between extremes in food intake while minimizing unstable estimates due to small numbers( Reference Subar, Midthune and Kulldorff 21 ).
Development of the nutrient database for the C-DHQ II
For each of the three portion sizes per line-item on the C-DHQ II, mean sex-specific nutrient values were generated using the CCHS database which includes thirty-four nutrients (including water and alcohol; Table 1). Intakes reported in the CCHS 24 h recalls were weighted and stratified by sex. Food group intakes were then stratified into three categories based on the distribution of gram-weight portion sizes: (i) below the 25th percentile (small); (ii) 25th to 75th percentiles (medium); and (iii) above the 75th percentile (large). Mean nutrient intake estimates were calculated for each food group by sex and portion size to provide values for the C-DHQ II nutrient database. In other words, six values for each nutrient were generated per Food Group.
Table 1 Macronutrients, nutrients and food constituents in the Canadian Community Health Survey – Cycle 2.2 Nutrition (2004) nutrient database
Results
CCHS foods captured by the C-DHQ I
CCHS participants reported 4533 individual foods and recipes in the first 24 h dietary recalls, from which 268 Food Groups with similar nutrient content and food pattern usage were created. Of these, 212 were consistent with existing food line-items on the C-DHQ I and comprised 3825 foods and recipes. The remaining 708 foods were not deemed to be candidate foods for existing line-item questions in C-DHQ I (e.g. fish mixed dishes; luncheon meat mixed dishes; sushi; game meat; vegetable mixtures) and were grouped into fifty-six new Food Groups. Estimates of percentages of total nutrient intakes (n 17) captured by Food Groups represented on the C-DHQ I food list are presented in Fig. 2 and range from 79 % for fat to 100 % for alcohol.

Fig. 2 Percentage of the Canadian Community Health Survey – Cycle 2.2 Nutrition (2004) energy, nutrient and food constituent intakes captured by the Canadian Diet History Questionnaire I
Modifications of the US DHQ II for the C-DHQ II
Additions, deletions and modifications to questions for the tailoring of the US DHQ II for use in Canada are outlined in the online supplementary material, Supplemental Table 1. These changes reflect differences in food consumption patterns between Canada and the USA, new foods on the market and the addition of new foods related to emerging diet and chronic disease prevention hypotheses. The final forty-one-page C-DHQ II (as well as the online version) is comprised of 153 food and beverage questions, eleven questions for dietary supplements and one optional open-ended question that asks respondents to report on other foods consumed at least once per month. Similar to the original US DHQ II, many line-item questions embed sub-questions to further characterize the foods and beverages consumed (e.g. types of fats and sauces added to potatoes and the proportion of time these are added). Frequency response categories remained the same as originally listed on the US DHQ II, and ranged from ‘1 time per month or less’ to ‘6 or more times per day’, or from ‘1–6 times per year’ to ‘2 or more times per day’, depending on the line-item (in the past-year version).
Revisions to questions were made based on the examination of CCHS data and consultations with nutrition experts, stakeholders and researchers. In some cases, text was modified in order to clarify the range of foods to be reported. For example, for the question pertaining to ‘breads and rolls’, additional text was added to include ‘flatbreads (such as pita, roti or tortilla)’ to ensure reporting of these foods, since they were among the top five listed foods within the Food Group that contributed to the highest percentage intake of energy, fibre, iron and folate at the Food Group level.
In other cases, sub-group questions were added to better capture variations in the intake of a food. For example, an additional embedded question was added to the question ‘French fries, home fries, hash browned potatoes or tater tots’ to determine the proportion of time they were consumed as ‘poutine’ (a Canadian food that combines French fries, gravy and cheese). Other embedded questions allowed for sub-categories to be distinguished from the overall food group for the purpose of potentially addressing specific hypotheses in diet studies. For example, ‘red wine’ was queried as a separate embedded question for wine and ‘bean, pea or lentil soups’ were queried as embedded questions for soup. Where closely related foods had been identified as candidates for additions as embedded questions, but the format was not feasible owing to differences in portion size consumption, entirely new line-item questions were created (e.g. ‘cauliflower’ queried separately from ‘Brussels sprouts’; ‘strawberries’ queried separately from ‘blueberries, raspberries, saskatoon berries or blackberries’). New foods and/or Food Groups were also added to the list of foods in a final food question about foods eaten at least three times during the previous month. These foods were not among the Food Groups explaining 90 % of any nutrient intake but warranted mention based on their frequency of reported intake in CCHS and their increasing popularity since CCHS was conducted (e.g. beef jerky; sushi; game meat). A question pertaining to cooking method was also included on the C-DHQ II to determine how often meat was broiled, grilled, barbecued or pan-fried. The question was motivated by research interest in the health effects of heterocyclic amines and polycyclic aromatic hydrocarbons( Reference Ananthakrishnan, Du and Berndt 25 , 26 ).
Foods found on the US DHQ II but not available in Canada (e.g. fat-free potato chips) or those that were too infrequently consumed (e.g. carrot juice; grits) were not included on the C-DHQ II.
Analysis of seasonal variation in the consumption of twenty-one Food Groups, queried as individual line-items or as embedded questions, was performed using CCHS data. The intake of fifteen Food Groups (soup (four Food Groups), hot cereals, oranges, grapefruit, peaches, cantaloupe, other melon, strawberries, tomatoes (two Food Groups) and corn (two Food Groups)) showed some seasonal variation in consumption that was consistent with queries on the US DHQ II. Hence the seasonal components for most questions were retained. The consumption of soft drinks (four Food Group items) and beer, however, did not vary substantially and hence the seasonal components of these questions were removed.
Since the C-DHQ I has been in use by Canadian investigators for a number of years( Reference Robson, Siou and Ullman 27 – Reference Csizmadi, Kelemen and Speidel 33 ), differences between the C-DHQ I and II are listed in the online supplementary material, Supplemental Table 1. The differences reflect those described for the US DHQ II v. C-DHQ II, as well as additional changes based on CCHS analyses and recently available foods on the Canadian market (e.g. sports drinks; energy drinks).
Comparison of the US DHQ II and C-DHQ II portion sizes
For fifty-three of the 143 line-items that queried portion sizes, CCHS analyses indicated that at least one of three portion size categories warranted modification from those found on the US DHQ II. These included both increases (e.g. melons and salsa) and decreases (e.g. beef mixtures and fried shellfish). In addition, where feasible, as in cases where foods were reported in CCHS and added as new line-items on the C-DHQ II, de novo portion sizes were derived from CCHS data.
Development of the nutrient database for the C-DHQ II
Since most questions on the C-DHQ II were mapped to Food Groups created from CCHS foods, the CCHS nutrient database was used to generate the C-DHQ II nutrient database, with a few exceptions. For some foods generally consumed in combination with other foods (e.g. milk in cereal/tea/coffee; butter on vegetables and bread) the quantities of the added milk and butter were not available from CCHS to estimate their portion sizes. Hence the portion sizes reported in the US National Health and Nutrition Examination Survey (2001–2, 2003–4 and 2005–6)( 34 ) 24 h dietary recalls were used as proxy portion sizes and were then used to create nutrient profiles for the C-DHQ II nutrient database. For foods that were included on the C-DHQ II but not reported in CCHS (e.g. almond milk; oil sprays; herbs/spices) other food composition data sources were used to obtain nutrient values( 35 ). Fast-food hamburger and cheeseburger nutrient profiles were also unavailable from CCHS nutrient profiles and were obtained from a Canadian food and recipe database maintained in the Food Directorate at Health Canada.
The C-DHQ II nutrient database is comprised of 1986 rows of nutrient profiles, corresponding to six nutrient profiles for each of 331 Food Group items linked to a question on the questionnaire. For 263 Food Groups, nutrient profiles were derived by estimating the weighted means by sex and by portion size. For the remaining Food Groups, in order to ensure at least five observations per cell, sex and/or portion sizes were combined resulting in nutrient profiles that did not vary by portion size (e.g. veal; venison; lamb dishes; olives) or portion size and sex (e.g. oil sprays; spices; dark chocolate).
Discussion
We analysed data from CCHS – Cycle 2.2 Nutrition (2004) to determine the ability of the C-DHQ I to capture food consumption in Canadian populations. Our results indicate that for the key nutrients examined, more than 80 % of the intakes could potentially be captured by the C-DHQ I. The results presented here provide empirical evidence supportive of the C-DHQ I food list as representative of core foods most commonly consumed by adults in Canada in relation to the intake of seventeen targeted nutrients. This is of relevance to the historical use of the C-DHQ I which had previously been modified to increase the face validity of the questionnaire but had not been evaluated against Canadian survey data( Reference Csizmadi, Kahle and Ullman 12 ).
We also analysed CCHS data to modify the more recently available US DHQ II for use in Canadian adult populations by designing the C-DHQ II. In order to ensure that new food consumption trends and products appearing on the Canadian market since 2004 were reflected on the C-DHQ II, we consulted with nutrition experts and examined commercial food market databases. Hence, the C-DHQ II is an expanded and updated version of the C-DHQ I (153 v. 134 food questions; twelve v. eleven supplement questions) and modifications (e.g. reflecting item additions and changes, portion size adjustments) are anticipated to improve intake measures of certain core and other nutrients in such a way as to better reflect contemporary dietary habits (e.g. folic acid: supplement addition; vitamin D: fish questions and supplement doses; phyto-oestrogens: flaxseed and separation of tofu and soya meat substitutes).
There are a number of advantages to developing Canadian FFQs based on the US DHQ I and II. First, we were able to leverage scarce resources for dietary assessment by utilizing the database and software infrastructure already available for the US DHQ I and II. Second, the original design and layout of the US DHQ I and II have undergone cognitive testing to ensure that they facilitate dietary intake reporting( Reference Thompson, Subar and Brown 36 ). These design aspects were retained for the C-DHQ I and C-DHQ II. Third, the technology for the web version of the US DHQ II had already been created and tested by colleagues at the National Cancer Institute, which greatly facilitated and advanced the development of the web version of the C-DHQ II.
The paper version of the C-DHQ II is designed to facilitate data entry using optical scanning. The data are then analysed using Diet*Calc (version 1.5.0), a freely available software program that uses a data dictionary that has been modified for the C-DHQ II. In order to facilitate the use of the C-DHQ II across Canada, it has been translated into French and can be used in adult populations of both official languages. Canadian researchers can access the paper and web versions of the C-DHQ II for past-month and past-year time windows, in French and English, along with the associated nutrient database and software program at https://canadiandhqii.com/survey_resources.html.
A number of FFQs have been designed for specific purposes and populations in Canada( Reference Liu, Wang and Roebothan 37 – Reference Kelemen, Anand and Vuksan 41 ); however, to our knowledge the C-DHQ I and II are the only FFQs that have used CCHS data to evaluate and develop the food list, portion size categories and nutrient database. The availability of nationally representative dietary survey data has provided an objective analytical option to assist in these tasks. Investigators can therefore be assured that the C-DHQ I and II are designed to capture the intakes of Canadian adult populations.
Access to national dietary intake data for tailoring food lists and for the determination of portion sizes is invaluable for designing comprehensive ‘full-diet’ FFQs such as the C-DHQ II. The questionnaire design, however, is only one component of this dietary assessment tool. The other critical component is the development of the companion nutrient database that converts foods into nutrients. When national food intake data are linked to nutrient profiles that represent the foods surveyed, as in the case of CCHS, the steps involved in creating the nutrient database are greatly facilitated. Most surveys, however, are designed to address general dietary questions that are limited to the interests of the sponsoring agency; hence, nutrient profiles may not be comprehensive enough to meet the needs of diverse research objectives. This is a major limitation of the C-DHQ II nutrient database in its current state with only thirty-four nutrients (compared with the US DHQ II with 160 nutrients and dietary constituents). In order to meet the needs of the broader research community, augmenting the database with additional nutrients and food group equivalents for dietary patterns analysis is essential. Work is currently in progress to complete this task.
The US DHQ is one of several FFQs used in large-scale studies( Reference Subar, Thompson and Kipnis 42 ). FFQs are acknowledged to be convenient, cost-efficient dietary assessment tools that allow for the rapid estimation of habitual long-term dietary intakes( Reference Satija, Yu and Willett 7 ). Nevertheless, they have been criticized and their utility questioned( Reference Kristal, Peters and Potter 43 , Reference Archer and Blair 44 ) since they have been shown to result in substantial measurement error in the reporting of absolute energy and protein intakes( Reference Prentice, Mossavar-Rahmani and Huang 1 , Reference Subar, Kipnis and Troiano 2 ). A number of methodological approaches have been proposed to adjust for some of the measurement error associated with these and other nutrients. Traditional methods that have been shown to improve FFQ estimates of some nutrients include energy adjustment using self-reported energy intake and regression calibration using dietary records or 24 h recalls as reference instruments( Reference Subar, Freedman and Tooze 45 ). Methods have also been developed to combine data from multiple instruments (e.g. FFQ and 24 h intakes) to capitalize on the strengths of each instrument with the improvement of data quality in self-report( Reference Carroll, Midthune and Subar 9 ).
The use of sensitivity analysis to identify individuals who may be ‘invalid reporters’ of energy intake has also been suggested; however, the utility of these approaches is still to be determined( Reference Tooze, Krebs-Smith and Troiano 46 – Reference Garriguet 48 ). Estimates of dietary intake and their impact on health outcomes and disease risk are examined across strata of valid and invalid energy intake reporting, under the assumption that misreporting of energy intake and a broad range of nutrients tracks along similar misreporting patterns( Reference Mendez, Popkin and Buckland 49 , Reference Rhee, Sampson and Cho 50 ).
Other novel statistical methods that rely on calibration equations derived from objective measures of energy, protein and potassium such as doubly labelled water and 24 h urine collections for urea nitrogen and potassium, respectively, have been shown to improve estimates of these nutrients derived from FFQs( Reference Prentice, Mossavar-Rahmani and Huang 1 , Reference Freedman and Ford 51 ) and may also improve the estimation of associated disease risk by correcting for the systematic bias inherent in self-report( Reference Tinker, Sarto and Howard 4 – Reference Prentice, Shaw and Bingham 6 ). However, these methods are still underutilized in nutritional epidemiology as they require statistical expertise, intensive data collection and the use of objective biomarkers that are often deemed to be too expensive and too burdensome for participants. In addition, few objective biomarkers exist for this purpose( Reference Jenab, Slimani and Bictash 52 ) and hence other statistical methods continue to evolve to improve the quality of dietary assessment data derived from self-reporting methods( Reference Carroll, Midthune and Subar 9 ).
All self-reported methods of dietary assessment are associated with systematic and random measurement error. In tailoring the DHQ II for use in Canada we have attempted to lessen errors that may be related to FFQ food lists, portion sizes, seasonality and nutrient databases not reflective of recent food consumption patterns and food supply in Canada. However, errors related to other FFQ design characteristics( Reference Molag, de Vries and Ocké 53 ) and the misreporting that is associated with person-specific characteristics cannot be ignored and need to be addressed with other analytical and study design methods.
Conclusion
In conclusion, both the C-DHQ I and the updated C-DHQ II are suitable for use in Canada, with the latter version representative of more recently available foods and portion sizes in relation to food consumption patterns specific to Canada. Both questionnaires are in use in a number of epidemiological studies across Canada including Alberta’s Tomorrow Project( Reference Bryant, Robson and Ullman 14 ) and CARTaGENE (Quebec)( Reference Awadalla, Boileau and Payette 54 ) which have membership in the Canadian Partnership for Tomorrow Project longitudinal cohort study( Reference Borugian, Robson and Fortier 55 ). Since both C-DHQ I and C-DHQ II reflect food lists representative of foods most commonly consumed by Canadians (e.g. major food sources of seventeen nutrients), they are expected to adequately capture Canadian diets. However, while the C-DHQ II is recommended for the contemporary assessment of usual intake, our results suggest that the C-DHQ I likely performed similarly during an earlier time period. Work is currently in progress to expand upon the C-DHQ II nutrient database with additional nutrients and food constituents of interest in chronic disease risk (e.g. glycaemic index) and variables that will facilitate the derivation of diet quality measures (e.g. Healthy Eating Index). These enhancements of the nutrient database will support the comparability of nutrient and food group summary results from the C-DHQ I and II, and expand the potential for direct comparisons.
Acknowledgements
Financial support: This research was supported by funds to the Canadian Research Data Centre Network (CRDCN) from the Social Sciences and Humanities Research Council (SSHRC), the Canadian Institute for Health Research (CIHR), the Canadian Foundation for Innovation (CFI) and Statistics Canada. Although the research and analysis are based on data from Statistics Canada, the opinions expressed do not represent the views of Statistics Canada. G.L.S. works with Alberta’s Tomorrow Project and is funded by the Alberta Cancer Foundation and the Alberta Cancer Prevention Legacy Fund (administered by Alberta Innovates – Health Solutions). Funding for a contract with Statistics Canada for analytical support provided by D.G. was funded by a grant to Dr Mary L’Abbé, Department of Nutritional Sciences, University of Toronto (grant number CIHR 201103 SOK118150). Funding for contracts with Westat, Inc. (Teleform programming) and Information Management Systems, Inc. (web version of the C-DHQ II) were provided by CARTaGENE (CHU Sainte Justine), Montreal. The funders had no role in the design, analysis or writing of this article. Conflict of interest: None. Authorship: I.C. conceptualized the study design, analyses, supervised the study and drafted the manuscript; I.C., B.A.B., I.M., I.R., A.K. and A.F.S. made important intellectual contributions to the development of the C-DHQ II and conducted the work; G.L.S. and D.G. carried out the data programming and analyses; and J.E. coded the CCHS foods. All authors contributed substantially to revisions of the manuscript, read and approved the final manuscript. Ethics of human subject participation: Not applicable.
Supplementary Material
To view supplementary material for this article, please visit http://dx.doi.org/10.1017/S1368980016001506


