


Studies emphasize the negative health impacts of high sugar consumption such as obesity, type 2 diabetes and heart disease, as well as poor dental health(Reference Ludwig1, Reference Tahmassebi, Duggal and Malik-Kotru2). Sugar-sweetened beverages (SSB) are major contributors to energy intake(Reference Block3). Studies in the USA indicate that the consumption of SSB such as fruit drinks (<100 % fruit juice with added sugar) and regular soft drinks (carbonated beverages and colas) has increased dramatically within the last three decades, while the consumption of milk has decreased(Reference Wang, Bleich and Gortmaker4). This pattern suggests the replacement of milk by SSB(Reference Wang, Bleich and Gortmaker4). In 2000, SSB were the main source of energy from beverages consumed among Americans, contributing 9·2 % to the total energy intake(Reference Block3), an amount more than two times greater than the 3·9 % documented in the late 1970s(Reference Nielsen and Popkin5). On the other hand, the percentage of energy intake from milk declined from 8·0 % to 5·0 %, with only minor changes in the consumption of all other beverages such as alcohol, coffee and tea, fruit drinks and fruit juices(Reference Nielsen and Popkin5).
Statistics Canada food disappearance data from the 1980s to 2000 show that soft drinks have been the top beverage of choice in Canada and the consumption is projected to remain so, while there has been a dramatic decline in per capita milk consumption which is predicted to continue to decrease to 2020(6). Food and beverage disappearance data, however, do not provide information on consumption patterns among specific age/sex groups. While beverage intake patterns have been investigated among American adults(Reference Duffey and Popkin7, Reference Storey, Forshee and Anderson8), the beverage patterns of Canadian adults are not yet fully understood, requiring further investigation.
Due to the complexity of dietary behaviours, various methods are used to assess such patterns. The key goal of a dietary pattern assessment at a population level is to investigate its association with health outcomes(Reference Tucker9). Some methods of dietary pattern measurement include principal component analysis, cluster analysis and, most recently, reduced rank regression(Reference Tucker9). The present study uses cluster analysis, a method that identifies homogeneous groups in a population, thus minimizing within-group variation and maximizing between-group variation(Reference LaRowe, Moeller and Adams10). It is also used to describe actual intake patterns in the population with good reproducibility(Reference LaRowe, Moeller and Adams10).
In Canada, the only available comprehensive nutrition data set is the Canadian Community Health Survey Cycle 2·2 (CCHS 2·2), conducted in 2004, which provides information on food intake (including beverages) of Canadians, as well as measured weight and height, at both national and provincial levels. In a separate paper we have analysed the beverage patterns of Canadian children, and there we found the appearance of clusters that were related to SSB intake, raising health concerns for Canadian children(Reference Danyliw, Vatanparast and Nikpartow11). In 2008, Garriguet(Reference Garriguet12) published an initial descriptive analysis of beverage intake of Canadian adults using data from the CCHS 2·2. However, to our knowledge, no studies have explored patterns of beverage intake of Canadian adults.
Experimental methods
Data from CCHS 2·2 were used in the present study. CCHS 2·2 was a single cross-sectional nutrition survey in which data were collected from 14 January 2004 to 21 January 2005. Weighting adjustments were done to reduce the effect of season and day of the week, so that the fraction of the sample interviewed each season corresponded to 25 % of the entire population for each province and the fraction of the sample interviewed on a weekday corresponded to 4/7 of the same population(13). A computer-assisted interviewing technique was used to complete the questionnaires. The validated automated multiple-pass method with a five-step approach was applied to help participants recall 24 h food and beverage intake(13–Reference Blanton, Moshfegh and Baer16). There were no proxy interviews for those above age 12 years. Respondents were able to choose the beverage portion size from a general pre-set list with pictures of various sizes of mugs, glasses and bowls, and reported beverage portion sizing was systematically converted into gram weights using an in-house computer-based system that was developed by Statistics Canada.
Household income was recorded as total income of all household members before taxes and deductions from all sources in the last 12 months. To determine income levels, we used the income variable with five categories created by CCHS 2·2, which was based on the combination between income and the number of people living in the household (14).
The physical activity index variable was created to measure the respondents’ average daily energy expended (three categories) during leisure-time activities in the past 3 months including inactive, moderately active and active(14). The respondent education variable indicates the highest level of education obtained by the respondent(14). From a total of four categories, two were merged to avoid small sample sizes in the cells, and the new variable had three categories: less than secondary, secondary and post-secondary education. Additional information on CCHS 2·2 can be found elsewhere(14).
The national response rate of 76·5 % was achieved in CCHS 2·2. Weight was measured with portable high-quality scales and for standardization purposes, interviewers were appropriately trained and monitored to measure height(13).
Data analyses
Data analyses were conducted in three stages: (i) cleaning, processing and descriptive analysis; (ii) determining the pattern of beverage intake; and (iii) advanced statistical modelling.
Cleaning and processing
Through a multiple-step procedure of detection, classification, coding, merging and correction, beverages were identified and isolated from the food and beverage files in CCHS 2·2. Based on the beverage categories that have been created in our previous analysis(Reference Garriguet12), each identified beverage group was assigned a code (1–17) using SAS software. The seventeen beverage groups were: 1 = fruit drinks; 2 = regular soft drinks; 3 = tea, sweetened; 4 = coffee, sweetened; 5 = plain milk; 6 = milk-based beverages, >2 % fat; 7 = milk-based beverages, ≤2 % fat; 8 = other types of milk; 9 = vegetable juice; 10 = fruit juice; 11 = beer; 12 = wine; 13 = other alcoholic beverages; 14 = water; 15 = diet drinks; 16 = tea; and 17 = coffee. This beverage file was then merged with the main survey file according to the unique individual identification numbers. This created a file that contained demographic, anthropometric and socio-economic variables, as well as beverage intake (weight in grams, energy in kilojoules) from 35 107 participants in the CCHS 2·2.
Characteristics of participants such as age, total energy intake, ethnicity, total household income, physical activity, area of residence, smoking status, household food security, respondent education, immigration status and marital status were included in this section. Individuals above 65 or below 19 years of age, as well as pregnant and breast-feeding women were excluded, as were twenty-seven with missing beverage intakes. We chose to restrict our analysis of participants to those aged 65 years and under as BMI values are not valid in older adults(17). This resulted in the population of interest with a final sample size of 14 277 participants aged 19–65 years.
Determining the pattern of beverage intake
Following a similar procedure to Danyliw et al.(Reference Garriguet12) we used a cluster analysis, the K-means method, to determine the patterns of beverage intake. With the K-means method, it is necessary to predefine the number of clusters – a procedure that is sensitive to outliers(Reference LaRowe, Moeller and Adams10, Reference Garriguet12, 18). In order to take such outliers into account, participants whose intake of a beverage group was ≥5 sd from the mean were temporarily removed. We initially started the procedure with forty clusters (a number higher than two times our seventeen beverage categories) and temporarily removed participants in clusters with five or fewer members. Once the optimal number of clusters was determined, all of the temporarily removed participants were included back into the data set.
Optimal number of clusters was determined using the cubic clustering criterion (CCC), pseudo-F statistic (PFS) and interpretability(18). The values of CCC and PFS for each cluster set with no outliers (three to twenty cluster sets) were recorded and then assessed using a line graph to identify ‘local peaks’ for the values(18). The cluster set(s) at which CCC and PFS both peaked were explored for interpretability. Interpretability was assessed using the mean intake of each beverage category within each individual cluster. For example, where mean milk intake among individuals in Cluster 1 was significantly higher than among any other clusters, this cluster was identified as a unique cluster and named ‘milk cluster’. For interpretability to be achieved, a clear and unique pattern of intake for each cluster was necessary.
From all cluster set analyses, the cluster(s) with the highest number of participants emerged as a mixed cluster(s), where no dominant pattern of beverage intake was observed. This observation was consistent with other cluster analyses on dietary intake, representing the majority of the population who consume a variety of beverages in their diet(Reference LaRowe, Moeller and Adams10).
After reviewing the preliminary results, exploratory analyses were conducted in multiple steps. To determine the most suitable patterns of beverage consumptions in terms of interpretability and adequacy of statistical analyses, we examined the impact of water, age and sex on the clustering process (data not shown). When water was excluded, the clusters had better distribution and statistically meaningful separation. The distribution of clusters among age/sex groups was not interpretable and satisfactory for statistical analysis. Finally, the decision was made to exclude water as a separate pre-defined beverage group from the initial clustering process as we did in our previous study(Reference Garriguet12), and to conduct cluster analyses in males and females separately. Therefore, male and female adult participants were classified into distinct groups based on the predominant patterns of beverage intake.
Advanced statistical modelling
Once the optimal number of clusters was identified, the mean intake of each beverage group (g/d), total beverage consumption (g/d) and the mean percentage of total energy intake from beverages, and their standard errors, were obtained in all clusters. Moreover, the means and frequencies were determined for the sample characteristics of age, total energy intake, ethnicity, total household income, physical activity, area of residence, smoking status, household food security, respondent education, immigration status and marital status. Finally, to test the differences across beverage patterns, χ 2 tests were used. For continuous variables, one-way ANOVA and 95 % confidence intervals of means were examined in a way that, where no overlap existed, the results were considered to be statistically significant. Only if one-way ANOVA presented significant difference, the Scheffe's method was used for post hoc tests. Alpha was set at the 0·05 level. As recommended by Statistics Canada, all analyses were first performed un-weighted, later going through the weighting and bootstrapping steps to take to account the complex survey design in CCHS 2·2(Reference Rhodes, Moshfegh and Cleveland15).
Results
Patterns of beverage intake in Canadian men
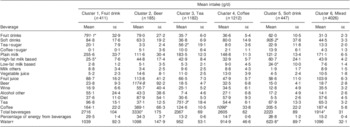
In the CCHS 2·2 sample of Canadian men (n 6814), using cluster analysis and excluding water as a pre-determined beverage group, seven non-overlapping beverage patterns emerged including ‘fruit drink’ (n 482), ‘coffee’ (n 850), ‘milk’ (n 589), ‘beer’ (n 907), ‘soft drink’ (n 658), ‘tea’ (n 699) clusters and a ‘mixed group’ with no predominant beverage consumption (Table 1). The ‘mixed group’ had the largest sample size (n 2629) and the lowest amount of total beverage intake (1930 g/d) compared with the other six clusters (P < 0·05). The ‘soft drink’ cluster had the lowest consumption (2·9 g/d) of diet drinks compared with other clusters (P < 0·05). Those with a dominant pattern of ‘beer’ consumption had the highest total beverage intake (3345 g/d), as well as the highest total percentage of energy intake from beverages (30·5 %), in comparison with the other six groups (P < 0·05).
Table 1 Daily intake of beverages within different clusters: Canadian adult males (n 6814) aged 19–65 years, Canadian Community Health Survey, Cycle 2·2 (2004)

Italic numbers indicate the predominant beverage intake in each cluster.
Mean values were significantly different from those in the other groups using one-way ANOVA and Scheffe's post hoc test: *P < 0·05.
†Water was excluded in cluster analysis; however, mean intake of water was calculated after cluster analysis to assess the distribution of water intake among different clusters.
Percentage of energy intake from beverages in Canadian men characterized as ‘tea’ drinkers (11·1 %) was significantly lower than in other beverage clusters (P < 0·05) and only the minority of tea drinkers had tea with added sugar.
Characteristics of men across beverage patterns
For Canadian men, total household income and income-related food security did not differ across beverage clusters. Age, ethnicity, physical activity, area of residence (urban/rural), smoking status, education, immigration status, marital status and mean total energy intake did differ significantly (ANOVA) among beverage clusters (P < 0·05). However, there was no significant difference between beverage clusters in post hoc tests of age, physical activity, area of residence (urban/rural), smoking status, marital status and mean total energy intake (Table 2).
Table 2 Characteristics of participants within different clusters: Canadian adult males (n 6814) aged 19–65 years, Canadian Community Health Survey, Cycle 2·2 (2004)

M, married; C, common-law; W, widowed; Sep, separated; D, divorced.
Values were significantly different from those in the other groups using the χ 2 test for categorical variables or one-way ANOVA and Scheffe's post hoc test for continuous variables: *P < 0·05.
Men in our study had a mean age ranging from 34·6 years in the ‘soft drink’ cluster to 44·5 years in the ‘coffee’ cluster. Larger proportions of non-white ethnicity (31·9 %) and immigrants (41·9 %) were found in the ‘tea’ cluster compared with other clusters. The ‘coffee’ cluster and ‘soft drink’ cluster had the lowest proportion of adults with post-secondary education (49·1 % and 42·8 %, respectively) compared with other beverage clusters. Although the results of ANOVA were significant (P < 0·05), post hoc analyses revealed no significant difference in total energy intake across beverage clusters in men. Detailed characteristics of patterns of beverage intake across clusters in men are presented in Table 2.
Patterns of beverage intake in Canadian women
Six distinct beverage patterns emerged among Canadian women (n 7463) in the CCHS 2·2 sample (Table 3). The six beverage clusters in women were: ‘fruit drink’ (n 411), ‘beer’ (n 185), ‘tea’ (n 1182), ‘coffee’ (n 1212), ‘soft drink’ (n 447) and a ‘mixed group’, a combination of beverages with no dominant pattern of beverage consumption. Similar to men (Table 1), the ‘mixed group’ in women had the largest sample size (n 4026) and the lowest amount of total beverage intake (1914 g/d) compared with the other beverage clusters (Table 3). The ‘beer’ pattern had the highest total beverage intake (3330 g/d) compared with the other five groups.
Table 3 Daily intake of beverages within different clusters: Canadian adult females (n 7463) aged 19–65 years, Canadian Community Health Survey, Cycle 2·2 (2004)
Italic numbers indicate the predominant beverage intake in each cluster.
Mean values were significantly different from those in the other groups using one-way ANOVA and Scheffe's post hoc test: *P < 0·05.
†Water was excluded in cluster analysis; however, mean intake of water was calculated after cluster analysis to assess the distribution of water intake among different clusters.
Unlike men, no dominant pattern of milk consumption emerged in Canadian women; however, the consumption of plain milk (256 g/d) was significantly higher (P < 0·05) among the ‘fruit drink’ cluster compared with the other five clusters. The consumption of water (624 g/d) in the ‘soft drink’ cluster was significantly lower than its intake in the other clusters (Table 3). Unlike the findings for men, no significant difference was observed in energy intake from beverages across clusters in women.
Characteristics of women across beverage patterns
For Canadian women, age, ethnicity, total household income, physical activity, area of residence (urban/rural), smoking status, income-related household food security, education, immigration status, marital status and mean total energy intake did differ significantly in multiple comparison among beverage clusters (P < 0·05). However, there was no significant difference between beverage clusters in post hoc tests of age, total household income, household food security, respondent education and marital status (Table 4).
Table 4 Characteristics of participants within different clusters: Canadian adult females (n 7463) aged 19–65 years, Canadian Community Health Survey, Cycle 2·2 (2004)

M, married; C, common-law; W, widowed; Sep, separated; D, divorced.
Values were significantly different from those in the other groups using the χ 2 test for categorical variables or one-way ANOVA and Scheffe's post hoc test for continuous variables: *P < 0·05.
Women's ages ranged from a mean of 34·8 years in the ‘soft drink’ cluster to 44·6 years in the ‘coffee’ and ‘tea’ clusters. The ‘tea’ cluster had larger proportions of non-white ethnicity (27·8 %) and immigrants (34·2 %) compared with the other clusters. The ‘soft drink’ cluster had the highest proportion of inactive participants (74·4 %) compared with other clusters. As well, the proportion of former smokers in the ‘soft drink’ cluster (16·7 %) was statistically lower (P < 0·05) than in the other clusters. The proportion of female participants living in rural areas was significantly higher in the ‘beer’ cluster (34·2 %) compared with the other five beverage clusters. The mean total energy intake in the ‘mixed group’ (7172 kJ/d) was lower than its intake in the other groups (P < 0·05). Characteristics of patterns of beverage intake across clusters in women are presented in Table 4.
Discussion
Exploratory cluster analyses allowed us to determine the most suitable clusters representing beverage consumption patterns of Canadian adults aged 19–65 years. Seven distinct beverage clusters and six clusters emerged in Canadian men and women, respectively. To our knowledge, there is no equivalent study that characterized beverage intake patterns using cluster analysis in the US adult population or any other developed country to allow for comparison. Based on a literature review, all studies derived from the National Health and Nutrition Examination Survey (NHANES) used the traditional method of examining mean intakes across age groups.
The present study showed that the mean consumption of the dominant beverage in each cluster was higher in men than in women, a finding similar to descriptive studies(Reference Danyliw, Vatanparast and Nikpartow11, Reference Garriguet19). The emergence of a ‘beer’ cluster in both men and women, where the intake of beer was higher than that of other dominant beverages, indicates the popularity of this beverage among Canadian adults, particularly men aged 19–65 years. There are no data in Canada to examine the trends in beer consumption; however, Statistics Canada food disappearance data show a per capita estimate of 77·30 litres in 2009(20). Data from NHANES indicate that beer is one of the top ten sources of energy intake among American adults(Reference Riserus and Ingelsson21–Reference Clevidence, Taylor and Campbell23). The health impacts of low and moderate alcohol intake are controversial; however, excessive consumption of alcohol is associated with increased morbidity and mortality(Reference Mukamal and Rimm24).
Descriptive data from CCHS 2·2 indicated that milk is the main dietary source for vitamin D and Ca, and that women aged 19–50 years had the lowest intakes of vitamin D and Ca compared with other age/sex groups(Reference Vatanparast, Calvo and Green25). Accordingly, although milk intake among those who drank fruit drinks was significantly higher than in other clusters, no milk cluster emerged among women. The low milk intake in Canadian women relative to other beverages and the absence of a milk cluster suggest that women are not benefiting from the bone beneficial nutrients in milk compared with men. Using CCHS 2·2 data, we indicated that many Canadian women do not meet the requirements for Ca(Reference Vatanparast, Dolega-Cieszkowski and Whiting26). Although controversies exist, along with bone beneficial effects, studies suggest that milk consumption lowers cholesterol levels due to its Ca and protein content and decreases glycaemic response compared with mixed meals due to its whey content, which is insulinotrophic(Reference Pfeuffer and Schrezenmeir27).
Among all clusters, the ‘mixed group’ had the lowest consumption of total beverages in both men and women. In terms of proportion of energy intake from beverages, in contrast to women, ‘tea’ drinker men had the lowest proportion of energy intake from beverages and ‘beer’ drinker men had the highest proportion of energy intake from beverages.
Water intake among different clusters was assessed after clusters had emerged. The consumption of water ranked as first or second beverage among all clusters in both males and females. This is in agreement with the results from Duffey and Popkin's study(Reference Duffey and Popkin7) on beverage consumption of the US population which showed that water was the most frequently consumed beverage.
Among men, those in the ‘soft drink’ cluster had the lowest proportion of higher levels of education compared with other beverage clusters, suggesting that higher levels of education might influence choice of better-quality beverages. However, this is contradicted by our finding that over 60 % of Canadian male and female adults with a dominant pattern of ‘fruit drink’ intake had post-secondary education. Fruit drinks, which are SSB, pose similar health risks to soft drinks. In women, the ‘soft drink’ cluster had the lowest proportions of active and moderate levels of physical activity as well as the lowest proportion of former smokers compared with other beverage clusters. This indicates the need for more lifestyle modification interventions in this group.
The most recent beverage consumption data available for the US population are from nationally representative NHANES data in 2005–2006(Reference Popkin28), which show that, after water, the most consumed beverages by American adults were soda/fruit drinks followed by whole-fat milk. In terms of energy intake from beverages, SSB was the major contributor except for American adults aged 40–59 years who consumed more alcoholic beverages(Reference Popkin28). In another US study, sugar-sweetened soft drinks and fruit drinks accounted for 18 % of the total volume but contributed 46 % of the energy(Reference Popkin, Armstrong and Bray29). The US Beverage Guidance Panel(Reference Popkin, Armstrong and Bray29) and Canada's Food Guide(30) recommend that these beverages be replaced by beverages with less energy and more nutrients such as low-fat milk. Our finding that women in the mixed beverage group had significantly lower total energy intake than women in the other clusters indicates that balance in intake of beverages from a variety of beverage sources may provide less energy. Further studies are needed to evaluate how energy intake from beverages is associated with overweight and obesity as one of the major global public health concerns.
Studies based on data from large surveys such as CCHS 2·2 have limitations due to the survey design and analytical approaches. Intake data from a single 24 h recall do not reflect day-to-day variation in one's usual pattern of dietary intake; however, the mean intake from one 24 h recall is similar to the statistically adjusted mean intake ‘usual intake’ from two 24 h recalls(Reference Rhodes, Moshfegh and Cleveland15). In dietary pattern analysis, there is no gold standard for determining the number of clusters in cluster analysis (K-means method)(Reference Tucker9, Reference LaRowe, Moeller and Adams10). A subjective decision is made based on the existing evidence. We determined the best cluster solution by plotting PFS and CCC, and identifying meaningful emerging beverage consumption patterns that were interpretable both statistically and in the light of most recent literature. The large sample size allowed identification of discrete beverage patterns. Such an approach is more comprehensive in identifying patterns of beverage consumption in populations than regular analysis where only mean intake of beverages is determined.
Conclusions
There are consumption patterns of SSB including soft drinks and fruit drinks among Canadian adults as well as Canadian children(Reference Danyliw, Vatanparast and Nikpartow11). The contribution of SSB (fruit drinks and soft drinks) was over 50 % of total energy intake from beverages. This, along with the low level of physical activity found in the CCHS 2·2, warrants further research to evaluate whether these patterns of SSB consumption are associated with overweight, obesity and co-morbidities. Public health nutrition messages, such as reducing SSB intake and replacing them with healthy beverages, should be targeted to specific sex, age and sociodemographic groups. However, most preventive strategies and health messages to limit the intake of carbonated soft drinks have been targeted mainly to children(Reference Malik, Schulze and Hu31). Our findings indicate a need to target adult men and women.
Acknowledgements
Sources of funding: This study received financial support from the Canadian Institute of Health Research (CIHR). Conflicts of interest: None of the authors have conflict of interest. Authors’ contributions: S.J.W., H.V. and N.N. designed research; N.N. and A.D.D. conducted the research; N.N. analysed the data; N.N., H.V., S.J.W. and H.L. wrote paper; H.V. had primary responsibility for the final content. All authors read and approved the final manuscript.


