


The agricultural sector serves many useful functions, including food provision, and uses a substantial amount of natural resources such as water, energy and land. Globally, agriculture accounts for 70 % of water withdrawals( 1 ) and is within the highest energy-use category( 2 ). Approximately 2·3 million tonnes (5 billion pounds) of pesticides are applied globally every year( 3 ). Worldwide fertilizer use was about 180 million tonnes in 2012 and is forecast to increase( 4 ). More than one-third of the global ice-free land surface is used for food production( 5 ). With a forecasted growth in population of about 2 billion people by 2050( 6 ), the resources required for food production are set to increase considerably.
Numerous critical environmental issues are intensified by agricultural practices. In relation to water use, these include surface and groundwater pollution, over-drafting of aquifers and salinization of soils( Reference Tanji and Enos 7 , Reference Horrigan, Lawrence and Walker 8 ). The use of fossil fuels contributes to air pollution, soil and water contamination and greenhouse gas emissions. Pesticides persist in the environment and result in surface and groundwater contamination, damage to non-targeted species and increased resistance in pests( Reference Horrigan, Lawrence and Walker 8 , Reference Kiraly 9 ). From the N applied in fertilizers, it is estimated that less than half is absorbed, with the remainder entering the environment and causing many problems such as surface and groundwater contamination, oceanic ‘dead zones’, a decrease in plant species and a reduced production of biomass( Reference Horrigan, Lawrence and Walker 8 ).
Climate change and other constraints, including land availability and rising levels of urbanization and industrialization, will continue to threaten food production with increasing severity( Reference Horrigan, Lawrence and Walker 8 , Reference Rockstrom, Steffen and Noone 10 ). Considered together with the need to generate fewer overall environmental impacts( Reference Howden, Soussana and Tubiello 11 ), a more efficient use of resources for food production is essential within the context of food and nutrition security. While technology plays an important role in terms of increasing efficiency and in mitigating the adverse environmental impacts, the required reductions also necessitate behavioural change, i.e. a shift towards less resource-intensive food choices( Reference Garnett 12 – Reference Foley, Ramankutty and Brauman 14 ). Hence, a change in food consumption patterns has been described as ‘inevitable’( Reference Garnett 12 , Reference Aiking 15 ). Nutritional provision should also be considered in such a dietary shift. Dietary protein and N are intrinsically and uniquely linked, hence protein is regarded as an essential nutrient given that N is a vital component of DNA, RNA and protein( Reference Aiking 15 ). While also accounting for nutritional needs, the present investigation was designed to explore the resource requirements and waste products for a range of popular foods relatively high in protein.
Experimental methods
The present research utilized agricultural production data from the state of California. A variety of resources were reviewed and data were collected and applied to commodity production statistics. From this, indices were calculated and used for comparing the environmental impact associated with producing 1 kg of edible protein from two popular and nutrient-dense plant-protein sources (kidney beans and almonds) and three commonly consumed animal sources of protein (beef, chicken and eggs). The inputs that were measured in the study included the following: land (m2); water (m3) for growing plants, raising animals and growing animal feed; total fuel used at farms (litres; gasoline and diesel) for agricultural machinery and vehicles used for sowing, reaping and harvesting commodities and for the transport of commodities and personnel; and total fertilizer (g; N, P and K) and pesticide (g) for growing the plant commodities and animal feed (maize, soyabean, alfalfa). Animal waste (kg; manure) was computed for the egg, chicken and beef commodities.
A prior California-based study( Reference Marlow 16 ) contained algorithms, coefficients and calculations for the measured inputs. Additional information for computing the feeding rations for animals( Reference Ernst 17 , Reference Prigge 18 ), land usage( 19 , Reference Teaster, Hammett and Long 20 ), total fuel requirements(21, 22 ), and fertilizer and pesticide use(21, 23 ) was reviewed. The information for animal waste generation was obtained from the Virginia Cooperative Extension, Virginia Tech( Reference Ogejo 24 ) and conversion factors to compute raw commodities to cooked foods (as commonly consumed) were obtained from the US Department of Agriculture Standard Reference( 25 ) and Reference Verheijen, Wiersema and Hulshoff PolFAO ( Reference Verheijen, Wiersema and Hulshoff Pol 26 ) databases. Conversion factors were subsequently used to compute the production losses for the commodities from the farm to the retailer and from the raw to the cooked weight (moisture loss or gain).
Almonds and eggs from their raw weight at the farm to their edible weight on the table is the same, therefore a conversion factor is not indicated. The weight of dried kidney beans was converted to cooked kidney beans using a conversion factor of 2·66( 25 ). In relation to chicken and beef production, weight losses at farms and processing plants were also taken into account. Cooking losses at the level of consumers’ kitchens were also considered. On average by weight, 66 % of chicken yield and 41 % of beef yield are useable meat( Reference Verheijen, Wiersema and Hulshoff Pol 26 ) and the cooking losses for chicken and beef are 35 % and 37 %, respectively( 25 ). Therefore, to combine weight and cooking losses for chicken and beef, 1 kg of raw meat was equal to 0·43 (0·66×0·65) kg of cooked chicken and 0·26 (0·41×0·63) kg of cooked beef. Flowcharts are included to provide examples of the production systems and inputs/outputs to produce edible plant- and animal-protein sources.
Results
Figures 1 and 2 show the flow of inputs and outputs to produce 1 kg of protein from kidney beans and 1 kg of protein from beef, respectively. Table 1 presents the required inputs and animal waste generated to produce 1 kg of edible protein for each of the five protein-rich commodities grown or raised in California. Land, water, fuel and fertilizer use ranged from 15·5 to 282·6 m2, from 10·4 to 109·0 m3, from 0·3 to 2·7 litres and from 160·5 to 1945·1 g, respectively, with kidney beans having the lowest values and beef the highest values. Pesticide use ranged between 9 and 103 g, with kidney beans having the lowest value and almonds having the highest value. Lastly, animal waste generated from the animal commodities ranged from 17·1 kg to 105·1 kg, with eggs having the lowest value and beef the highest value.
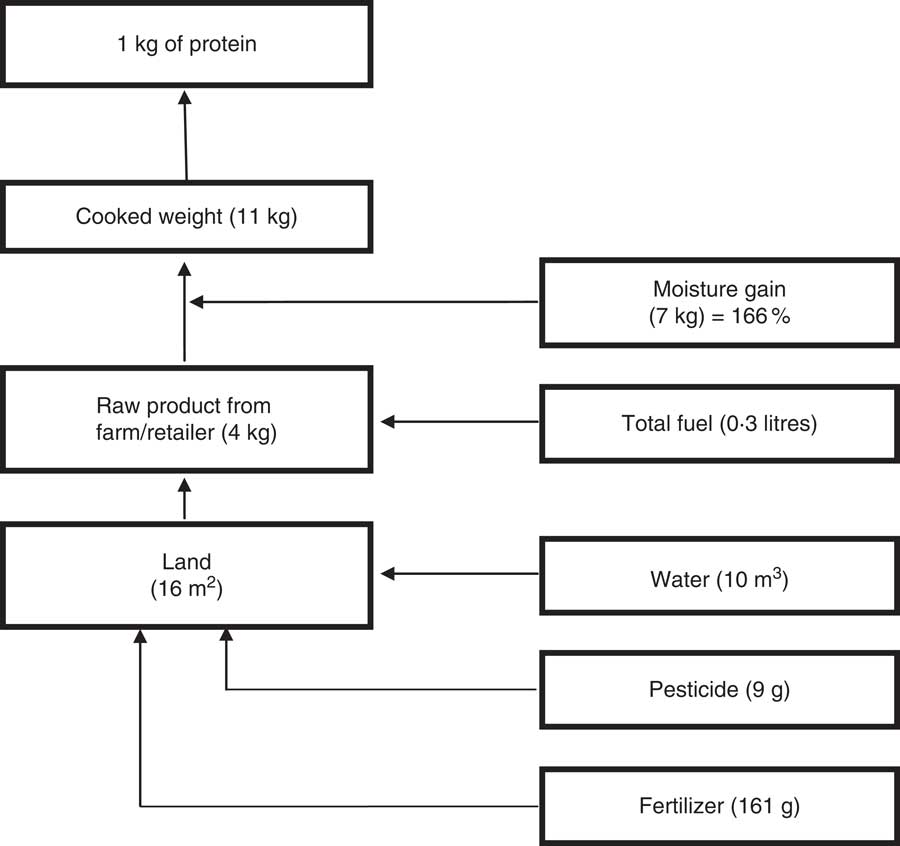
Fig. 1 A diagrammatic view of the inputs and outputs required to produce 1 kg of cooked edible protein from kidney beans
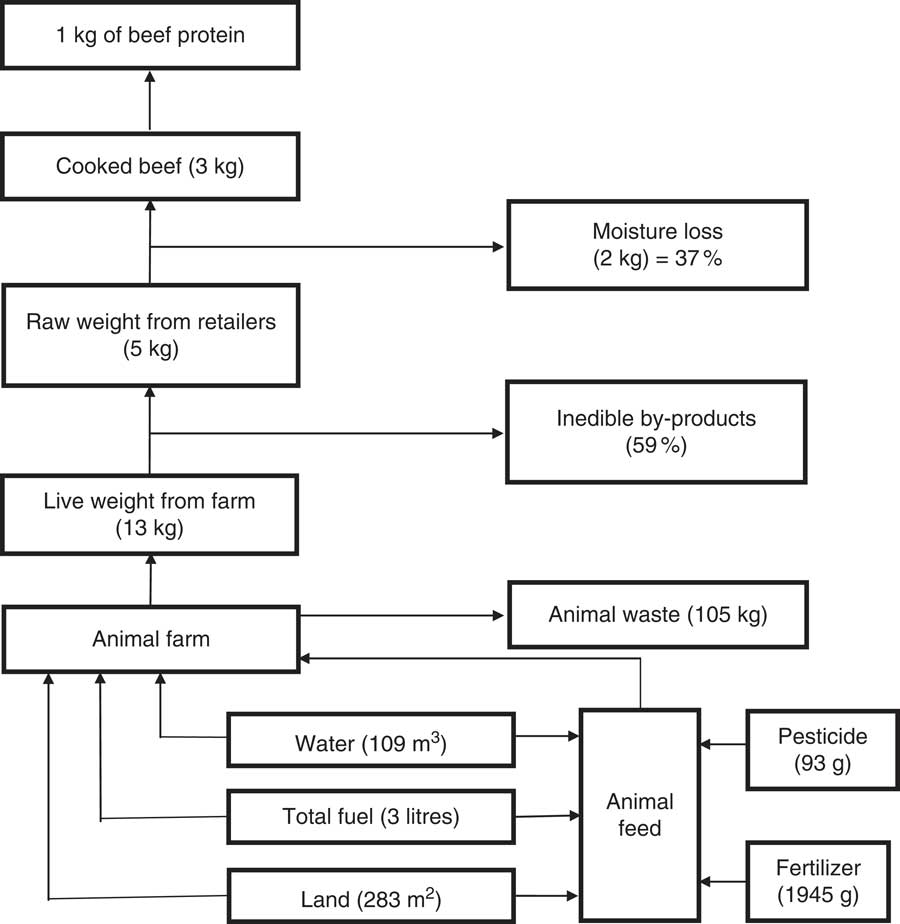
Fig. 2 A diagrammatic view of the inputs and outputs required to produce 1 kg of cooked edible protein from beef
Table 1 Inputs and animal waste generated to produce 1 kg of edible protein from each commodity grown or raised in California

* Total fuel includes gasoline and diesel used on the farm for agricultural and livestock production.
† Total fertilizer includes N, P and K.
‡ Land used for raising animals and for growing animal feed.
§ Water used for raising animals and for growing animal feed.
Table 2 shows the relative environmental impact to produce 1 kg of edible protein for each of the five commodities grown or raised in California. Kidney beans were used as the referent value since they exhibited the lowest values for all measures. For animal waste generation, eggs were the referent value since they exhibited the lowest value for this measure. In relation to land, water, fuel, fertilizer and pesticide, in comparison to kidney beans, beef required eighteen, ten, nine, twelve and ten times more, respectively. Compared with chicken and eggs, beef generated five to six times more animal waste.
Table 2 Relative environmental impacts to produce 1 kg of edible protein from selected plant and animal sources grown or raised in California
* A referent value (1·00) is assigned to kidney beans to derive each input factor for the plant- and animal-based protein sources.
† A referent value (1·00) is assigned to eggs to derive the animal waste factor for the animal-based protein sources.
Discussion
Bean protein had the lowest requirements across the inputs measured. Similarly, previous analyses found soyabeans and other legumes to be less resource intensive in comparison to animal products( Reference Carlsson-Kanyama and Gonzalez 27 – Reference Reijnders and Soret 29 ). Although almond protein required a relatively smaller amount of land and water compared with chicken and beef protein, the use of industrial agricultural practices in California increased its requirement for fuel, fertilizer and pesticides and closely approached or exceeded that of chicken and beef. The large quantity of resources required for farming almonds in California as measured in this comparative analysis limits their viability in terms of meeting the world’s growing demand for protein. Among proteins of animal origin, egg production had the lowest requirement for fuel and produced the least amount of animal waste. The lower requirement for water, fertilizer and pesticide gives egg protein an advantage over protein from almonds, chicken and beef in these respects, which is consistent with a previous analysis( Reference Carlsson-Kanyama and Gonzalez 27 ). Among the protein sources studied, beef required the highest levels of inputs with the exception of pesticide, which is consistent with previous analyses( Reference Goodland and Anhang 30 ). If all of the resources required to produce 1 kg of protein from each food were combined, the demand for all inputs, except pesticide, would be dominated by beef.
The environmental footprint of food production varies widely between food groups. In general, the production of plant foods is more efficient and accounts for a smaller share of natural resource utilization and pollution impacts compared with the production of animal foods( Reference Horrigan, Lawrence and Walker 8 , Reference Baroni, Cenci and Tettamanti 31 – Reference Stehfest, van Vuuren and den Elzen 34 ). Inequality of inputs has always been recognized in the context of producing plant v. animal protein irrespective of the use of modern agricultural technological practices. ‘Meat’ production is environmentally unfriendly due to the need to produce feed for animals and the inherently inefficient conversion of plant protein to meat protein; thus, the direct human consumption of specific plant proteins requires only a fraction of the input of natural resources( Reference Aiking, Helms and Niemeijer 35 ). The livestock sector is responsible not only for a very large proportion of resource consumption, but also for environmental degradation including nutrient imbalances and climate change( Reference Foley, Ramankutty and Brauman 14 , Reference Goodland and Anhang 30 , Reference Eshel and Martin 36 ). Wastes generated by intensified livestock production cause significant water, soil and air pollution and contamination of underground water with trace metals and zoonotic pathogens( Reference Horrigan, Lawrence and Walker 8 , Reference Akhtar, Greger and Ferdowsian 37 ). Currently about 70 % of agricultural land and 30 % of the global land surface is used for livestock production. There is very limited scope to extend these areas without the reallocation of crop or forest land, both of which are undesirable( Reference Stehfest, van Vuuren and den Elzen 34 ).
Dietary protein intake is essential for growth and for a vast array of biological processes in the human body. The safe total protein requirement for the maintenance of adequate protein nutriture for adults is 0·75 g protein/kg body weight per d, which equates to ~10 % of daily energy intake based on a person weighing 65 kg and consuming 8368 kJ/d (2000 kcal/d)( 38 ). Plant- and animal-based protein food sources have their distinctive nutritional values determined by their level of essential amino acids, which are utilized according to an individual’s current physiological requirement and N balance. Further, individuals have a significant magnitude of metabolic flexibility in their day-to-day consumption of protein sources. The essential amino acids found in plant foods including legumes and nuts can satisfy physiological needs and exceed the requirement for adults in the context of an adequate total dietary protein supply equal to or above the aforementioned safe total protein intake( Reference Young and Pellett 39 ).
While the focus of the present study is protein, it is also insightful to consider the five commodities within a wider context. Using the cooked weights in Table 1 and deriving the energy density of each food( 25 ) reveals that the greatest provision is from almonds, followed by eggs, kidney beans, beef and chicken. This has implications for efficiency regarding the resource inputs required and the energy provision of each food. Chicken and beef are the least efficient in this respect. Such considerations are highly important within the context of food security and availability/scarcity. In terms of the macronutrient ratios by energy, when considered in isolation, kidney beans appear to offer the most balanced macronutrient ratio in relation to human needs, given the relatively high content of carbohydrate, lower levels of fat and ample levels of protein. More specifically, kidney beans have a ratio carbohydrate:protein:fat of 73:24:3. This ratio varies only slightly between most beans, with the exception of soyabeans which have more protein and fat than kidney beans (carbohydrate:protein:fat of 23:34:43). Beans also provide high amounts of dietary fibre and are a rich source of vitamins and minerals, including Fe, as well as phytochemicals( 25 ). Hence, beans offer high-quality nutrition and are also the most resource-efficient to produce, in comparison to the other foods measured here.
Consuming plant foods such as beans and nuts is associated with many health benefits, including longevity( Reference Sabate and Ang 40 , Reference Darmadi-Blackberry, Wahlqvist and Kouris-Blazos 41 ). Conversely, consuming animal products, particularly meat, is linked to poor health outcomes including CVD, obesity, diabetes and cancer( Reference Richman, Stampfer and Paciorek 42 – Reference Micha, Wallace and Mozaffarian 45 ). The perception that animal products, particularly beef, are the mainstay of an affluent diet has the potential for tremendous public health and environmental backlash globally( Reference Aiking 15 ). Therefore, there is a convergence of opinion among academics, politicians and non-governmental organizations based on a significant body of evidence to support the need to transition towards a plant-based diet for the health of human populations and to minimize the detrimental environmental impacts associated with food production( 46 – Reference Burlingame and Durnini 48 ).
The present study was focused on the evaluation of five commodities grown or raised in the state of California, which has historically been the largest producer of agricultural food products in the USA and hosts a wide range of operations( Reference Weick 49 ). Additionally, California leads the nation in research and policy in the areas of environmental protection, natural resource conservation and sustainable agriculture( Reference Clark, Klonssky and Livingston 50 ). In light of the difficulty in obtaining reliable data on the quantities of antibiotics and growth hormones that are given to animals for disease prevention and enhanced yield, antibiotic and growth hormones were not included in the present analysis. Had this information been included, the differences in the environmental inputs between plant and animal protein would have been greater. Energy for storing the commodities from the time of purchase at the retailer to the time of meal preparation and plate waste at the consumer level were not included in the study. Lastly, protein formed the basis of this research and hence a detailed analysis including a nutritional profile to assess the overall quality of each food was not included.
Conclusion
In conclusion, producing protein from beans required the least amount of resource inputs while beef required the most, in addition to creating animal waste. Our findings concur with previous analyses that more environmentally friendly plant-protein food choices should be encouraged globally to reduce the intolerable environmental footprint associated with the production of animal-protein foods( Reference Horrigan, Lawrence and Walker 8 , Reference Goodland and Anhang 30 , Reference Stehfest, van Vuuren and den Elzen 34 ). When the findings are considered within the broader context of public health nutrition, there are numerous advantages to be gained from reducing the consumption of animal products and adopting more plant-based food choices( Reference Darmadi-Blackberry, Wahlqvist and Kouris-Blazos 41 , Reference Richman, Stampfer and Paciorek 42 , Reference Micha, Wallace and Mozaffarian 45 – Reference Weick 49 ). Societies will need to provide incentives to fuel the demand for such a dietary shift and must work together to change the perception that animal products, particularly beef, are the mainstay of an affluent and healthy diet.
Acknowledgements
Financial support: This research was supported by the Environmental Nutrition fund and the McLean fund of the Department of Nutrition, Loma Linda University. The funders had no role in the design, analysis or writing of this article. Conflict of interest: None. Authorship: J.S. obtained project funding, conceptualized the research design and was also responsible for data collection and analysis. K.S. was responsible for data collection, data analysis and conducting the research. H.H. made revisions and produced the final draft. M.W. produced the first draft of the manuscript. S.S. conceptualized the research design and was also responsible for data collection. All authors were involved in editing the manuscript. Ethics of human subject participation: Ethical approval was not required.


