


I. INTRODUCTION
Thermal stability of nanocrystalline materials has been the topic of extensive scientific and technological research in the past decades. Reference Koch, Scattergood, Darling and Semones1–Reference Günther, Kumpmann and Kunze3 This relates to the need to control undesirable grain coarsening that nanosamples incur when exposed to high temperatures during either processing or operation conditions, compromising the unprecedented properties that this class of materials can present in terms of hardness and yield strength, for instance. Reference Meyers, Mishra and Benson4 Grain growth inhibition can be engineered from both kinetics and thermodynamics perspectives. Reference Hentschel, Isheim, Kirchheim, Müller and Kreye5,Reference Mehta, Smith and Erb6 While the kinetic approach focuses on inputting ‘pinning’ agents along a grain boundary (GB), slowing migration by creating dragging forces, Reference Michels, Krill, Ehrhardt, Birringer and Wu7 the thermodynamic strategy targets a decrease in GB energy, the direct driving force for coarsening. Reference Kirchheim8 Several works have modeled the energetic stabilization of GBs, Reference Liu and Kirchheim2,Reference Kirchheim8–Reference Millett, Selvam and Saxena10 quantitatively describing the effect of a solute enrichment on the average GB energy of a system as follows:
 $${\gamma _{{\rm{gb}}}} = {\gamma _0} - {\Gamma _{\rm{B}}}\left( {RT\,\ln \,X_{\rm{B}}^{{\rm{bulk}}} - \Delta {H_{{\rm{seg}}}}} \right)\quad .$$
Here, γ0 represents the GB energy of the solvent (host material), ГB is the solute excess in the phase boundary, ΔH
seg is the enthalpy of segregation, and $X_{\rm{B}}^{{\rm{bulk}}}$
is the solute content in the bulk. Equation (1) suggests that solute segregation decreases GB energy and may consequently decrease grain growth.
Reference Millett, Selvam and Saxena10–Reference Castro14
Moreover, it suggests that dopants with high energy of segregation can eventually zero the GB energy.
Reference Kirchheim8,Reference Liu and Kirchheim15
While this concept may sound unreasonable because interfaces are inherently excess energies to a system, this is justifiable by considering the direct dependence of the zero GB energy state on the solute segregation. In other words, the reference energy state (bulk) has a different chemical composition than the doped GB, supporting a thermodynamic description of such a condition. Moreover, against the argument that a zero-energy GB would mean an energetically favorable grain-slipping, note that this specificity of the GB chemistry also disables any ‘spontaneous’ interface formation even if the GB energy was zero or even slightly negative. While this equation has been initially developed for binary metal systems based on Gibbs adsorption isotherm, similar equations have been derived for ternary alloys, with the interaction between elements playing a role in the respective enthalpy of segregations.
Reference Lejček, Zheng, Hofmann and Šob16,Reference Es-Souni17
$X_{\rm{B}}^{{\rm{bulk}}}$
is the solute content in the bulk. Equation (1) suggests that solute segregation decreases GB energy and may consequently decrease grain growth.
Reference Millett, Selvam and Saxena10–Reference Castro14
Moreover, it suggests that dopants with high energy of segregation can eventually zero the GB energy.
Reference Kirchheim8,Reference Liu and Kirchheim15
While this concept may sound unreasonable because interfaces are inherently excess energies to a system, this is justifiable by considering the direct dependence of the zero GB energy state on the solute segregation. In other words, the reference energy state (bulk) has a different chemical composition than the doped GB, supporting a thermodynamic description of such a condition. Moreover, against the argument that a zero-energy GB would mean an energetically favorable grain-slipping, note that this specificity of the GB chemistry also disables any ‘spontaneous’ interface formation even if the GB energy was zero or even slightly negative. While this equation has been initially developed for binary metal systems based on Gibbs adsorption isotherm, similar equations have been derived for ternary alloys, with the interaction between elements playing a role in the respective enthalpy of segregations.
Reference Lejček, Zheng, Hofmann and Šob16,Reference Es-Souni17
Achieving a zero energy GB state is however limited by the saturation of the GB. According to Eq. (1), a critical excess must be reached (depending on the enthalpy of segregation), but if this critical value is above the saturation limit of the GB in terms of dopant allocation, the state can never be reached and the system is more likely to nucleate a second phase at the boundary region. Therefore, the existence of a zero energy state for the GB has not been experimentally demonstrated so far. Some works have made use of this concept to design coarsening resistant nanocrystalline materials. For instance, Chookajorn et al. have designed metastable nanocrystalline W–Ti with the premise that Ti would segregate to the grain boundaries of tungsten and cause a decrease in the GB energies. Reference Chookajorn, Murdoch and Schuh12 While segregation was clearly demonstrated, with a significant inhibition of grain coarsening, a direct demonstration of the GB energy decrease was not be provided. A decrease in GB energy with segregated dopant was demonstrated in Pd–Zr alloys. Reference Kirchheim8 In that work, it was shown that as the grains grow, if the amount of segregated dopant is kept constant, the GB energy decreases as a function of grain size. This condition has been theoretically predicted Reference Kirchheim8,Reference Liu and Kirchheim15,Reference Gong, Liu and Zhang18,Reference Gong, Liu, Castro and van Benthem19 but direct evidence of a zero-energy state is still lacking. Reference Dey, Chang, Gong, Liu and Castro20
The challenge in demonstrating the existence of a zero-energy state comes from the fact that GB energies are inherently very small. Reference Dey, Chang, Gong, Liu and Castro20 However, recent developments in ultrasensitive microcalorimetric techniques enable the possibility of a direct assessment of average GB energies. Reference Castro14,Reference Dey, Chang, Gong, Liu and Castro20,Reference Castro and Gouvêa21 One of the most promising approaches is to measure the heat of grain growth of dense nanocrystalline samples using a differential scanning calorimeter (DSC). Reference Quach and Castro22 Grain growth is an exothermic phenomenon with heat release proportional to the GB area elimination. Hence, if the sample is prepared to avoid parallel heat sources during the study, such as reactions of contaminants, stress-related energies, and redox reactions, Reference Quach and Castro22 the measured integral heat of grain growth can be singly attributed to the GB area change, thus allowing for GB energy assessment. Three main limitations apply to this method: (i) the measured values are always an average of all the GB energies of the sample in the studied temperature (and grain size) range; (ii) in doped systems, the GB energy is an average with respect to dopant segregation as well, i.e., the GBs of the coarsened sample after a DSC experiment show higher dopant excesses compared to the sample before DSC. This is because the available area for dopant allocation is decreased, ergo leading to lower energies [Eq. (1)]. (iii) Obviously if the GB energy is indeed zero, no heat effect is expected.
The goal of this work is to demonstrate that gadolinium can induce a quasi-zero GB energy state in yttria-stabilized cubic zirconia (YSZ), thus being responsible for annihilating the driving force for grain growth. To this purpose, a systematic calorimetric study on the evolution of GB energies of YSZ doped with gadolinium as a function of grain size is presented. Although this is a ternary oxide system, yttrium is well-known to form stable solid solutions with zirconia, hypothetically allowing gadolinium, with a larger ionic radius, to segregate to grain boundaries and cause GB energy reduction, similar to lanthanum. Reference Dey, Chang, Gong, Liu and Castro20 A strategy was developed to assess the GB energies at a given temperature, in contrast to average values (referent to a temperature range) typically reported from DSC experiments, Reference Castro14 and indeed demonstrated a systematic decrease in GB energy with increasing grain size for a given temperature in the doped sample. Grain growth behavior was studied and revealed grain size leveling at a critical size where the quasi-zero GB energy state is met.
A. Experimental procedures
1. Sample preparation
Gd-doped and undoped YSZ nanoparticles were synthesized by reverse strike co-precipitation. Zirconium nitrate hydrate [ZrO(NO3)3·xH2O] (Aldrich, 99%, St. Louis, MO), yttrium nitrate hexahydrate [Y(NO3)3·6H2O] (Aldrich, 99.999%, St. Louis, MO) and gadolinium nitrate hexahydrate [Gd(NO3)3·6H2O] (Aldrich, 99.999%, St. Louis, MO) were used as the metal precursors. 12 mol% Y2O3 was added to stabilize the cubic polymorph (12YSZ). For the Gd-doped sample, Gd nitrate was added to achieve 4 mol% Gd2O3, while the Y2O3 content was decreased to 8 mol% to maintain the concentration of trivalent dopants in both Gd-doped and Gd-free YSZ. Nitrates were dissolved in distilled water (0.3 M) and added drop wise in a 1.0 M ammonium hydroxide (NH4OH) solution. The hydroxide precipitates were separated by centrifuging and dried overnight at 100 °C and further calcined at 450 °C for 2 h under oxidizing atmosphere to form the oxide phase. The calcination temperature was determined by heating the hydroxides in DSC equipped with thermogravimetric analysis (DSC/TG, SETSYS 1750 Evolution, Setaram, France) up to 1200 °C.
The chemical composition of 12YSZ and Gd-doped YSZ powders were determined by x-ray Fluorescence spectroscopy (Rigaku, Supermini200 Sequential WD-XRF, Tokyo, Japan). Phase purity and crystallinity were evaluated by x-ray diffraction (XRD) technique (Bruker AXS Inc., Madison, WI, model D8 Advance; Cu Kα Radiation λ= 1.5418 Å under 40 kV and 40 mA). The crystallite size was calculated from peak broadening applying whole profile fitting using JADE 6.1 (MDI) software. All grain sizes larger than 20 nm were also analyzed using scanning electron microscopy (SEM), as detailed below. Lattice parameter was determined from XRD by mixing YSZ samples with an internal standard lanthanum boride (LaB6) of known lattice parameter.
The calcined powders were sintered into dense pellets (5 mm diameter) using Spark Plasma Sintering technique (Syntex, model 825S, Tokyo, Japan) at 950 °C for 5 min with 600 MPa pressure under vacuum. A graphite die with a silicon carbide inset was used to allow high pressures, as detailed elsewhere. Reference Munir, Quach and Ohyanagi23 Samples were polished and re-oxidized at 750 °C for 5 h to remove any carbon contaminants and allow stress relaxation from the pressure assisted consolidation. The relative density for all the pellets ranged from 95 to 96% of theoretical density as measured with the Archimedes method. Samples with different initial grain sizes were used to study the role of GB area on the GB energy. To obtain different grain sizes, the as-sintered pellets were hosted in a tube furnace (in air) at 1100 °C for 10 min, 30 min, 2, 4, 8, 16, and 24 h.
2. Calorimetric measurement and grain growth study
Differential scanning calorimeter (DSC 404 F1 Pegasus, Netzsch Instruments, Selb, Germany) was used in the GB energy studies. Pellets were heated up to 1300 °C in high purity argon atmosphere at a rate of 20 °C/min with 30 min. Dwelling time and the heat evolved was correlated with the microstructural evolution.
Reference Castro14,Reference Quach and Castro22,Reference Castro, Torres, Pereira and Gouvea24
Because no phase separation occurred, or parallel reactions, the released heat was attributed to the change in GB area during the characteristic exothermic peak. GB areas (GBA) were calculated using a tetrakaidecahedral grain shape and a grain size distribution determined by SEM
Reference Quach and Castro22,Reference Gottstein and Shvindlerman25,Reference Wu, Dey, Gong, Liu and Castro26
using the equation ${\rm{GBA}} = {S \over {\bar d}}{V_{\rm{M}}}{\rm{ex}}{{\rm{p}}^{\left[ { - 2.5{{\left( {{\rm{ln}}\sigma } \right)}^2}} \right]}}$
, where, V
M is the molar volume,
${\rm{GBA}} = {S \over {\bar d}}{V_{\rm{M}}}{\rm{ex}}{{\rm{p}}^{\left[ { - 2.5{{\left( {{\rm{ln}}\sigma } \right)}^2}} \right]}}$
, where, V
M is the molar volume, $\bar d$
is the average grain size, and the exponential term accounts for the grain size distribution with a standard deviation ln σ, and S is a shape factor (3.55). Grain size distribution was assumed the same before and after the DSC run, which is consistent with SEM observations.
$\bar d$
is the average grain size, and the exponential term accounts for the grain size distribution with a standard deviation ln σ, and S is a shape factor (3.55). Grain size distribution was assumed the same before and after the DSC run, which is consistent with SEM observations.
Each sample was subjected to three subsequential heating–cooling cycles inside the DSC, the result of the second was used as a baseline (confirmed by the third run which gave the same result) to correct the first. Because all coarsenings are expected to occur in the first run, the baseline subtraction highlights grain growth energetics by correcting for the respective specific heat effect. In this process, it is assumed that the specific heat of the nanograined samples (before coarsening) is the same of a micrograined sample (post-coarsening). This assumption may lead to fluctuations in the corrected DSC curves but shall not compromise the grain growth integral heat. Details on the procedure can be found elsewhere. Reference Quach and Castro22
The grain growth behavior of Gd-doped YSZ and Gd free YSZ were studied by heating pellets at 1100 and 1300 °C for 10 min up to 16 h using a tubular furnace in air. Samples were inserted directly in the isothermal region of the furnace from room temperature (no ramping), resulting in heating rates calculated in ∼500 °C/min (typical of fast firing). Reference Hotza, García and Castro27
Microstructures of all the samples were characterized by SEM using a FEI 430NanoSEM, FEI Company, Hillsboro, OR, and the grain sizes were measured using ImageJ software.
II. RESULTS AND DISCUSSION
1. Zero GB energy measurements
Rare earths have been proposed as candidate dopants to segregate to the GBs of ceramics and increase the local bonding strength. Reference Buban, Matsunaga, Chen, Shibata, Ching, Yamamoto and Ikuhara28 This is attributed to their electronic distribution satisfying bonds and coordination of ions in the crystalline structure, which is translated into a lowering of the local excess energy (reducing GB energy). Therefore, Gd is expected to lower the GB energy of YSZ, similarly to La, Reference Dey, Chang, Gong, Liu and Castro20 and potentially provoke a zero-energy GB state in this system. To test this hypothesis, fixed concentration of Gd (4 mol%) doping was introduced in YSZ during powder synthesis, and dense nanocrystalline pellets produced with systematic increments in grain sizes. Assuming Gd has exothermic segregation energy, according to Eq. (1), a reduction of GB energy is predicted and linked to the grain size by the excess term, ГB.
Figure 1 shows SEM images of fractured surfaces of Gd-doped samples with grain sizes ranging from 18.1 to 43.5 nm. Although discerning the grains in those images is difficult because of the limited magnification, one observes high densities and microstructural homogeneity. All samples showed cubic fluorite structure with absence of second phases, as demonstrated by XRD patterns compiled in Fig. 1S (Supplemental Materials). The noted grain sizes are calculated by using whole profile fitting of the diffraction patterns and are consistent with SEM images inspection.

FIG. 1. SEM micrographs of 4 mol% Gd-doped YSZ samples before DSC. Samples were calcined at 1100 °C for different times to achieve increasing grain sizes. Annealing times were (a) 10 min, (b) 30 min, (c) 2 h, (d) 4 h, (e) 8 h, and (f) 16 h.
To measure the respective GB energies, each sample was subjected to DSC to provoke grain growth and quantify the released heat. Figure 2 shows the DSC heat signals for all samples. Characteristic exothermic peaks starting at about 1000 °C are observed for all samples and were attributed to grain growth. Reference Dey, Chang, Gong, Liu and Castro20,Reference Quach and Castro22 Thermogravimetric analyses using the same conditions showed no mass evolution at the studied temperature range, suggesting no parallel redox or decomposition reactions that could show heat effects in the DSC. Table 1S lists the grain sizes for the samples before and after the DSC peak measured using XRD whole profile fitting and SEM—larger samples were only tested with SEM since XRD peak fitting becomes unreliable for grains >100 nm. No grain growth was observed up to the start of the DSC peak, so the grain sizes for the samples before the peaks are similar to those of the as-prepared pellets. However, after the DSC peak, the grain sizes range from 252 to 312 nm, signifying very small GB areas. This demonstrates that the exothermic DSC peaks are indeed attributed to grain growth.
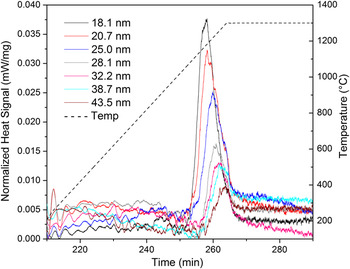
FIG. 2. DSC results showing exothermic peak related to grain growth for 4 mol% Gd doped YSZ. Legend indicates initial grain size, i.e. before the exothermic peak begins. Colored lines indicate respective sizes and show that increasing grain sizes causes a systematic decrease in peak height and area.
A systematic reduction in the exothermic effect is observed with increasing grain size, as expected from the lesser amount of GB area with increasing initial grain size. The curves also show shifting of the peaks toward higher temperatures with increasing initial grain size. This postponing of the growth onset may suggest that segregated Gd is pinning movement of GBs, consequently increasing activation energy. Reference Michels, Krill, Ehrhardt, Birringer and Wu7 On the other hand, the peak shift is accompanied by a decrease in heat of growth, suggesting a decrease in driving force for coarsening as well. Reference Liu and Kirchheim2
Integrals of heat effects are shown in Table I for each initial grain size. By comparing the microstructure before and after the exothermic peaks in Fig. 2, one may calculate the GB energies by attributing the integral heat to the respective GB area change (GB area after DSC peak minus GB area before the DSC peak). GB areas were calculated using a tetrakaidecahedral grain shape and a grain size distribution determined by SEM, as shown in Fig. 2S (normal distribution). To assure the heat-effects can be singly attributed to the GB area change and no energetic contributions from second phase nucleation exist, XRD patterns were taken from the samples after the DSC experiments. Figure 3S compiles the patterns that show only the YSZ fluorite peaks, with the absence of other crystalline structures, for all samples. Finally, since the energetic contribution from surface energies (pores) is negligible for highly dense samples, Reference Dey, Chang, Gong, Liu and Castro20 the heat release during DSC (ΔH) can be directly associated to the microstructural evolution with the equation:
 $$\Delta H = {\rm{GB}}{{\rm{A}}_{{\rm{nano}}}} \cdot \gamma _{{\rm{gb}}}^{{\rm{nano}}} - {\rm{GB}}{{\rm{A}}_{{\rm{coarse}}}} \cdot \gamma _{{\rm{gb}}}^{{\rm{coarse}}}\quad .$$
TABLE I. Initial grain size and annealing conditions for samples prepared for DSC analysis. The variation of the GB area during the grain growth in DSC (ΔGBA) and the respective integral of the evolved exothermic heat (heat effect) are also listed along with the calculated average GB energies and absolute GB energies for all samples.

Here, GBAnano and GBAcoarse are the GB areas at the beginning and the end of grain growth, and $\gamma _{{\rm{gb}}}^{{\rm{nano}}}$
and
$\gamma _{{\rm{gb}}}^{{\rm{nano}}}$
and $\gamma _{{\rm{gb}}}^{{\rm{coarse}}}$
are GB energies at the beginning and the end of grain growth, respectively. Because of the expected effect of dopant enrichment on the GB energy,
$\gamma _{{\rm{gb}}}^{{\rm{coarse}}}$
are GB energies at the beginning and the end of grain growth, respectively. Because of the expected effect of dopant enrichment on the GB energy, $\gamma _{gb}^{{\rm{nano}}}$
should be higher than
$\gamma _{gb}^{{\rm{nano}}}$
should be higher than $\gamma _{{\rm{gb}}}^{{\rm{coarse}}}$
. However, it is not obvious to quantify the effect of dopant enrichment on the GB energy without significant assumptions about segregation profiles,
Reference Dey, Chang, Gong, Liu and Castro20
which lead to uncertainties in simulated data. Therefore, we start simplifying the problem by assuming an average value for the GB energy in the grain size and temperature range. Therefore, the effective GB area change (GBAnano − GBAcoarse) listed in Table I can be used to calculate an average GB energy for each sample. The respective average GB energies as a function of initial grain size are plotted in Fig. 3. Note that the average GB energy decreases systematically with the grain size. In doing a fitting using a modified Eq. (1) (by including a dependence of the excess term on the grain size, as previously proposed
Reference Castro14
), a plateau is observed after 50 nm, where the GB energy should not significantly change and has achieved a minimum. While this is already evidence of the existence of the quasi-zero GB energy state, this is still an average energy value. To calculate the absolute (at a given temperature and grain size) GB energies for each initial grain size, one may use the fact that for larger grains, the difference between
$\gamma _{{\rm{gb}}}^{{\rm{coarse}}}$
. However, it is not obvious to quantify the effect of dopant enrichment on the GB energy without significant assumptions about segregation profiles,
Reference Dey, Chang, Gong, Liu and Castro20
which lead to uncertainties in simulated data. Therefore, we start simplifying the problem by assuming an average value for the GB energy in the grain size and temperature range. Therefore, the effective GB area change (GBAnano − GBAcoarse) listed in Table I can be used to calculate an average GB energy for each sample. The respective average GB energies as a function of initial grain size are plotted in Fig. 3. Note that the average GB energy decreases systematically with the grain size. In doing a fitting using a modified Eq. (1) (by including a dependence of the excess term on the grain size, as previously proposed
Reference Castro14
), a plateau is observed after 50 nm, where the GB energy should not significantly change and has achieved a minimum. While this is already evidence of the existence of the quasi-zero GB energy state, this is still an average energy value. To calculate the absolute (at a given temperature and grain size) GB energies for each initial grain size, one may use the fact that for larger grains, the difference between $\gamma _{{\rm{gb}}}^{{\rm{nano}}}$
and
$\gamma _{{\rm{gb}}}^{{\rm{nano}}}$
and $\gamma _{{\rm{gb}}}^{{\rm{coarse}}}$
is negligible (in vision of the achieved plateau), and so one may assume that the GB energy for a “large grain” is the same as the extrapolated value of the fitting, i.e., 0.025 J/m2.
$\gamma _{{\rm{gb}}}^{{\rm{coarse}}}$
is negligible (in vision of the achieved plateau), and so one may assume that the GB energy for a “large grain” is the same as the extrapolated value of the fitting, i.e., 0.025 J/m2.
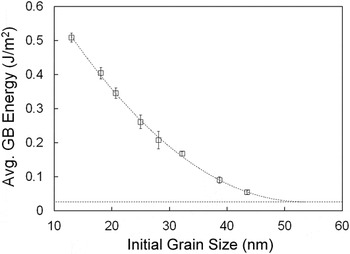
FIG. 3. Average GB energy measured by DSC on samples of 4 mol% Gd-doped YSZ with different grain sizes. Leveling of the curve at grain sizes above 50 nm is predicted by fitting. Error bars are small and sometimes within the marker dimension.
By plugging this GB energy value as the data point for after grain growth (after the DSC peak) in Eq. (2), it is possible to calculate the absolute GB energies for Gd-doped YSZ with the different grain sizes. Table I shows the values of absolute GB energies corresponding to the sample state before coarsening starts. It is found that at larger grain sizes, the GB energy is indeed very close to zero, ∼0.05 J/m2, consistently with GB enrichment following Eq. (1). Although it would be interesting to continue the calorimetric experiment with even larger initial grain sizes to attempt reaching out the zero energy state, it is practically impossible from a calorimetric point of view since heat signals would be too small in the DSC, and the error in the measurement would become more prominent due to large noise-to-signal ratio.
2. Consequences of the zero-energy GB state to grain growth
According to the hypothesis, the reduced GB energy should significantly retard grain growth of YSZ. To experimentally demonstrate this effect, YSZ pellets (Gd-doped and Gd-free) were subjected to annealing at 1100 °C for several time periods. The plots of grain size as a function of time are shown in Fig. 4(a). From this figure, it is evident that dopant addition significantly reduces grain growth. The grain size for Gd-doped YSZ almost stopped after 16 h (at 54 nm), while the grains of Gd-free YSZ sample continued to grow (140 nm after 16 h and with a steep growth slope at that point). It is imperative to note that the Gd-doped sample stopped growth at roughly the grain size where the GB energy was determined to be effectively zero (see Table I). To confirm that grain growth in doped YSZ is not retarded by second phases causing pinning effects, XRD was performed to analyze the phases present Gd-doped YSZ. No phase other than the characteristic fluorite structure was detected for all annealing times (Fig. 4S). The data also suggests that although the curvature potential as driving force for grain growth is present in all samples, because this potential is multiplied by the GB energy, Reference Castro, Castro and van Benthem29,Reference Kang30 its role is negligible in the Gd-doped growth behavior, but is still present in the Gd free YSZ, where growth persists even after 16 h.
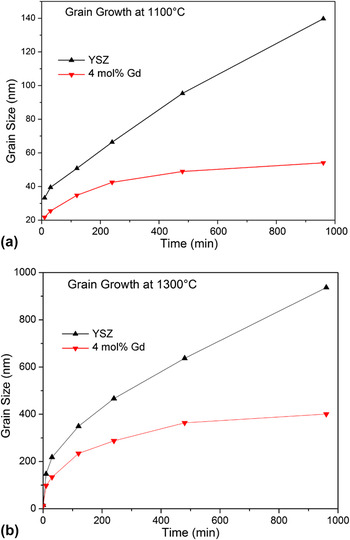
FIG. 4. Grain growth behavior of YSZ and 4 mol% Gd doped YSZ at (a) 1100 °C (b) 1300 °C. Plateau is observed in both temperatures for Gd-doped samples, in contrast to Gd free YSZ.
While this is a strong indication about the thermodynamic role of dopants in controlling coarsening, a question remains: if the GB energy is zero at ∼50 nm, why do grains can still grow at higher temperatures (as shown in the grain size values after the DSC experiment in Table 1S)? As mentioned before, the determined absolute GB energies are for the sample state exactly before the DSC peak, which is roughly at temperatures around 1100 °C. Therefore, a grain growth study at this particular temperature is directly governed by the presented thermodynamic data. If, however, the grain growth study is performed at a higher temperature, e.g., 1300 °C, dopant redistribution may lead to a distinct growth behavior. Figure 4(b) shows the respective curve, and indicates that the grain size of Gd-doped YSZ grows up to ∼400 nm after 16 h. There is however also a clear plateau which is not observed in the Gd-free YSZ. Similar to the 1100 °C growth study, a higher growing rate (with steep slope) of Gd-free YSZ is observed even after 16 h. It is hypothesized that, at higher temperatures, the solubility of Gd in the crystal bulk is increased, and the net concentration of Gd at the GB is effectively decreased. This results in a smaller effect on the GB energy [according to Eq. (1)] such that larger grain sizes are needed to achieve the same zero-GB energy state, as this is linked to a critical excess quantity.
This hypothesis could be tested by studying the lattice parameters of the Gd-doped YSZ annealed at 1100 and 1300 °C for 16 h as representative samples of the two observed plateaus in Fig. 4. In principle, an increase in solubility of Gd would lead to lattice expansion. According to the XRD patterns, for 1100 °C, the lattice parameter is found to be 5.1552 Å, while for 1300 °C it is 5.1580 Å. Nevertheless the 0.0028 Å difference is consistent with increased solubility of Gd in the crystal at higher temperatures, meaning decreasing dopant concentration at the GBs; this difference is close to estimations of the effect of the temperature itself on the lattice parameter (assuming YSZ alone) using thermal expansion coefficient (∼0.0020 Å). Reference Hayashi, Saitou, Maruyama, Inaba, Kawamura and Mori31 The low concentration of Gd used in this work prevents unequivocal conclusions using lattice parameters' analysis.
However, an analytical analysis of both states strongly supports the hypothesis: if the zero GB energy state is indeed met at both 1100 and 1300 °C, even though at distinct grain sizes, the term $RT\,{\rm{ln}}\,X_{\rm{B}}^{{\rm{bulk}}}$
in Eq. (1) shall be equal for the two temperatures when the grain sizes plateau. This can only mathematically happen if the solute concentration in solid solution at 1300 °C is smaller than at 1100 °C. Chen et al.
Reference Chen, Herz, Li, Borchers, Choi, Raabe and Kirchheim32
derived an implicit relation between grain diameter and temperature when at the zero-GB energy state condition:
$RT\,{\rm{ln}}\,X_{\rm{B}}^{{\rm{bulk}}}$
in Eq. (1) shall be equal for the two temperatures when the grain sizes plateau. This can only mathematically happen if the solute concentration in solid solution at 1300 °C is smaller than at 1100 °C. Chen et al.
Reference Chen, Herz, Li, Borchers, Choi, Raabe and Kirchheim32
derived an implicit relation between grain diameter and temperature when at the zero-GB energy state condition:
 $${\rm{ln}}\left[ {{{\rm{X}}_{{\rm{tot}}}} - {{3{\Gamma _{{\rm{sat}}}}{V_{\rm{M}}}} \over d}} \right] = {{{{{\gamma _0}} \over {{\Gamma _{{\rm{sat}}}}}} - \Delta {H_{{\rm{seg}}}}} \over {RT}}\quad .$$
Here, solute concentration (C tot, mol/m3) relates to molar volume, V M (m3/mol) such that X tot = C tot ·V M. Considering X tot = 0.04 (4 mol%) for the two different temperatures, Eq. (3) can be expressed as:
 $$R{T_1}\,{\rm{ln}}\left[ {{{\rm{X}}_{{\rm{tot}}}} - {{3{\Gamma _{{\rm{sat}}}}{V_{\rm{M}}}} \over {{d_1}}}} \right] = R{T_2}\,{\rm{ln}}\left[ {{{\rm{X}}_{{\rm{tot}}}} - {{3{\Gamma _{{\rm{sat}}}}{V_{\rm{M}}}} \over {{d_2}}}} \right]\quad .$$
Here, the subscript 1 and 2 relate, respectively, to the data for 1100 and 1300 °C. Moreover, d 1 = 55 nm and d 2 = 400 nm (defined as the plateaus from the experimental grain growth curves), and V M = 8.2898 × 10⁻⁵ m3/mol (calculated from the lattice parameter measured from XRD). By solving Eq. (4), the solute excess at the GBs at the zero-GB energy state (Гsat) was calculated as 3.75 × 10⁻⁶ mol/m2 or 4.51 × 10¹⁸ atoms/m2. Because YSZ was doped with 4 mol% Gd2O3, while converting atom/m2, the term was multiplied by a factor of 2.
Assuming Gd replaces Zr atoms and in the (100) plane of a fluorite structure, the Gd content is equivalent to ∼1.2 of a monolayer (roughly one monolayer, considering the approximations). This suggests that the GB is saturated with Gd in both temperatures when the grain sizes effectively level during grain growth, although the grain sizes are different. This saturation is linked to the zero-GB energy state, strongly supporting that the grain growth stopping is due to the lack for thermodynamic driving force.
Despite the self-consistency of the data, the leveling of grain growth behavior in the Gd-doped YSZ could also be potentially explained based on pinning effects. It has been reported that annealing doped ceramics at high temperatures can cause segregation of dopant to the external free surfaces, such as residual porosities. Reference Chaim, Brandon and Heuer33 Accumulation of dopants at free surfaces would cause segregation of second phases, inhibiting growth by GB movement pinning by creating a drag force. However, evidences of second phases were not found from XRD analyses of the studied samples nor in SEM images collected for all samples shown in Figs. 4(a) and 4(b). As an instance, the XRD pattern of the sample after 1300 °C grain growth for 16 h (the longest studied annealing time) is shown in Fig. 4S and is identical to the pattern for 12YSZ.
In truth, considering the limitations of the XRD analysis, only high resolution electron transmission microscopy could prove the absence of a second phase in this system. Although not presented here due to technical limitations; recently, Dey et al. Reference Dey, Chang, Gong, Liu and Castro20 have shown that, similar to Gd, La doping has a strong effect on the GB energy of YSZ, with a consequent grain growth inhibition. In that case, after extensive scanning transmission electron microscopy work, second phases were not observed even for samples annealed for up to 48 h. Reference Dey, Chang, Gong, Liu and Castro20 Considering the similarities of the two studies, as well as the self-consistency of the present thermodynamic analysis, it is reasonable to assume that second phases are not responsible for the coarsening inhibition in Gd-doped YSZ.
III. CONCLUSION
This works presents the first direct evidence of the existence of quasi-zero GB energies in doped ceramics. This was assessed by using strategic design of ultrasensitive microcalorimetry of grain growth. It was shown that the GB energy of Gd-doped YSZ reduces with increasing grain size as the result of GB enrichment by segregated dopants. The absolute GB energy reached effectively zero (∼0.05 J/m2) at grain sizes larger than 50 nm. A systematic grain growth study showed that indeed Gd-doped YSZ stops to grow when it reaches that particular grain size. The results indicate though that this quasi-zero energy state that terminates driving force for coarsening is temperature dependent. Thus, high temperatures can still induce coarsening because of an increase in solubility of the segregated dopant in the crystalline bulk. This in turns causes a net dopant concentration decrease at the GB. The technical difficulties in measuring GB energies of larger grains and at high temperatures currently impede a more comprehensive analysis of the temperature effect.
Supplementary Material
To view supplementary material for this article, please visit http://dx.doi.org/10.1557/jmr.2016.282.
ACKNOWLEDGMENT
This work was supported by the National Science Foundation grant DMR Ceramics 1055504.


 Open access