


INTRODUCTION
Socioeconomic status (SES) is an important predictor of disease. SES can be defined in different ways, but it is frequently measured based on individual- and community-level education, income, wealth, employment, and family background compared with other individuals or groups [Reference Oakes and Rossi1, Reference Shavers2]. Low SES is generally associated with greater morbidity and mortality [Reference Adler and Ostrove3]. For example, low SES is associated with greater susceptibility to, and worse outcomes when diagnosed with, chronic conditions such as diabetes, asthma, coronary artery disease, and certain malignancies and infectious diseases such as HIV, tuberculosis, and influenza [Reference Adler4–Reference Yousey-Hindes and Hadler11]. However, the relationship between SES and foodborne illness is less well understood [Reference Darcey and Quinlan12].
Foodborne illness is a major source of morbidity in developed countries. In the United States alone, there are an estimated 47·8 million cases annually [Reference Scallan13, Reference Scallan14]. This estimate includes illness due to 31 major foodborne pathogens as well as cases due to unknown or unidentified causes. In sum, there are over 250 infectious and non-infectious agents that may contaminate food and many recognized food vehicles. Adding to the complexity of foodborne illness, foods can become contaminated at multiple points along the food's journey from production to consumption. It is also possible that different SES groups of individuals have different exposures because of dietary differences, or because of differences in individual food safety behaviours [Reference Signs15]. For example, behavioural studies have noted that high SES groups are more likely to eat undercooked foods, such as raw oysters and rare beef [Reference Patil, Cates and Morales16], and low SES groups are less likely to have sufficiently cool refrigerators [Reference Johnson17]. However, these studies have failed to identify whether these differences are associated with differential rates of foodborne illness. A better understanding of the relationship between SES and foodborne illness is important for efficient public health policy and intervention targeting.
The purpose of this systematic review was to analyse the existing peer-reviewed research at the individual- and population-level associations between SES and laboratory-diagnosed cases of infection with pathogens commonly transmitted through food, including Campylobacter spp., Clostridium perfringens, shiga toxin- (or vero cytotoxin-) producing Escherichia coli (STEC/VTEC), Listeria, norovirus, non-typhoidal Salmonella spp., Shigella spp., Vibrio spp., and Yersinia enterocolitica.
METHODS
The review protocol has been registered in PROSPERO International Prospective Register of Systematic Reviews (crd.york.ac.uk/prospero/index.asp Identifier: CRD42013004359).
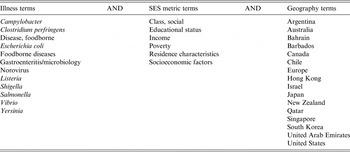
We searched PubMed/Medline for studies published between 1 January 1980 and 1 January 2013 using all combinations of the search and MeSH terms in the major categories (illness, SES metric, geography) outlined in Table 1. The objective of the search was to identify all papers examining the association between SES and infection with one of the nine pathogens of interest meeting our inclusion and exclusion criteria. The pathogens were selected because they were primarily foodborne (estimated >50% of cases transmitted through food) and cause significant morbidity (>50 000 estimated annual illnesses or >1000 estimated annual hospitalizations) [Reference Scallan14]. Our inclusion criteria were that studies were published in English, were conducted in one of the 47 countries classified by the United Nations in 2011 to have ‘Very High Human Development’ [Reference Klugman18], reported original data, included laboratory-confirmed cases of foodborne illness, and reported a quantitative measure of SES. We chose to limit the systematic review to highly developed countries because we assumed they would have comparable legal and commercial standards for food safety, better systems for disease surveillance and detection, and more comparable gradations of SES. Eligible measures of SES included both individual- and community-level measures of income and assets, poverty, educational status, utilization of social services, occupational status, and composite indexes of deprivation and disadvantage. We excluded studies reporting data from outbreaks and not written in English. This online search was followed by a review of eligible papers' bibliographies for eligible articles not included in the search terms.
Table 1. Schematic of MeSH terms used in PubMed search string to identify studies of foodborne illness and socioeconomic (SES) status
All titles were reviewed to include articles related to public health, foodborne illness, and SES. For those with appropriate titles, abstracts were reviewed. If the abstract appeared to meet inclusion/exclusion criteria, the full-text article was read until one or more exclusion criteria were found or until the end of the article, whichever occurred first. Papers that passed the selection process were then abstracted into a custom-made table that included categories for citation details, the study's location, design/approach, study period, data sources, SES variables, principal summary measures, results and P values, and other key findings. The paper selection and data extraction were conducted initially by K.L.N. then both were repeated by P.A.R. using the same methods. Any disagreements were resolved through review of the article in question and discussion among all authors.
We evaluated the risk of bias within studies using a version of the Cochrane Collaboration's tool for assessing risk of bias [Reference Higgins and Green19] modified to assess diverse study designs by grouping bias into the same general categories and using the same assessment criteria but adding subcategories specific to each study design. The studies were evaluated, as applicable, according to the potential for bias in the following domains: selection bias, measurement bias, analytical bias, and reporting bias. Case-control studies were evaluated based on selection of cases and controls; exposure, outcome, and confounder assessment; analysis; and reporting. Cohort studies were evaluated based on population sampling; exposure, outcome, and confounder assessment; follow-up; analysis; and reporting. Ecological studies were evaluated based on source population(s) selection; exposure, outcome, and confounder assessment; analysis; and reporting. Differences in study designs and in data sources precluded pooling the data for each pathogen and conducting a meta-analysis.
RESULTS
The initial search yielded a total of 143 articles (Fig. 1). After abstract and full-text review, the number was reduced to 12. From the bibliographies of these articles, four additional papers were identified, resulting in a total of 16 articles included in the systematic review. The most common reason for exclusion was due to the lack of a specific pathogen focus. Two were excluded because they were not in a target country [Reference Ellencweig and Slater20, Reference Achi, Mata and Lindberg21].
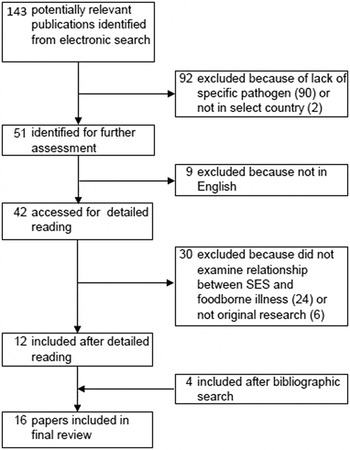
Fig. 1. Flow chart of study selection for systematic review. Boxes indicate number of papers under consideration after each step in paper identification process. Steps in paper selection leading to inclusion or exclusion are identified by arrows.
The most commonly studied pathogen was Campylobacter (n = 7), followed by non-typhoidal Salmonella (n = 6), STEC or VTEC (n = 5), and Listeria (n = 1) (Table 2, Supplementary Table S1). No articles were identified for C. perfringens, norovirus, Shigella spp., Vibrio spp., or Y. enterocolitica. Most studies were conducted in the United States (n = 4) and Great Britain (n = 3) (Supplementary Table S1). The most common study design used was ecological analysis (n = 11), followed by case-control (n = 3).
Table 2. Impact of socioeconomic status (SES) on incidence of pathogen-specific foodborne illness

* 2007–2009 for SES data.
Impact of SES by pathogen
Campylobacter
High SES was associated with a higher incidence of disease in six of the seven studies that examined the association between SES and laboratory-confirmed Campylobacter infections (Table 2, Supplementary Table S2). Of these, four examined the impact of SES using a composite deprivation index that incorporated area-level measures of variables such as car ownership, home ownership, and unemployment taken from national censuses [Reference Spencer22–Reference Green, Krause and Wylie25]. Of the remaining two studies, Simonsen et al. in Denmark found an increased incidence of campylobacteriosis in persons with higher income and higher educational level [Reference Simonsen, Frisch and Ethelberg26]. The other remaining study, Pyra et al., found that United States census tract-level median income greater than $20 101 annually, high educational attainment, and home ownership greater than 50% were associated with increased incidence of Campylobacter infection [Reference Pyra27]. The only equivocal study result was from Gillespie et al., who measured SES using occupation [Reference Gillespie28]. Gillespie found that although incidence was marginally higher in white-collar workers compared to blue-collar workers, semi-routine occupations (e.g. retail clerk, taxi driver, cosmetologist) had the highest incidence.
STEC/VTEC
Studies examining STEC (or VTEC), including STEC O157, reported inconsistent findings with regard to the impact of SES on disease incidence (Table 2, Supplementary Table S3). In the United States Chang et al. identified a positive association between STEC O157 disease incidence and higher levels of education and lower levels of poverty at the census tract level. In Japan Sakuma et al. identified an inverse relationship between average income and VTEC incidence [Reference Chang29, Reference Sakuma, Urashima and Okabe30]. Other studies failed to find any association or found conflicting results. Pearl et al. [Reference Pearl31] found no association between average income and rates of foodborne STEC O157 in Canada, similar to Simonsen et al. [Reference Simonsen, Frisch and Ethelberg26], who found no association between income and education and STEC in Denmark. In Finland, Jalava et al. found at the municipal level, an association between higher incidence of STEC O157 and higher levels of adult education [Reference Jalava32].
Listeria
Using surveillance data from England and Wales, Gillespie et al. identified a strong association between low SES and high incidence of listeriosis using an index of multiple deprivation that included income, crime and disorder, living environment, health deprivation and disability, and unemployment [Reference Gillespie33].
Salmonella
In general, studies found an increasing incidence of salmonellosis with increasing SES, although there are some exceptions (Table 2, Supplementary Table S4). Studies conducted in the United States by Chang et al. and Yonus et al. found associations between high SES and salmonellosis incidence [Reference Chang29, Reference Younus34]. Chang found low unemployment and high educational attainment were positively associated with incidence. Yonus also found a positive association with high educational attainment, as well as a positive association with high income. European studies by Bantvala et al. (UK) [Reference Banatvala35] and Simonsen et al. (Denmark) [Reference Simonsen, Frisch and Ethelberg26] also found positive associations between SES and salmonellosis incidence, but not for all species. Bantvala et al. found an association between high SES, as measured by the Townsend index of deprivation, and incidence of S. enteriditis but no association between SES and S. Typhimurium. Simonsen et al. also found increased incidence of S. enteriditis with high income, but they found an increased incidence of S. Typhimurium with low income and low educational attainment. Furthermore, Simonsen et al. found no association between SES and other Salmonella species.
One study of salmonellosis incidence and SES found an association with low SES, and one study reported null results. A 1996 case-control study conducted in Italy by Borgnolo et al. reported that children with non-typhoidal salmonellosis were more likely to have unemployed fathers and fathers who worked in non-blue-collar jobs than controls [Reference Borgnolo36]. A 2010 case-control study conducted in the United States by Yonus et al. found no association between SES and salmonellosis [Reference Younus37].
SES indicators
The SES variables used in the studies ranged from simple metrics, such as home ownership or education to indexes of deprivation, such as the Oxford Index of Multiple Deprivation and the New Zealand Deprivation Index (Table 3). The most commonly used measure of SES was income, which was included in the analyses of seven studies. Higher income was associated with increased incidence of Campylobacter (2/2 studies) and Salmonella (2/4 studies). However, two studies of Salmonella incidence [Reference Chang29, Reference Younus37] found no association by income. Studies of STEC/VTEC that measured income found mixed results – one study of VTEC incidence found increased incidence with lower income [Reference Sakuma, Urashima and Okabe30], one found increased STEC incidence with higher income [Reference Chang29], and two found no association between STEC incidence and income [Reference Simonsen, Frisch and Ethelberg26, Reference Pearl31].
Table 3. Type of association by socioeconomic status (SES) variable and pathogen type

* High index of deprivation indicates low SES.
† High employment or occupation indicates ‘white-collar’ worker categories.
‡ Simonsen et al. [Reference Simonsen, Frisch and Ethelberg26] showed an increase in incidence for adults with high SES and decrease in incidence for children with high SES.
Six studies analysed the relationship between incidence of pathogens and educational attainment. The results were mixed for all three pathogens studied. An increase of Campylobacter incidence was observed in adults with higher education [Reference Simonsen, Frisch and Ethelberg26, Reference Pyra27] but for children with higher levels of education, the incidence was lower, even after controlling for age [Reference Simonsen, Frisch and Ethelberg26]. STEC/VTEC incidence was higher in those with greater education in two Scandinavian studies [Reference Simonsen, Frisch and Ethelberg26, Reference Jalava32], but there was no association found in a study conducted in the United States in 2009 by Chang et al. [Reference Chang29]. There were also mixed results in the analyses of the impact of education on salmonellosis. A Danish study by Simonsen et al. found higher incidence in those with low education [Reference Achi, Mata and Lindberg21], two US studies found a lower incidence in those with low education [Reference Chang29, Reference Younus34], and one US study found no association between incidence and education [Reference Younus37].
The four studies of campylobacteriosis and one study of salmonellosis that used an index of deprivation to measure SES uniformly found an association between low levels of deprivation and high incidence [Reference Spencer22–25, Reference Banatvala35]. The one study of listeriosis that used an index of deprivation found an association between high levels of deprivation and high incidence [Reference Gillespie33].
Three studies measured the association between employment or occupation and disease incidence. A 2008 study by Gillespie et al. in England and Wales found a slightly higher incidence of campylobacteriosis for white-collar workers compared to blue-collar workers (relative risk 1·06, P = 0·01) [Reference Gillespie28]. A 2009 study by Chang et al. in the United States found no association between E. coli incidence and employment status [Reference Chang29]. The two studies that examined employment status and salmonellosis found divergent results [Reference Chang29, Reference Borgnolo36]. The US-based study reported a weak negative association between neighborhood unemployment and salmonellosis (R 2 = 0·0194) [Reference Chang29], and the Italy-based study reported a strong odds ratio (OR) for the association between paternal unemployment or blue-collar job and non-typhoidal childhood Salmonella (OR 2·56 for cases compared to inpatient controls) [Reference Borgnolo36].
Other SES variables that were used in the reviewed studies included home ownership and a collection of variables measuring the utilization of social services such as public daycare, school lunch programmes, and Medicare. Home ownership was associated with increased incidence of campylobacteriosis in a 2012 US study by Pyra et al. [Reference Pyra27]. Metrics of social service use were not associated with E. coli or Salmonella incidence in either study that considered them [Reference Chang29, Reference Jalava32].
Evaluation of bias
Using a modified version of the Cochrane Collaboration's tool for assessing risk of bias [Reference Higgins and Green19], we assessed half of the studies (n = 8) as having at least one domain in which they had a high likelihood of bias, and only one study [Reference Simonsen, Frisch and Ethelberg26] was rated as having no areas with more than a low likelihood of bias (data not shown). The domain most commonly evaluated as having a high likelihood of bias was in the evaluation of exposure (i.e. SES status). Eight of the ecological analysis studies were considered as having a high likelihood of bias in their evaluation of exposure [Reference Rind and Pearce23, Reference Nichols24, Reference Pyra27–31, Reference Younus34]. An additional three ecological studies and the three case-control studies were evaluated as having a moderate likelihood of bias in their evaluation of exposure [Reference Spencer22, Reference Green, Krause and Wylie25, Reference Gillespie33, Reference Banatvala35–Reference Younus37]. Ten of the ecological studies were evaluated as having a moderate likelihood of bias in their assessment of potential confounders [Reference Rind and Pearce23–Reference Green, Krause and Wylie25, Reference Pyra27–33, Reference Towns38].
DISCUSSION
Overall key findings
The goal of our systematic review was to compare existing quantitative research on the association between SES and foodborne illness at the individual and at the population level. We had three key findings. First, there was no uniform effect of SES on foodborne illness across all laboratory-confirmed pathogens. Second, within pathogen categories, there was some uniformity – high SES was associated with increased incidence of campylobacteriosis and salmonellosis in the majority of studies, but the effect of SES on STEC/VTEC incidence varied by study. Third, different SES metrics did not provide consistent results.
Contrary to the association commonly seen between low SES and worse health outcomes [Reference Adler4–Reference Yousey-Hindes and Hadler11], we found that in most of the reviewed studies of Campylobacter and Salmonella, low SES was associated with a lower burden of illness (Table 2) in countries classified by the United Nations in 2011 as having ‘Very High Human Development’ [Reference Klugman18]. Studies of STEC and VTEC incidence had mixed results, with some studies indicating that low SES was associated with lower incidence and others that it was associated with higher incidence (Table 2). The one study of Listeria incidence found higher rates of listeriosis among low SES groups (Table 2). In general, however, most studies identified in our initial database search did not consider the association between SES and disease incidence (Fig. 1). Furthermore, of the nine common foodborne pathogens included in our search string, only four of these pathogens had been studied with regard to SES.
The differences in results by pathogen are consistent with a diverse biology and risk factor profile for each bacterium. In considering questions of differential exposure, known individual-level risk factors for each pathogen suggest causes for observed differences in individual- and population-level incidence, although there may be additional population-level risk factors that account for the observed differences. High SES was associated with increased incidence of campylobacteriosis and salmonellosis (Table 2). Risk factors for Campylobacter include eating restaurant-prepared food, having contact with farm animals, drinking untreated surface water, eating undercooked food, and drinking raw milk [Reference Friedman39, Reference Danis40]. Many of these risk factors are associated with higher SES groups, including eating restaurant-prepared food, drinking raw milk, and consuming undercooked foods [Reference Patil, Cates and Morales16, Reference Lachat41–Reference Timbo47]. Risk factors for Salmonella include eating undercooked raw eggs, international travel, and eating in restaurants [Reference Domingues48]. As with risk factors for campylobacteriosis, these activities are more common in high SES groups. We found no consistent association between SES and STEC/VTEC incidence. Risk factors for STEC/VTEC include eating undercooked hamburgers, eating at non-fast-food chain restaurants, drinking untreated surface water, contact with small children, and contact with farm animals [Reference Voetsch49]. While undercooked beef and restaurant-prepared food consumption are more common in high SES groups, other STEC/VTEC risk factors are less clearly associated with any specific SES group, perhaps contributing to the mixed results reported in this review.
Low SES was associated with increased incidence of listeriosis [Reference Gillespie33]. Risk factors for Listeria include eating cold processed meats, unpasteurized milk products, and being immunosuppressed [Reference Swaminathan and Gerner-Smidt50]. Individuals of low SES are more likely to consume delicatessen meat and other cold processed meats, although they are less likely to consume raw milk [Reference Headrick42, Reference Darmon and Drewnowski51]. The finding of increased listeriosis in low SES groups may be driven by meat or unpasteurized cheese consumption patterns or may be through an increased immunological vulnerability, as seen in viral respiratory infection incidence [Reference Cohen52].
It is also important to recognize how population-level SES may be associated with different community risks for foodborne illness. Risk factors like surface water contamination, farm animals, and low availability of fresh, non-prepared food, such as in food desserts [Reference Quinlan53], can impact large groups of people through environmental risk rather than individual actions. The findings from ecological analyses, such as those included in this review, suggest that there may be risk factors working at an even larger scale [Reference Schwartz54], such as national food safety policies, the availability of publicly funded healthcare, and regional public health activities [Reference Darcey and Quinlan12]. For instance, pregnant and elderly individuals in low SES areas have less access to healthcare and therefore may receive less guidance about avoiding foods that can put them at risk for contracting listeriosis, thus possibly contributing to the increased risk of listeriosis in low SES groups [Reference Gillespie33]. Comparing associations between SES and foodborne illness rates between countries may also suggest population level risk factors. Studies conducted in Denmark and Canada found no association between income and E. coli infection [Reference Simonsen, Frisch and Ethelberg26, Reference Pearl31], but researchers in Japan and Finland found that higher income was associated with greater risk of E. coli [Reference Sakuma, Urashima and Okabe30, Reference Jalava32]. These differences may be the result of national differences in food safety regulations or enforcement rather than individual choice alone. However, further research is needed to be able to identify which policies may be at work. Overall, there is a need for investigation of the impact of population level, systematic determinants of foodborne illness.
Another possible reason for mixed results across pathogens is reporting bias. All included studies used laboratory-confirmed cases of illness, and all but one study relied upon national surveillance systems for case ascertainment [Reference Borgnolo36]. Because not all illnesses are diagnosed, surveillance systems for foodborne illness only capture a small fraction of the total number of cases of illness that occur [Reference Allos55]. Illnesses typically causing more mild symptoms may be under-reported, and different SES groups have different rates and patterns of healthcare utilization [Reference Kaptan and Fischhoff56]. A UK-based study found that individuals from a lower social class as well as individuals with a higher level of educational attainment were both more likely to present to a general practitioner for diarrhoea [Reference Tam, Rodrigues and O'Brien57]. In the United States, education is not associated with seeking medical care and submitting a stool sample, but health insurance is. Individuals with health insurance are three times as likely to submit a stool sample as individuals without health insurance [Reference Scallan58]. For Campylobacter, the estimated number of true cases is 30 times higher than the number reported to surveillance. For STEC, Listeria, and non-typhoidal Salmonella, the estimated number of actual cases are 26, 2, and 29 times higher, respectively, than the number reported to surveillance [Reference Scallan14].
To capture a broader population, some studies have investigated acute gastroenteritis diagnoses regardless of laboratory confirmation. However, studies of acute gastroenteritis have yielded inconclusive associations. A 1990 study by Alexander et al. found that children of lower SES groups, as measured by the Hollingshead index, were more likely to report having been sick with diarrhoea over the previous 2 weeks [Reference Alexander59]. However, a study from the same year of infants found no effect of SES as measured by the same index [Reference Rubin60]. More recent studies in Denmark and Australia found a significant association between low educational attainment and low income and increased incidence of acute gastroenteritis. The diagnosis of acute gastroenteritis is generally based on symptoms and does not require laboratory confirmation of a pathogen; therefore it is difficult to distinguish illnesses transmitted by food from other modes of transmission [Reference Ethelberg61, Reference Hall62].
Another possible approach to combat reporting bias would be to conduct a prospective cohort study where persons reporting a diarrhoeal illness were asked to submit a stool sample for testing. This would help to alleviate some of the bias associated with access to care.
We found no consistent effect across all pathogens for a single SES measure, either indicating weakness in the measure as an indicator of social class [Reference Braveman63] or reflecting differential effects of SES by pathogen type. The one exception to this was studies that used a deprivation index score to assess SES. All four studies of Campylobacter incidence that calculated a deprivation index found a direct association between high SES and high disease incidence [Reference Spencer22–Reference Green, Krause and Wylie25]. This consistency was remarkable because it also spanned studies conducted on three continents. As such, it suggests that indexes can be used as a more generalizable metric for international comparisons of foodborne illness in developed countries.
The challenge in assessing SES arises from the lack of a single metric and the variable interpretation of SES measures depending on other variables. Individual-level metrics like personal income, educational attainment, or home ownership can be useful for measuring SES, and they reduce the likelihood of misclassification of exposure. Yet, individual-level data can be difficult to collect and does not capture an individual's social milieu, which may be similarly important in determining health outcomes [Reference Ethelberg61, Reference Braveman63]. Therefore, many studies rely upon community-level metrics such as mean household income, mean adult educational attainment, or percentage of residents who own their home. These data are readily available at the census-tract level and has the additional advantage of indicating the social milieu in which an individual lives. However, there is heterogeneity within census tracts, which may have populations as large as a few thousand persons. Furthermore, capturing just an individual- or community-level measure of SES does not complete the picture. Social class is frequently relative and similar measures at different scales may measure different effects. For example, Pearl et al. and Chang et al. studied the association between STEC and SES as measured by income. Pearl et al. used each case's household income data, and Chang et al. used the percentage of households in a census tract that had incomes below the poverty line [Reference Chang29, Reference Pearl31]. Although both measured income, Pearl et al. found no association at the individual level between SES and STEC incidence, whereas Chang et al. found an increased incidence of STEC in census tracts with low levels of poverty. It is possible that these differences are the result of other variables, such as study location, time period, or size, but they point to the challenge of comparing within categories of SES metrics. Indexes benefit from having a rigorous, multifaceted approach to assessing SES that goes beyond just income or education and attempts to measure material need [Reference Morris and Carstairs64]. By combining multiple data sources, they reduce the impact of variability in each individual SES metric included in the calculation. Still, they face challenges in calibration and validation [Reference Morris and Carstairs64].
An additional challenge in measuring SES is establishing meaningful thresholds for categorization across different environments. For instance, a category for income may characterize a person as likely to be in a low SES group in an urban setting, but the same category may not correspond to persons of low SES in rural settings, where cost of living is lower. Reliance on a fixed cut-off may explain why Spencer et al. [22] observed an association between low SES and low campylobacteriosis incidence in urban areas in New Zealand but not in rural ones. However, another possibility that they suggest is that disadvantaged urban communities may have lower reporting levels, creating observed lower incidence as a surveillance artifact. This hypothesis has been supported by the work of Wheeler et al. in England [Reference Wheeler65]. Nevertheless, it is also possible that differential Campylobacter infection rates by SES in urban and rural areas are a byproduct of SES categorization or a true effect from different transmission pathways in the different environments.
Based on this systematic review of findings in high income countries, we can adapt and extend the model Jouve et al. presents to illustrate the mechanism behind differences in foodborne illness by SES (Fig. 2) [Reference Jouve, Aagaard-Hansen and Aidara-Kane66]. Structural determinants of health, in this case SES, lead to differential exposure and differential vulnerability. Exposure and vulnerability can interact, and both lead to differential incidence of foodborne illness. Exposure is a function of environmental and behavioural variables, whereas vulnerability is a function of environmental and physiological ones.

Fig. 2. Social determinants of foodborne disease, adapted from Jouve et al. [66].
Differences in food consumption patterns are driven by environmental and behavioural variables. Low SES individuals may have differential risk because of food availability. Fresh produce has increasingly been implicated as a cause of foodborne illness in the United States [Reference Painter67, Reference Lynch, Tauxe and Hedberg68] in addition to well-known sources like meat, poultry, eggs, and unpasteurized dairy [Reference Lynch69]. In low SES neighbourhoods, there may be less access to some of these products [Reference Walker, Keane and Burke70], particularly fruit and vegetables [Reference Moore and Diez Roux71]. This could create a protective effect because the reduced availability is not offset by a concurrent increase in the risk posed by available food sold in low SES areas [Reference Darcey and Quinlan12, Reference Signs15].
SES is also associated with food safety knowledge and food handling. Awareness of food safety labels regarding safe handling and preparation increases with education level [Reference Yang, Angulo and Altekruse72], and individuals with less than a high-school level education are less likely to have heard of Salmonella or Listeria contamination as problems [Reference Anderson, Verrill and Sahyoun44]. In addition, individuals with higher levels of education may be more willing to accept products that are modified to increase safety, such as irradiated beef [Reference Frenzen73]. However, low SES individuals are more likely to recognize that home food preparation can be a risky activity for foodborne disease, are more likely to think refrigerator temperature is important, and are more likely to have general knowledge about appropriate food-related hygiene [Reference Patil, Cates and Morales16, Reference Anderson, Verrill and Sahyoun44, Reference Fein45].
Although better knowledge of proper food storage and preparation is associated with reduced incidence of food-associated illness, knowledge of specific elements, such as safety labels, does not always correlate with behaviour [Reference Yang, Angulo and Altekruse72, Reference Kennedy74]. Low SES is correlated with safer food handling and preparation. Individuals in low SES groups, as defined by income and education, are less likely to eat risky foods and more likely to practice good cross-contamination prevention, hand washing, and food storage techniques habits [Reference Patil, Cates and Morales16, Reference Anderson, Verrill and Sahyoun44, Reference Li-Cohen and Bruhn75–Reference Funch7]. While the reason for this discrepancy has not been evaluated, one possibility is that individuals from lower SES groups may be more likely to work or have worked in food-preparation or other related industries in which they received specific hygiene instruction.
Strengths and limitations
Strengths of this study include adherence to the systematic review methodology, use of double data extraction, and availability of multiple studies for three of the four pathogens. Limitations include the predominance of ecological studies, difficulty in measuring SES, and reliance on laboratory-confirmed cases. There is a strong likelihood of bias within ecological analyses, which are generally considered less robust than case-control or cohort designs, when extrapolating to the individual-level. Because these analyses were not excluded from this review, it may have biased the results of our assessment when considering the ecological study results in light of known individual-level risk factors. However, ecological studies have the benefit of being able to suggest population-level factors that may cause disease, such as food, health, and social policies [Reference Schwartz54]. Publication bias may have also influenced our review, but for most studies we identified, SES was one of multiple exposures being analysed. Therefore, the decision to publish the results is less likely to have been influenced by the strength or direction of the association between SES and disease incidence. Last, another limitation is the exclusion of publications written in languages other than English (nine publications).
CONCLUSION
Foodborne illness a major contributor to morbidity in the developed world. High-risk groups vary by pathogen and for some pathogens risk of illness appears to be associated with SES. Improving understanding of the impact that SES has on the incidence of different foodborne infections is an important step towards efficient, targeted public health interventions to prevent unnecessary illness. However, major challenges for research on this topic include case ascertainment and measurement of SES status. Future areas of research include cohort and other robustly designed studies to better evaluate the impact of SES on foodborne illness and studying SES-targeted interventions to test their efficacy. At a time when foodborne illness is of increasing concern, understanding which populations are at greatest risk is critical for protecting individuals and their families.
SUPPLEMENTARY MATERIAL
For supplementary material accompanying this paper visit http://dx.doi.org/10.1017/S0950268814003847.
ACKNOWLEDGEMENTS
This work was partially supported by the F30 grant (K.L.N., grant 1F30DK100097-01), the ARCS Foundation (K.L.N), the National Institute of Allergy and Infectious Diseases at the National Institutes of Health (J.S.L., grant 1K01AI087724-01; P.A.R., grant T32AI074492), the National Institute of Food and Agriculture at the U.S. Department of Agriculture (J.S.L., grant 2010-85212-20608), and the Emory University Global Health Institute (J.S.L.). The contents of this paper are solely the responsibility of the authors and do not necessarily represent the official views of the National Institutes of Health or the U.S. Department of Agriculture.
This research received no specific grant from any funding agency, commercial or not-for-profit sectors.
DECLARATION OF INTEREST
None.


