INTRODUCTION
Globalization and population growth, in conjunction with intensified agricultural production has, and will, result in unprecedented human modification of ecosystems [Reference Ellis1]. The impacts of such large-scale biophysical changes will test the resilience of humans and the natural systems we rely on [Reference :2]. An increase in zoonoses emergence and resurgence is one of the consequences of rapid environmental change [Reference Jones3]. Over 60% of known infectious agents pathogenic to humans are zoonotic [Reference Taylor, Latham and Mark4], with over three quarters of recorded emerging infectious disease events originating in a non-human animal source [Reference Jones5].
Cryptosporidiosis and giardiasis are parasitic zoonoses that have been recognized by the World Health Organization as ‘Neglected Diseases’ [Reference Savioli, Smith and Thompson6]. They cause substantial morbidity in humans, especially in socioeconomically disadvantaged or immunocompromised populations. Giardia and Cryptosporidium spp. are the most frequently isolated enteric parasites of both humans and domestic animals [Reference Hunter and Thompson7], which is indicative of considerable zoonotic transmission. Despite their substantial health impact [Reference Kotloff8], and the potential for future environmental change to influence disease spread [Reference Lal9], little is known about the spatial and temporal patterns of these diseases. Identifying locations and time periods of increased risk would help identify the environmental and social determinants of disease incidence. This knowledge would improve the effectiveness of disease prevention and control programmes aimed at reducing disease burden.
In New Zealand, rates of zoonotic enteric disease in humans are among the highest reported for any developed country [Reference Baker, Sneyd and Wilson10, Reference Snel11] and are a major public health concern [Reference Lake12]. Cryptosporidiosis and giardiasis rates remain consistently high [Reference Snel11], suggestive of an incomplete understanding of pathogen ecology and transmission pathways. Identifying disease specific patterns remains a priority.
The Kulldorf space–time scan statistic is a simple and effective tool for preliminary analysis of disease clusters using routine disease surveillance data [Reference Kulldorff13]. It offers multiple advantages in that it identifies circular clusters of any size, situated anywhere within the study region, while adjusting for multiple hypothesis testing. This scan statistic determines which clusters warrant further investigation and those that are possibly random occurrences [Reference Kulldorff14]. It also identifies clusters that are not defined by administrative boundaries, minimizing pre-selection bias [Reference Kulldorff15]. Finally, it is theoretically straightforward with the software freely available, making it accessible to a wide range of users [Reference Robertson and Nelson16].
The aim of this study is to identify spatio-temporal foci in parasitic zoonoses incidence in New Zealand in order to generate hypotheses about transmission mechanisms. These pathogens are comparatively less well known in terms of infectious sources and transmission pathways. There is a need to identify populations that may be at increased risk of these diseases and generate testable hypotheses about the factors that may be driving differences in disease patterns.
METHODS
Disease data
All notified cases of cryptosporidiosis and giardiasis during 1997–2008 in New Zealand were obtained from the National Notifiable Disease Surveillance system (EpiSurv) which is operated by the Institute of Environmental Science and Research (ESR) for the NZ Ministry of Health. Hospital data for the same period were obtained from the National Minimum Dataset managed by the Ministry of Health. For notifications, cases were defined as a clinical illness with appropriate laboratory confirmation. Population denominator data and Census Area Unit (CAU) boundaries for the 2006 National Census were obtained from Statistics New Zealand. A CAU is a non-administrative, geographical unit defined by Statistics New Zealand, each of which comprises a population of 3000–5000 people. The centroid for each CAU was calculated using ArcGIS v. 10 [17]. Sporadic cases of cryptosporidiosis and giardiasis in New Zealand from 1 January 1997 to 31 December 2008 were included in the analysis. Cases identified as being part of a known outbreak were excluded. The report date of cases was used for this analysis. The total number of notifications and hospitalizations from 1997–2008 were plotted to visualize trends over time.
Analysis
Empirical Bayes smoothing
Disease rates from low-population areas can be unstable, resulting in large changes in estimated rates following the addition or subtraction of a few cases. Empirical Bayes smoothing stabilizes these rates using information from surrounding areas to adjust the estimated incidence. Smoothed estimates of average annual incidence rates per 100 000 population for cryptosporidiosis and giardiasis at the CAU level were calculated using the spatial dependence (SPDEP) package [Reference Bivand18] available in R software (version 2.15.1) [19].
Space–time clusters
A scan statistic was used to identify space–time clusters of cryptosporidiosis and giardiasis in New Zealand [Reference Kulldorff13, Reference Kulldorff15]. Specifically, cryptosporidiosis and giardiasis count data were examined for high disease rate clusters using a retrospective space–time permutation model to detect space–time clusters across three separate time periods. The analysis was carried out at the CAU level with aggregated, unadjusted count data.
In this method, a cylindrical window, with a circular base centred on each location (the radius varying from zero to a user pre-defined limit) and with height corresponding to time (adjusted from zero to a pre-determined maximum) was used to detect space–time clusters as the ‘centre’ of each window moves across the study area. As the window moves, for each location it also scans each possible time period, thus highlighting spatio-temporal clusters of possible cases. High risk clusters were detected by comparing the observed number of cases within the window to the expected number. Spatio-temporal clusters were therefore identified if a significant excess of cases had been observed in a geographical zone during a particular period. The default setting of no geographical overlap was used, so secondary clusters would not overlap the most significant cluster.
The Monte Carlo method was used to test the statistical significance of the detected clusters. A P value was obtained by ranking the likelihood of an observed cluster in a dataset over the maximum likelihoods acquired by generating 999 randomly produced datasets. The null hypothesis of no cluster was rejected when the simulated P value was ⩽0·1.
One of the limitations of SaTScan is that, over a long time period, clusters may be detected due to the effect of changes in population. The time period in this study was divided into three segments: (i) 1997–2000, (ii) 2001–2004, (iii) 2005–2008; under the assumption that the space–time clusters detected in such short time periods were more likely to be true clusters rather than the effect of changes in population. A maximum temporal cluster size of 60 days was chosen for this study as the objective was to identify relatively short periods of time that may indicate localized and/or seasonal exposure. For the same reason, 50 km was chosen as the radius of the cylindrical window used to scan across the study region.
The output from SaTScan was exported to ArcGIS v. 10.1 [17]. Due to the large number of clusters identified, for each time period, only statistically significant clusters at the 5% level were mapped.
Ethical standards
The authors assert that all procedures contributing to this work comply with the ethical standards of the relevant national and institutional committees on human experimentation and with the Helsinki Declaration of 1975, as revised in 2008. The authors assert that all procedures contributing to this work comply with the ethical standards of the relevant national and institutional guides on the care and use of laboratory animals.
RESULTS
Incidence and time trends
For both diseases, the number of notifications and hospitalizations showed a similar temporal pattern to each other over the 12-year period 1997–2008 (Fig. 1 a, b). Cryptosporidiosis notifications were highest in 2008 (1528 cases) with hospitalizations highest in 2001 (36 cases). Giardiasis hospitalizations peaked in 2006 with 33 cases while notifications showed a tendency to increase after 2006, although the highest number was recorded in 1998 (2183 cases).
Fig. 1. Number of notifications and hospitalizations in New Zealand, 1997–2008. - -◆- -, Notifications; –■–, hospitalizations; standard error bars shown. (a) Giardiasis (b) cryptosporidiosis.
Empirical Bayes smoothing
Smoothed annual average rates of giardiasis and cryptosporidiosis (1997–2008) are shown in Figure 2. For giardiasis, visual inspection of Figure 2 a indicates a relatively high incidence rate across the country with possible spatial clusters in the lower central portion of the South Island. For cryptosporidiosis, average annual incidence rates were more heterogeneous, with no obvious spatial clusters (Fig. 2 b).
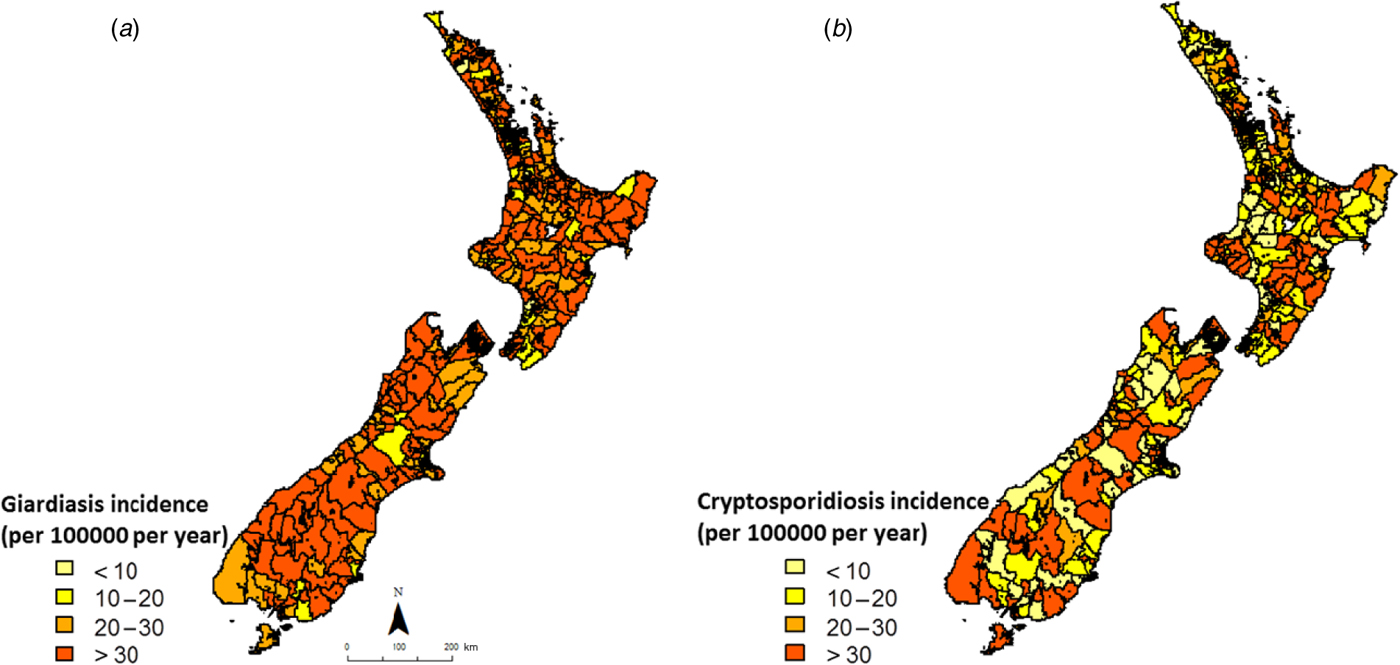
Fig. 2. Empirical Bayes smoothed incidence rates for (a) giardiasis and (b) cryptosporidiosis in New Zealand (1997–2008) at the Census Area Unit level.
Space–time clusters
The most likely cluster identified in each time period is indicated in red, while all identified clusters with a P value of <0·05 are denoted in orange (Figs 3, 4). For giardiasis (Fig. 3) the most likely cluster identified in 1997–2000 was in the Waihou Valley Hupara CAU in the upper North Island. A total of 30 significant (P < 0·05) clusters were identified during this time period. In 2001–2004 the most likely cluster was in the Eastbourne CAU in lower North Island. A total of 20 significant (P < 0·05) clusters were identified during this time period. In the 2005–2008 period, the most likely giardiasis cluster was in the upper South Island in the Nelson region. A total of 61 significant (P < 0·05) clusters were identified during this time period.
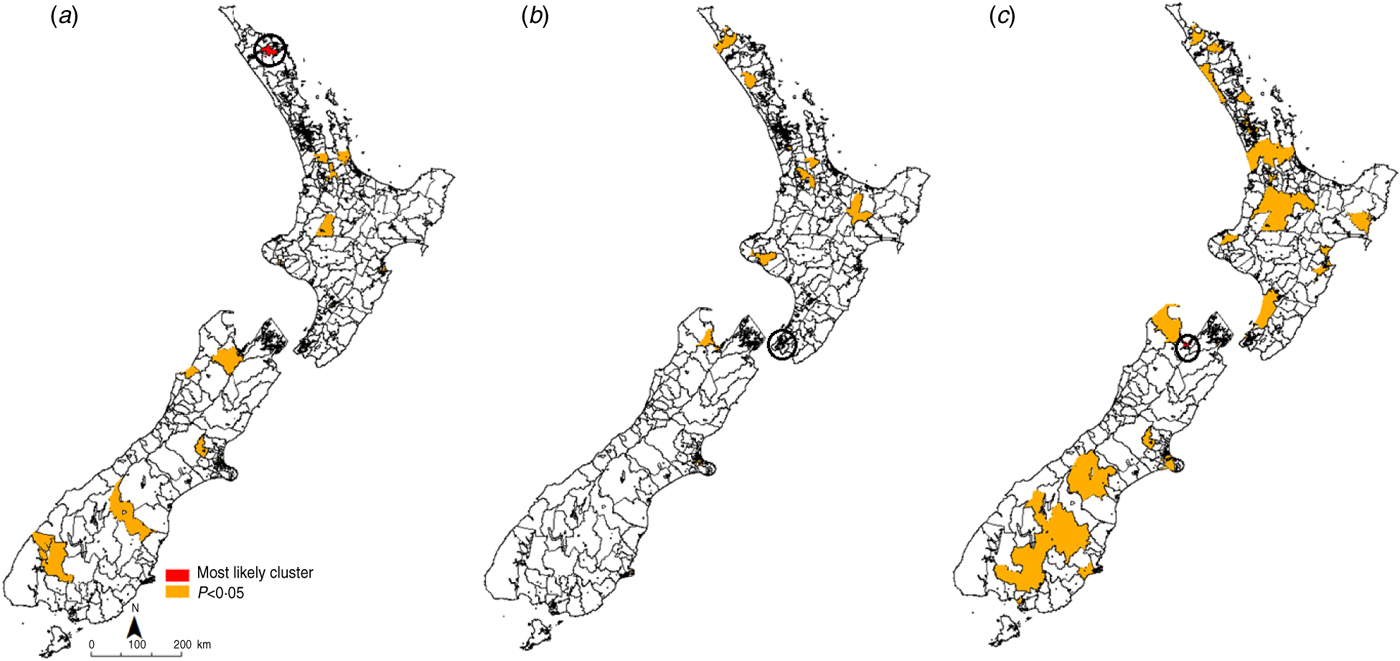
Fig. 3. Space–time clusters for giardiasis in New Zealand (1997–2008) at the Census Area Unit level as identified by the spatial scan statistic in SatScan v. 9·0. (a) 1997–2000, (b) 2001–2004, (c) 2005–2008.

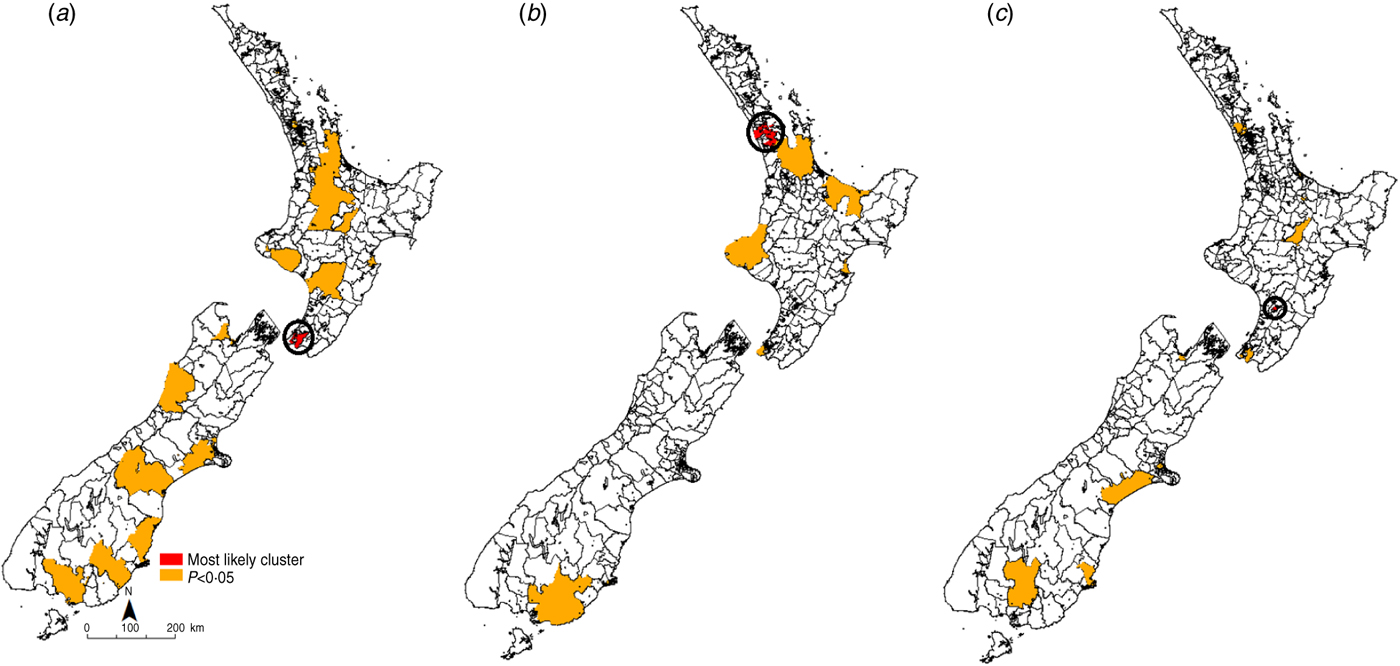
Fig. 4. Space–time clusters for cryptosporidiosis in New Zealand (1997–2008) at the Census Area Unit level as identified by the spatial scan statistic in SatScan v. 9·0. (a) 1997–2000, (b) 2001–2004, (c) 2005–2008.
Recurrent giardiasis clusters were detected in the northern half of the South Island in the Nelson/Golden Bay region. In 1997–2000 this cluster occurred between January and February 1997. In 2001–2004 this cluster occurred between July and August 2001. In 2005–2008 this cluster also covered the most likely cluster detected in Nelson (April–June2007) and occurred in August 2008.
For cryptosporidiosis (Fig. 4), the most likely cluster identified in 1997–2000 was in the Wellington region in the lower North Island. A total of 20 significant (P < 0·05) clusters were identified during this time period. In 2001–2004 the most likely cluster was in the Auckland region in central North Island. A total of eight significant (P < 0·05) clusters were identified during this time period. In the 2005–2008 period, the most likely cryptosporidiosis cluster was in the Palmerston North region. A total of 14 significant (P < 0·05) clusters were identified during this time.
Recurrent clusters were detected in the southern half of the South Island in the Southland region. In 1997–2000 the Southland cluster occurred between October and November 1998. In 2001–2004 the Southland cluster occurred in the same months. In 2005–2008 this cluster occurred between October and December 2008.
DISCUSSION
This is the first study to identify spatio-temporal clusters in cryptosporidiosis and giardiasis in New Zealand. While giardiasis clusters tended to recur in predominantly urban areas, repeated cryptosporidiosis clusters were identified in primarily agricultural, livestock-dominated areas. These findings highlight areas with unusually high incidence not previously identified as outbreaks.
Spatial patterns
The heterogeneity in cryptosporidiosis and giardiasis incidence at the CAU level provides a baseline pattern against which the location of space–time clusters may be compared. While giardiasis rates were particularly high in the lower half of the South Island, cryptosporidiosis rates were far more heterogeneous, suggesting site-specific environmental and population exposures.
Although these rates have been smoothed to stabilize high rates in sparsely populated areas, on their own they do not shed much light on possible risk factors as they are based on pre-decided, administrative boundaries. Nevertheless, in conjunction with space–time clusters they provide valuable information on the geographic variations in disease incidence.
Space–time clusters
Recurrent clusters of giardiasis were identified in the northern half of the South Island, in a primarily urban area. It is possible that, in this region, person-to-person transmission is dominant. Results of a case-control study in Auckland, New Zealand, indicated that toddler diaper changing is a significant risk factor [Reference Hoque20] with descriptive studies showing increased risk in the 30–39 years age group [Reference Snel11] and in nursing mothers [Reference Hoque21], which may be attributed to a closer association with young children. Indeed, attendance at daycare centres has been frequently cited as a common risk factor for Giardia infections in children [Reference Sagebiel22]. Although overseas travel has also been noted as an important risk factor for acquiring Giardia infections [Reference Swaminathan23], travel-related cases could not be distinguished in this study.
Given that the Nelson/Golden Bay region (upper half of the South island) is a popular recreational area, swimming in public pools and water bodies may be an important risk factor in this region [Reference Hoque20]. As Giardia spp. are easily transmitted through water [Reference Baldursson and Karanis24], waterborne transmission may play a role in the geographical structuring of incidence patterns.
In contrast, for cryptosporidiosis recurrent disease clusters were detected in the southern half of the South Island, an area of intensified livestock farming. Furthermore, these clusters showed a consistent seasonal spring peak. New-born livestock are a likely source of Cryptosporidium infection in humans in New Zealand [Reference Learmonth25–Reference Learmonth27]. The clear recurrent spring peaks in outbreaks in the Southland district imply a common environmental exposure. As pathogen shedding rates are maximum in young livestock [Reference Coklin28], and frequency of human contact with the animal reservoir is potentially highest at this time, there exist ample opportunities for zoonotic transmission.
Spring clusters could also be due to rainfall patterns as suggested by a study in North West England where in areas with marked seasonal patterns, peaks in spring rainfall preceded those in cryptosporidiosis [Reference Naumova29]. In the same geographical region, a significant association between maximum river flows and cryptosporidiosis cases in spring were found, suggesting that increased seasonal pathogen load coupled with heavy rainfall could result in seasonally high disease rates [Reference Lake30]. In New Zealand, increased contamination of water sources from livestock following extreme rainfall events has been documented [Reference Davies-Colley, Lydiard and Nagels31]. As groundwater contamination has been associated with increased risk of cryptosporidiosis [Reference Close32], it is possible that spring peaks in rainfall could result in contamination of the drinking water source. Recreational water contact has also been emphasized as a significant risk factor for cryptosporidiosis outbreaks [Reference Lake, Pearce and Savill33]. As water bodies in rural areas are also popular swimming spots, contact with contaminated surface water could result in higher disease rates. The clusters identified here support previous spatial analyses of cryptosporidiosis patterns in New Zealand, where disease incidence was strongly associated with rural areas and environmental factors [Reference Britton34].
Interestingly, the most likely clusters of cryptosporidiosis were detected in urban areas. Seasonal strain-specific Cryptosporidium transmission cycles implying zoonotic transmission in spring and anthroponotic transmission in autumn have been reported in New Zealand and the UK [Reference Learmonth25, Reference Chalmers35]. Cryptosporidiosis outbreaks in public swimming pools have been implicated in the autumn transmission of human strains [Reference McLauchlin36]. Although strain-specific information for human cases was not available for this study, the detection of likely clusters in urban areas with no seasonal pattern and recurrent clusters with spring peaks in areas which have recently intensified dairy farming is strongly suggestive of strain-specific transmission.
As has been widely documented, the limitations of using passive surveillance data to assess disease distribution include case ascertainment [Reference Lian37] and incorrect allocation of cases to geographical areas [Reference Skelly38]. For example, in this analysis, reporting location is based on home domicile address and may not be an accurate reflection of actual exposure due to commuting and travel patterns. However, such data deficiencies are likely to affect purely spatial analyses, as clusters in both space and time also require a temporal variation. Second, demographic differences were not considered in this analysis. Studies that include the effect of socio-economic and demographic variables could result in different clusters. However, the main aim of this paper was to identify locations and time periods of increased risk that may merit further investigation. Third, as a circular window was used to scan across the region for this analysis, it is possible that non-circular clusters, for example those along a river bank may have been missed. Such extensions may be of interest when investigating a specific hypothesis such as a point source of contamination in a catchment. It is also likely that using onset date rather than notification data would have improved results as onset date is closer to the time of acquiring the infection. However, for this study reporting date was used. Moreover, some of the identified clusters were fairly large, indicating a potentially inaccurate inclusion of some areas. However, specific CAUs showed clusters in more than one time period, suggesting that despite these shortcomings, SaTScan was useful for recognizing areas of repeated high incidence and providing a rationale for subsequent detailed analysis.
Implications for future research
Changes in climate and land use patterns have been implicated in the rising incidence of zoonotic diseases in humans [Reference Jones3]. Environmental changes can facilitate pathogen evolution and adaptation [Reference Jones3], can introduce previously unexposed populations to pathogens, thereby expanding host range [Reference Jones5], and provide better ecological conditions for pathogen transmission [Reference Jones3]. The recurrence of cryptosporidiosis clusters identified in primarily agricultural, livestock-dominated areas suggest that livestock production is an important determinant of environmental pathogen load. Synchronized agricultural practices such as calving may be a risk factor for human enteric infections at this time in dairying regions. While direct animal contact is a presumed risk factor, contact with contaminated rural or farming environments may be an equally important exposure. Detailed investigation of these areas may provide important insights into risk factors associated with living in proximity to livestock and identify interventions to reduce disease risk. Establishing the public health risk from zoonotic pathogens is important as recent statistics suggest that livestock intensification is expected to continue in New Zealand [39].
Although Giardia is regarded as a zoonotic parasite, this study found that giardiasis clusters tended to recur in predominantly urban areas with no distinct seasonal pattern. This finding is consistent with previous descriptive and epidemiological studies in New Zealand [Reference Snel11, Reference Hoque21]. These results allude to the importance of infection sources that are predominantly human, and that host behaviour rather than environmental factors are likely to drive infection patterns.
Overall, the dominant mechanisms and transmission pathways driving spatial and temporal variations in enteric, zoonotic protozoan disease risk in New Zealand appear to be quite distinct. Hotspots in disease incidence indicate that while regional environmental change can influence disease patterns, this effect is moderated by proximal population characteristics. The linkages between environmental and social factors in driving disease patterns as indicated by these results emphasize the need for a multidisciplinary approach in health research. Disciplinary isolation will limit our ability to assess the impacts of future anthropogenic environmental change on human health.
Reducing the impacts of global environmental change on health requires a detailed understanding of the factors that influence health. Climatic and agricultural land use variables and social and demographic factors interact in multiple ways and across spatial and temporal scales to influence disease outcomes. Understanding disease specific, geographical and seasonal variations is crucial to identifying the determinants of disease risk and subsequently developing targeted prevention and control strategies. This study provides an insight into how environmental and social factors may influence geographical and temporal patterns in neglected parasitic diseases.
The Oceania region bears a considerable burden of protozoan infections, particularly in socio-economically disadvantaged and marginalized communities [Reference Kline40]. In this study, we identified clusters in cryptosporidiosis and giardiasis cases. Spatio-temporal clusters were pathogen-specific and showed distinct geographical and seasonal variations, highlighting disease-specific potential environmental and social risk factors. Recurrent cryptosporidiosis clusters in spring in a region that has recently experienced dairying intensification suggest that livestock production practices are likely to be an important influence. In contrast, recurrent giardiasis clusters in predominantly urban areas with no apparent seasonal patterns is suggestive of person to person transmission. Exploratory tools such as SaTScan provide a resource efficient method for public health authorities to detect, prioritize and monitor high-risk areas. By combining GIS techniques and SaTScan statistics we visualized spatio-temporal patterns in disease risk and identified areas with unusually high case counts using routine surveillance data [Reference Lian37]. Future research aimed at elucidating the factors associated with parasitic zoonoses in New Zealand is necessary to identify populations at increased risk from the ecological disruptions expected with climate and land use change.
ACKNOWLEDGEMENTS
We thank Professor Nigel French and Professor Michael Baker for their comments on an initial draft. This work was supported by a University of Otago Postgraduate Research Scholarship.
DECLARATION OF INTEREST
None.