


INTRODUCTION
Google Flu Trends (GFT) estimates the proportion of physician visits related to influenza-like illness (ILI) based on the historical relationship between internet search queries using Google and traditional ILI surveillance data [Reference Ginsberg1]. In the United States, GFT estimates are posted online between 1 and 2 weeks before the Centers for Disease Control and Prevention (CDC) reports ILI surveillance data; therefore, GFT estimates offer the potential for early warning of increases in ILI [Reference Ginsberg1]. However, during the ‘moderately severe’ 2012–2013 influenza season in the United States [2], GFT estimates of the peak in ILI-related physician visits were much higher than those reported by CDC [Reference Butler3, Reference Olson4]. This inaccuracy has been hypothesized to be attributable to increases in influenza-related internet searches due to media attention [Reference Butler3] and changes to Google's search algorithm [Reference Lazer5] and has called into question the value of GFT estimates [Reference Olson4]. This inaccuracy led Google to revise their US GFT model in 2013 [Reference Stefansen6], following an initial revision in 2009 after failing to effectively detect the emergence of the first wave of the H1N1 pandemic in the United States [Reference Cook7]. Therefore, the utility of GFT estimates remains unclear.
Currently, GFT estimates are available for 29 countries, including Canada [8], are being used in ILI-related research [Reference Dugas9–Reference Nsoesie, Mararthe and Brownstein12], and have been investigated at national level in several countries including the United States [Reference Olson4, Reference Ortiz13], European countries [Reference Valdivia14, Reference Hulth and Rydevik15], and New Zealand [Reference Wilson16]. By contrast, only two studies have examined GFT in Canada, both on a provincial scale in Manitoba [Reference Malik17, Reference Thompson18]; no research, to our knowledge, has examined GFT on a national scale in this country. In Canada, GFT estimates target ILI consultation rates reported by the Public Health Agency of Canada (PHAC) [19] and, as with the US data, are available online 1–2 weeks before PHAC values are reported. Similar to the United States, the 2012–2013 influenza season in Canada started earlier and was more severe than previous seasons, with high ILI consultation rates and, in laboratory-confirmed influenza cases, a greater number of influenza-related hospitalizations and a higher number of mortalities [20]. Therefore, GFT estimates may have also overestimated ILI consultation rates reported by PHAC during this season. Understanding how GFT estimates compare to traditional ILI surveillance data will help determine their potential value for early warning of ILI increases in future influenza seasons in Canada.
GFT estimates are meant to target the percentage of sentinel physician visits that are related to ILI. However, we hypothesize that, in order to provide estimates that are useful for detecting epidemics of respiratory disease, digital surveillance data for ILI should represent variations in the proportion of laboratory tests positive for respiratory viruses (positivity), which is similar to previous research examining the usefulness of syndromic surveillance data [Reference van den Wijngaard21]. Others have examined how well GFT estimates correlate with respiratory pathogens, but have limited their analyses to laboratory-confirmed influenza [Reference Ortiz13, Reference Malik17, Reference Thompson18]. However, given that GFT is based upon internet search terms that are not specific to influenza [Reference Cook7], variations in GFT estimates may be explained by variations in positivity for a number of different respiratory viral pathogens that cause ILI-related symptoms, not only influenza.
Therefore, our objectives were to determine: (a) how well GFT estimates for Canada correlate with national ILI consultation rates from PHAC and (b) how well GFT estimates correspond nationally with positivity for influenza as well as for other respiratory pathogens that cause ILI-related symptoms and circulate during a similar period of time as influenza.
METHODS
We used data from GFT for Canada [8]; ILI-related sentinel surveillance data from the FluWatch programme [22]; and respiratory virus testing data from the Respiratory Virus Detection Surveillance System (RVDSS) [23]. GFT estimates the number of ‘ILI cases per 100 000 physician visits’ [19] from which we calculated the percentage (%GFT). From FluWatch reports we obtained the most recently updated weekly number of ILI-related consultations per 1000 patient visits (we estimated the value from the bar chart if an exact value was not provided or had obviously changed since last being reported), from which we calculated the percentage (%PHAC). Note that physician visits for the Territories and Prince Edward Island are included in FluWatch values, based on data from 32 sentinel providers [22]; however, as GFT does not provide separate estimates for these areas, they are not likely to be included within the national GFT estimates for Canada [8]. The current definition of ILI used by PHAC is as follows: ‘Acute onset of respiratory illness with fever and cough and with one or more of the following – sore throat, arthralgia, myalgia, or prostration which is likely due to influenza. In children under 5, gastrointestinal symptoms may also be present. In patients under 5 or 65 and older, fever may not be prominent’ [24]. From RVDSS, we examined positivity for four viruses with winter seasonality: influenza A, influenza B, respiratory syncytial virus (RSV), and human metapneumovirus (hMPV); and a group of respiratory viruses that is endemic throughout the year, i.e. rhinoviruses. Since most laboratories in Canada use tests that do not distinguish between rhinoviruses and enteroviruses, both of these viruses are likely represented in this time series, but we have used the term ‘rhinoviruses’ to reflect the way data are reported by PHAC.
We compared %GFT to %PHAC and to positivity for each pathogen based on peak timing and Spearman's correlation. We assessed correlation assuming no lead or lag times and we also tested (a) 1- and 2-week leads for each of %GFT and %PHAC ahead of the laboratory data and (b) ±1- and ±2-week lead and lag times between %GFT and %PHAC. We limited the assessments of (a) and (b) to weeks with values available for all the lead and lag times considered. We defined the main peak as the highest percentage of ILI-related visits or percentage of tests positive during the season; however, we also describe smaller, but comparably sized, peaks.
We examined data for week 35 of 2010–2011 until week 8 of 2013–2014 (29 August 2010–22 February 2014; 182 weeks). Although GFT estimates are available from 2003 onwards, we did not use these prior data because, in the United States, Google only began prospectively estimating ILI-related physician visits in 2008 [Reference Ginsberg1]; however, we cannot find specific information for Canada. We began our analysis with the 2010–2011 season to eliminate the 2009 H1N1 pandemic from our investigation. We did not require ethical approval because all data were publicly available. We conducted analyses in R v. 3.0.2 [25] and SAS v. 9.4 (SAS Institute Inc., USA).
RESULTS
The percentage of physician visits related to ILI reported by PHAC ranged from 0·26% to 6·71% (median 1·86%) and estimated by GFT ranged from 0·18% to 7·70% (median 1·62%). Overall, %PHAC values and %GFT estimates correlated strongly, ranging from ρ = 0·78 in 2013–2014 to ρ = 0·90 in 2010–2011 (Table 1), with slight increases when allowed to lag (Table 2); however, %PHAC varied more from week-to-week (Fig. 1). The lag between the two datasets differed by season, ranging from %GFT leading %PHAC by 2 weeks to %GFT lagging %PHAC by 1 week (Table 2). Each season, the magnitude of the main peak was greater for %PHAC than for %GFT except in 2012–2013 when the peak in %GFT was higher than the peak in %PHAC (7·70% vs. 6·71%) (Fig. 1). The timing of the peaks in %GFT and %PHAC were similar; however, in 2011–2012, the main peak in %GFT occurred in week 52 and the main peak in %PHAC occurred in week 10, although %GFT had a smaller peak during week 10 and %PHAC had several peaks of similar magnitude between week 52 and week 12 (Fig. 1, Table 1).
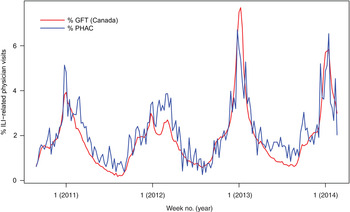
Fig. 1. Google Flu Trends (GFT) Canada estimates and influenza-like illness (ILI) consultation rates reported by the Public Health Agency of Canada (PHAC), 29 August 2010–22 February 2014.
Table 1. Correlation between Google Flu Trends Canada estimates, influenza-like illness consultation rates from PHAC, and positivity for respiratory viruses, unlagged, by season, Canada, 29 August 2010–22 February 2014
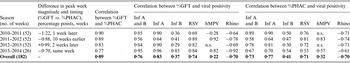
PHAC, Public Health Agency of Canada; GFT, Google Flu Trends; Inf, influenza; RSV, respiratory syncytial virus; hMPV, human metapneumovirus; Rhino, rhinovirus; n.s., not significant.
All correlations are statistically significant at P < 0·05 unless noted by n.s.
Table 2. Number of weeks and direction of lag times for Google Flu Trends estimates and influenza-like illness consultation rates from PHAC that had the strongest absolute correlation with each other and with positivity for respiratory viruses, by season, Canada, 29 August 2010–22 February 2014
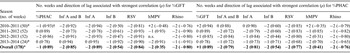
PHAC, Public Health Agency of Canada; GFT, Google Flu Trends; Inf, influenza; RSV, respiratory syncytial virus; hMPV, human metapneumovirus; Rhino, rhinovirus; n.s., not significant.
All correlations are statistically significant at P < 0·05 unless noted by n.s. (in which case, none of the correlations tested were statistically significant).
* We limited the calculations to the weeks with values available for all lead and lag times considered
† Interpretation: for 2010–2011, we observed the strongest absolute correlation between %GFT estimates that led %PHAC values by 1 week.
The correlation was strong between influenza A positivity and %GFT (ranging from ρ = 0·64 in 2011–2012 to ρ = 0·96 in 2013–2014) and was equal to or higher than the correlation between %PHAC and influenza A positivity (Table 1). In 2013–2014, we observed the lowest correlation between %GFT and %PHAC (ρ = 0·77); in this same season, we observed the highest correlation between %GFT and influenza A positivity (ρ = 0·96) and the lowest correlation between %PHAC and influenza A positivity (ρ = 0·70). For every season except 2013–2014, we observed slightly higher correlations between %GFT estimates from 2 weeks previous and influenza A positivity for the current week than between both measures for the same week (Table 2). In contrast to results for influenza A, overall, %GFT did not correlate as strongly with influenza B, ranging from ρ = 0·29 in 2012–2013 to ρ = 0·85 in 2013–2014 with no lag (Table 1), which increased somewhat when allowed to lag (Table 2).
The timing of the peak in %GFT occurred just after the peak in influenza A positivity each season except in 2011–2012 (Fig. 2a ). By contrast, in 2011–2012, %GFT showed two peaks, the first of which appeared to correspond well with the peaks in RSV positivity (week 52) and hMPV positivity (week 1), while the second appeared to correspond well with the peak in influenza A positivity (week 10; Fig. 2a ). In this season (2011–2012), the correlation between %GFT and RSV positivity was stronger than the correlation between %GFT and influenza A positivity (ρ = 0·89 vs. 0·64, Table 1). Similar results were observed for %PHAC (Fig. 2b , Table 1). At the beginning of each season (approximately weeks 35–44 or 48) we observed smaller peaks in %GFT that plateaued before the main %GFT peaks occurred. These peaks appear to correspond with increases in positivity for rhinoviruses (Fig. 2a ). However, the overall correlation between rhinovirus positivity and %GFT is negative (Tables 1 and 2). We observed similar results for rhinoviruses for %PHAC (Fig. 2b , Tables 1 and 2).
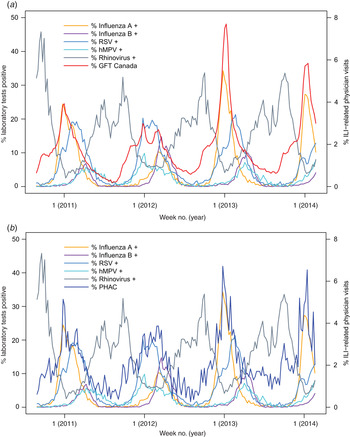
Fig. 2. Respiratory virus positivity compared to (a) Google Flu Trends (GFT) Canada estimates of influenza-like illness (ILI) (red) and (b) ILI consultation rates from the Public Health Agency of Canada (PHAC) (blue), 29 August 2010–22 February 2014. RSV, respiratory syncytial virus; hMPV, human metapneumovirus.
DISCUSSION
On a given week, a GFT estimate is available earlier than the corresponding traditional surveillance data from PHAC, which makes GFT an attractive potential addition to influenza and ILI surveillance. However, the usefulness of these estimates remains in question because their correspondence with traditional surveillance data has been inconsistent, especially in the United States. One of the first steps in determining the value of GFT estimates and understanding how best to use them is to examine how they correlate, and how they correspond in terms of peak magnitude and timing, with traditional surveillance data.
In Canada, %GFT represented %PHAC well over the four seasons examined. We observed more variability in %PHAC than %GFT; this variability is not surprising given the relatively small number of sentinel physicians (n = 416) reporting across the country [22]. Although the magnitude of the main peak in %PHAC was usually higher than that of %GFT, in 2012–2013, the peak in %GFT was higher and 2 weeks later than the peak in %PHAC. This suggests that, similar to hypotheses about GFT estimates in the United States [Reference Butler3], %GFT estimates in Canada may have been inflated due to media attention about influenza, which may have resulted in an increased number of internet searches related to influenza. However, this overestimation was much greater in the United States in 2012–2013, where GFT estimated the peak in the percentage of physician visits related to ILI at 10·6% 3 weeks after the 6·1% peak reported by CDC [Reference Olson4]. Therefore, GFT estimates appear to have performed better as a representation of national sentinel ILI surveillance in Canada during 2012–2013 than they did in the United States.
%GFT correlated strongly with influenza A positivity in all seasons except 2011–2012 and the timing of its peaks closely corresponded with those of influenza A positivity. However, in 2011–2012 %GFT had lower correlation with influenza A positivity and higher correlation with RSV and hMPV positivity, appearing to correspond first with peaks in positivity for RSV and hMPV and second with peaks in positivity for influenza A. This may be explained by the earlier peaks in RSV and hMPV positivity, which occurred before influenza positivity peaked in 2011–2012, whereas in the other seasons, RSV and hMPV positivity peaked during or after the peak in influenza A positivity. Therefore, during periods in which RSV and hMPV circulated, ILI-related internet searches may have been more likely if this period preceded increases in influenza A positivity. This observation should be examined in future seasons. In contrast to these pathogens, GFT estimates did not appear to correspond closely with influenza B positivity, which was not the dominant type of influenza, except during 2011–2012, when influenza A and B co-circulated in the latter part of the season. Our short study period limited our ability to explore these relationships.
For each season examined, the correlation between %GFT and influenza A positivity was equal to or stronger than the correlation between %PHAC and influenza A positivity. These results are in contrast to US research, which found overall influenza positivity to correlate more strongly with ILI sentinel surveillance data from the CDC than with US GFT estimates for 2003–2008 [Reference Ortiz13]. These differences in results may be due to differences in the study periods and influenza seasons examined, to the combining of influenza types in the US study compared to our separation by antigenic type, or to differences between the two populations.
The peaks observed in both %PHAC and %GFT at the beginning of each season may be explained by an increase in rhinovirus/enterovirus positivity. Rhinoviruses circulate year-round, but show increased occurrence in early autumn and, to a lesser extent, in springtime [Reference Jacobs26] while enteroviruses are more commonly detected in summer and autumn months [Reference Khetsuriani27]. An individual suffering from a cold, most frequently caused by rhinoviruses, may search Google to determine if the symptoms are due to a cold or to influenza; Google may then define this internet search as one related to ILI. Lazer et al. suggest that the overestimation observed in GFT estimates in the United States may be related, in part, to people querying the difference between influenza and common colds [Reference Lazer5]. Our results show that an increase in GFT estimates at the beginning of the influenza season may represent increased incidence in rhinovirus/enterovirus infections.
Our study has several limitations. First, we extracted the number of sentinel ILI consultations reported by PHAC manually from FluWatch reports; therefore, exact values may have been updated after reporting and some out-of-peak weeks were not explicitly reported; for these, we estimated values from bar charts. However, these differences would have been small; based on visual inspection, our figures match well with those of PHAC. Second, this was an exploratory analysis and future studies should expand on our results. For example, our study time period was relatively short because we limited our data to the seasons for which Google had reported prospective estimates of ILI in the United States following the 2009 H1N1 pandemic. Further analyses should be performed for future seasons. We focused on national data, but incorporating an examination of provincial/regional data would also be of interest. Furthermore, our descriptive analysis should be expanded to incorporate multivariable analyses to adjust for seasonality. Third, GFT data has limitations. Google does not make public the search terms used in their GFT methodology [Reference Ginsberg1] and the number of searches that Google defines as being ILI related may change over time because of changes to Google's search algorithm [Reference Lazer5]. These data are especially opaque for countries outside the United States because the peer-reviewed papers [Reference Ginsberg1, Reference Cook7] and updates [Reference Stefansen6] that Google has produced focus on US data; it is not clear how Google has implemented their updates in Canada and this should be further explored. However, by examining the correlation between traditional surveillance data and digital disease surveillance data such as this, we have an opportunity to better understand the relationship between the public's interest in certain health conditions, their healthcare-seeking behaviour, traditional sentinel surveillance, and the incidence of disease in the community; this may be useful to further understand how we might be able to use GFT data for public health surveillance and research. Fourth, age is an important characteristic to consider for respiratory infections; however, GFT estimates by age are not available due to the nature of the data and publicly available ILI consultation rates and laboratory surveillance data from PHAC are not stratified by age. Last, an inherent limitation of traditional surveillance data is that they are based on the healthcare-seeking behaviour of the population, testing behaviour of physicians, and the testing algorithms of the laboratories, which may differ across the country. That is, not everyone who is sick will seek care, have a sample submitted to the laboratory, or be tested for each pathogen in our analysis. Similarly, a key consideration in this analysis is that the people searching for ILI-related terms using Google may not actually have ILI.
GFT estimates are not only indicators of ILI-related healthcare-seeking behaviour, but also relate to underlying patterns of respiratory pathogen positivity. During the study period, GFT estimates corresponded well with PHAC sentinel surveillance data in terms of magnitude and timing of the peaks and did not vastly overestimate the peak in 2012–2013 as was seen in the United States. The timing of peaks in GFT estimates also corresponded well with timing in peaks in positivity for a range of respiratory pathogens, including, but not limited to, influenza A. Quantifying, examining, and monitoring these relationships over time may improve our ability to potentially use GFT as an early indicator to supplement existing public health surveillance systems in Canada.
ACKNOWLEDGEMENTS
We thank the Public Health Agency of Canada for providing archived data from the Respiratory Virus Detection Surveillance System and FluWatch reports.
Dr L. J. Martin is supported by an Alberta Innovates – Health Solutions Postdoctoral Fellowship and funding from the Alberta Innovates Centre for Machine Learning (AICML). Dr Y. Yasui is supported by AICML (Alberta Innovates – Technology Futures) and the Canada Research Chair Program.
DECLARATION OF INTEREST
None.


