


INTRODUCTION
Chickenpox occurs more often in children than adults and has a generally good prognosis [Reference Weller, Evans and Kaslow1]. However, complications such as secondary bacterial skin and soft tissue infections, meningoencephalitis, cerebellar ataxia, pneumonia and hepatitis can occur. Adults and pregnant women who become infected often develop a severe infection. Furthermore, a mortality rate of 2–3/100 000 infected persons has been reported [Reference Boelle and Hanslik2]. Therefore, chickenpox remains an important public health issue worldwide. In Japan, despite the availability of a safe and effective vaccine since 1987, it is estimated that about 4000 people are hospitalized and about 20 die annually as a result of chickenpox [3].
To prevent the burden of chickenpox, researchers have attempted to understand the associated epidemiological factors, such as the mechanism of the seasonality of the epidemics, using reported cases of the disease in surveillance systems [Reference Weller, Evans and Kaslow1]. Chickenpox has an annual cycle in several countries. For example, Japan, Turkey and the UK have bimodal cycles, i.e. two peaks of reported chickenpox cases annually [Reference Kokaze4–Reference Dinleyici6]. One of the dominant hypotheses regarding the cause of the bimodal cycle of reported chickenpox cases is the temperature dependence of disease occurrence [Reference Kokaze4]. An alternative hypothesis proposes that the seasonality of reported chickenpox cases is related to the school calendar, as is the case with measles [Reference Brisson5, Reference Dinleyici6]. Investigations of the reasons for the bimodal cycle of reported chickenpox cases might be significant for the prevention and prediction of this disease.
The purpose of this study was to identify the association of the bimodal cycle of reported chickenpox cases with meteorological conditions. In Japan's nationwide surveillance system for infectious diseases, chickenpox surveillance data are collected in all 47 prefectures. The country is divided into prefectures, each of which is further subdivided into cities with respective wards and blocks. Japan extends from latitude 45° N to 20° N; thus, meteorological conditions vary widely. Our study utilized the chickenpox surveillance data and meteorological data for all 47 prefectures in Japan to conduct a systematic study of the effect of meteorological conditions (temperature, relative humidity, rainfall) on the reported number of chickenpox cases. The analyses included a time-series analysis consisting of the maximum entropy method (MEM) spectral analysis and the least squares method (LSM) [Reference Luo7, Reference Saito8]. The obtained results might aid in the prediction of epidemics and the preparation for the effects of climatic changes on the epidemiology of infectious diseases [Reference McMichael9].
DATA
Chickenpox data
The time-series data that were analysed in this study represent the weekly reported chickenpox incidence data for all 47 prefectures in Japan. These data were obtained from the Infectious Diseases Weekly Report Japan (IDWR) [10]. The incidence data for each prefecture indicated the number of weekly reported chickenpox cases per paediatric sentinel clinic in the prefecture (there are about 3000 paediatric sentinel clinics nationwide). The sentinel case reports of chickenpox were defined by their clinical presentation, i.e. a rash first appearing on the trunk and face and then spreading over the entire body [10]. The data for each prefecture were gathered over 626 weeks (626 data points) from January 2000 to December 2011. Portions of the 2011 data for Miyagi prefecture (week 10) and Fukushima prefecture (weeks 10, 11, 13, 14) were unavailable because of the Great East Japan Earthquake. These missing data were replaced by the mean values that were calculated from the data immediately before and after the missing observations. The 47 prefectures in Japan are shown in Figure 1.
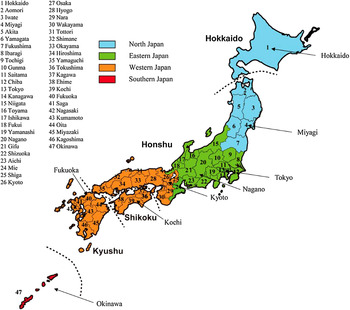
Fig. 1. Distribution of 47 prefectures in Japan. Dashed lines indicate the boundaries of the four main islands constituting Japan: Hokkaido, Honshu, Shikoku and Kyushu.
Children aged 0–4 years accounted for about 75–80% of the reported chickenpox cases during 2000–2011 [3]. For preschool children, the healthcare system in Japan provides healthcare services, including infectious disease control, with the parent/guardian accepting responsibility for 20% of the costs and the government paying the remaining 80% [11]. Payment for personal medical services is offered through a universal healthcare insurance system that provides relatively equal access for chickenpox patients to sentinel clinics and hospitals of the surveillance system, with fees set by a government committee.
Meteorological data
Data on the daily mean values of temperature (°C), relative humidity (%) and the daily rainfall (mm) that were collected in the 47 prefectural capitals during 2000–2011 were obtained from the website of the Japan Meteorological Agency [12]. The daily data were gathered for a total of 4383 days from 2000 to 2011 (4383 data points). Using the daily temperature, relative humidity and rainfall data during 2000–2011 for each prefecture, we calculated a mean value that corresponded to the average of the daily data (one data point). With respect to rainfall, for each prefecture, we further calculated a summation of the daily rainfall during 2000–2011 (one data point).
METHODS
Time-series analysis
Spectral analysis
We assumed that the time-series data x(t) (where t = time) were composed of systematic and fluctuating parts [Reference Armitage, Berry and Matthews13]:
 $$x\left( t \right){\rm} = {\rm systematic \, part} + {\rm fluctuating \, part}.$$
To investigate the temporal patterns of x(t) in the reported chickenpox incidence data and the meteorological data (temperature, relative humidity, rainfall), we performed an MEM spectral analysis. This method of analysis enabled us to elucidate periodicities in the time series of short data lengths with a high degree of frequency resolution compared to other analytical methods of infectious disease surveillance data, such as the fast Fourier transform and the autoregressive method, which require time series of long data lengths [Reference Ohtomo14]. In our previous work, we investigated the periodic structures of surveillance data such as measles with 360 data points, using a MEM spectral analysis [Reference Luo7, Reference Saito8, Reference Sumi15–Reference Sumi17]. The length of the chickenpox time-series data used in our study (626 data points) was longer than that of measles (360 data points) and was sufficient for investigating the periodic structures of the data in detail. The MEM spectral analysis produces a power spectral density (PSD). The formulation of MEM-PSD has been previously described [Reference Luo7].
LSM
The validity of the MEM spectral analysis results was confirmed by the calculation of the least squares fitting (LSF) curve to the original time-series data x(t) with MEM estimated periods. The formulation of the LSF curve in X(t) is described as follows:
 $$X(t) = A_0 + \sum\limits_{n = 1}^N {A_n \cos \left\{ {2\pi f_n \left( {t + \theta _n} \right)} \right\},} $$
which is calculated using the LSM for x(t) with unknown parameters f n , A 0 and A n (n = 1, 2, 3, …, N), where f n ( = 1/T n ; Tn is the period) is the frequency of the nth component, A 0 is a constant that indicates the average value of the time-series data, A n and θ n are the amplitude and phase of the nth component, respectively, and N is the total number of components. The reproducibility level of x(t) by the optimum LSF curve was evaluated by Pearson's correlation (ρ) with SPSS v. 17.0J software (SPSS, Japan). A P value ⩽0·05 was considered as the criterion for statistical significance.
Contribution ratio
For the assignment of periodic modes constructing the seasonality of the original time-series data x(t), a ‘contribution ratio’ was defined [Reference Sumi15, Reference Sumi18–Reference Terachi, Saito, Koyama, Yoneyama, Sawada and Ohtomo21]. The contribution ratio Q n is described as follows:
 $$Q_n = A^2 _n /Q,$$
where A n indicates the amplitude of the nth periodic mode constituting the LSF curve X(t) to the original data x(t) [equation (2)], and Q is the total power of x(t). An outline of the contribution ratio is described in the Appendix.
Correlation between reported chickenpox incidences and meteorological conditions
We investigated the association of the bimodal cycle of reported chickenpox incidences with the temperature, relative humidity and rainfall for each prefecture. Specifically, we conducted the following procedures: (i) the assignment of the periodic cycle describing the seasonal variations of the reported chickenpox incidence from the PSD; (ii) the calculation of the contribution ratio of the periodic cycle assigned in the previous step (i); and (iii) the plotting of the value of the contribution ratio obtained in step (ii) against the average of the daily data for temperature and relative humidity and the summation of the daily data for rainfall during 2000–2011.
Occurrence point of temperature for second peaks of reported chickenpox incidences
To investigate in detail the occurrence point of temperature for the second peaks in the 1-year cycles of reported chickenpox incidences, we identified the temperature values of the minimum reported chickenpox incidence between the first and second peaks of the LSF curve during 2000–2011. Then, we calculated the mean of these temperature values, T. Next, we plotted the contribution of the 6-month cycle (Q 2) against the T value.
Selection method of eight prefectures as illustrative examples
Based on a geographical division of the Japan Meteorological Agency [12], we selected eight prefectures from all 47 prefectures in Japan as illustrative examples. Japan Meteorological Agency divides the entire country into the following four areas for servicing weather information: northern Japan, eastern Japan, western Japan and southern Japan. In this study, we selected one, two or three prefectures from each area as illustrative examples (Fig. 1), as follows: (a) Hokkaido and Miyagi from northern Japan; (b) Tokyo and Nagano from eastern Japan; (c) Kyoto, Kochi and Fukuoka from western Japan; and (d) Okinawa from southern Japan. This gave us a total of eight prefectures.
Japan consists of four main islands (Honshu, Shikoku, Kyushu, Hokkaido). Seven of the above-selected prefectures (excluding Okinawa) were chosen to cover the four main islands that constitute the country, as follows: Honshu (Miyagi, Tokyo, Nagano, Kyoto), Shikoku (Kochi), Kyushu (Fukuoka) and Hokkaido (Hokkaido).
RESULTS
Figure 1 presents the results for eight of the 47 prefectures in Japan as illustrative examples. In Table 1, the eight prefectures are arranged from northern Japan to southern Japan by (a) latitude, (b) longitude and (c) population size.
Table 1. Longitude, latitude, population size and the peaks of LSF curves of eight prefectures in Japan

LSF, Least-squares-fitting.
Age distribution
Although about 1 million reported chickenpox cases are estimated to occur annually in Japan, the number of reported cases has gradually decreased in the past few years [3]. The age distribution of the reported cases is shown in Figure 2 [3]. A gradual decline in the proportion of reported cases in the 0–4 years age group was observed after 2010. This age group contributed 78% of the reported cases in 2009 but this decreased slightly to 75% in 2011. There was a corresponding shift in the age distribution of reported chickenpox cases in the 5–9 years age group, but not significantly, from 20% in 2009 to 22% in 2011 (P = 0·969).

Fig. 2. Age distribution of the reported chickenpox cases from paediatric sentinel clinics.
Temporal variations of reported chickenpox incidence data
Figure 3 indicates the weekly reported chickenpox incidence data for the following eight prefectures: Hokkaido, Miyagi, Tokyo, Nagano, Kyoto, Kochi, Fukuoka and Okinawa. A 1-year chickenpox data cycle is shown for each prefecture. For Hokkaido (Fig. 3a ), two peaks, one in winter and the other in spring, were superimposed on a 1-year cycle. This bimodal cycle was clearly observed in the cases of Miyagi, Tokyo, Nagano and Kyoto (Fig. 3b–e , respectively). However, for Kochi and Fukuoka (Fig. 3f, g , respectively), the annual cycles were largely modulated by fairly irregular, shorter-term variations within the 1-year cycle. For Okinawa (Fig. 3h ), a unimodal pattern was evident.

Fig. 3. Weekly incidence data of chickenpox from eight prefectures in Japan from 2000 to 2011: (a) Hokkaido, (b) Miyagi, (c) Tokyo, (d) Nagano, (e) Kyoto, (f) Kochi, (g) Fukuoka, (h) Okinawa.
Spectral analysis
The PSDs based on the MEM for the chickenpox data (Fig. 3) are shown in Figure 4. In each PSD, the prominent spectral line was observed at f = 1·0 [f(1/year); frequency] ( = f 1) corresponding to the 1-year cycle, and the spectral lines of f 2 ( = f 1 × 2) corresponding to the 6-month cycle, were observed at f = 2·0. For each PSD (Fig. 4), the prominent spectral peak at f 2 (6 months) is a point of interest because it leads to the question of whether the f 2 mode has its origin in the harmonics of f 1, in the bimodal cycles that were clearly observed in the chickenpox data for Hokkaido, Miyagi, Tokyo, Nagano and Kyoto (Fig. 3a–e , respectively), or in a superposition of both.

Fig. 4. Power spectral densities (PSDs) obtained from weekly incidence data of chickenpox from eight prefectures in Japan from 2000 to 2011: (a) Hokkaido, (b) Miyagi, (c) Tokyo, (d) Nagano, (e) Kyoto, (f) Kochi, (g) Fukuoka, (h) Okinawa.
Seasonal cycles of chickenpox incidence data
To investigate the seasonality of each set of chickenpox data (Fig. 3) in detail, the LSF curve in equation (2) was calculated for the 1-year and 6-month cycles that were clearly observed in the PSD (Fig. 4). The LSF curves are shown in Figure 5.

Fig. 5. Comparisons of the weekly incidence data (dashed line) and least-squares-fitting curves calculated with the 1-year and 6-month periodic modes (red solid line): (a) Hokkaido, (b) Miyagi, (c) Tokyo, (d) Nagano, (e) Kyoto, (f) Kochi, (g) Fukuoka, (h) Okinawa.
In Figure 5, the LSF curves for all prefectures except Okinawa (Fig. 5h ) demonstrated a bimodal seasonal cycle with a first peak in winter (December–February) and a second peak in spring (April–June). For Okinawa (Fig. 5h ), the annual occurrence of epidemics was unimodal, with a peak spanning winter–spring (February–April). The values of ρ between the chickenpox data and the LSF curve were high for all prefectures (0·74–0·86). Thus, the 1-year and 6-month cycles made major contributions to the seasonal oscillations. The peak month of the LSF curve for each prefecture is listed in Table 1 d.
The correlation between reported chickenpox incidences and meteorological conditions
Figure 6 [panels (a–c) and (a’–c’)] shows plots of the contribution ratio of the 1-year cycle (Q 1) and the 6-month cycle (Q 2), respectively, against the daily mean temperature and relative humidity data, and the summation of the daily rainfall data during 2000–2011 for all 47 prefectures. The meteorological data for the eight prefectures plotted in Figure 6 are listed in Table 3(a, b, d). Spearman's ρ correlation coefficients between the meteorological data and the contribution ratio (Q 1 and Q 2) were calculated, and the obtained results are listed in Table 2.

Fig. 6. Gradient of Q 1 (left-hand side) and Q 2 (right-hand side) against meteorological factors in 47 prefectures in Japan from 2000 to 2011. (a) and (a’) Daily mean temperature (°C); (b) and (b’) daily mean relative humidity (%); (c) and (c’) summation of daily rainfall (mm).
Table 2. Spearman's ρ calculated for meteorological factors and contribution ratio of seasonal cycles (Q1 and Q2)

** P < 0·01, * P < 0·05.
Table 3. The value of mean, standard deviation (s.d.) and s.d./mean for (a) daily temperature, (b) daily relative humidity and (c) daily rainfall, and (d) the value of a summation of the daily rainfall during 2000–2011 for the eight prefectures in Japan

Occurrence of unimodal cycles of reported chickenpox incidences
As shown in Figure 6a , the value of Q 1 increased as the value of the mean temperature increased. The mean relative humidity and rainfall (Fig. 6b, c , respectively) appeared to have a randomly scattered pattern. The values of Q 1 showed significant correlations with temperature (P < 0·001) and rainfall (P = 0·002) in Figure 6(a, c), respectively. However, no significant correlation with relative humidity (P = 0·134) was identified in Figure 6b . This result indicates that the occurrence of the unimodal cycle of reported chickenpox incidences in Japan is related to the mean temperature and rainfall.
Occurrence of bimodal cycles of reported chickenpox incidences
As shown in Figure 6 a’, the values of Q 2 decreased as the mean temperature value increased, and the mean relative humidity and rainfall appeared to be randomly scattered (Fig. 6 b’, c’, respectively). The values of Q 2 showed significant correlations with mean temperature (P < 0·001) and rainfall (P = 0·014) but no significant correlations with mean relative humidity (P = 0·07), similar to Q 1. This result indicates that the occurrence of the bimodal cycle of reported chickenpox incidences in Japan is associated with the mean temperature and rainfall.
We re-plotted the values of Q 1 and Q 2 against the latitude of the 47 prefectures in Figure 7a, b , respectively. As the latitude became higher, the unimodal cycles of the reported chickenpox incidence disappeared (Fig. 7a ) and the bimodal cycles of the epidemics became apparent (Fig. 7b ).

Fig. 7. A plot of Q 1 and Q 2 against latitude. (a) Q 1 and (b) Q 2.
The occurrence point of temperature for the second peaks of reported chickenpox incidences
The value of Q 2 in Figure 8 gradually decreased from 0·69 at T = 1·1 for Hokkaido in northern Japan to 0·33 at T = 8·8 for Tokyo in eastern Japan. The Q 2 value was 0·1 at T = 9·1 for Kochi and 0·1 at T = 12·1 for Fukuoka in western Japan.

Fig. 8. A plot of Q 2 against the mean temperature of the minimum incidence between the first and second peaks of the least-squares-fitting curve during 2000–2011.
DISCUSSION
This study revealed a statistically significant relationship between the contribution ratio of the 1-year cycle (Q 1) and the 6-month cycle (Q 2) of reported chickenpox incidence and mean temperature (Fig. 6a , a’). The results shown in Figure 7a, b support the findings of Shoji et al. [Reference Shoji, Tsunoda and Ishida22], who showed that the reported cases of chickenpox increased at 5–20 °C (i.e. the temperature range at which the chickenpox virus is activated) and decreased at temperatures lower than 5 °C and higher than 20 °C. In northern Japan, where the temperature falls below 5 °C in winter and exceeds 20 °C in summer, the occurrence of epidemics is bimodal. By contrast, in southern Japan, where the temperature rarely falls below 5 °C in winter, the occurrence of epidemics is unimodal.
A statistically significant relationship with the values of Q 1 and Q 2 was revealed for mean rainfall; however, the strength of the correlation was weak compared to the correlation with temperature (Table 2). This weak correlation of rainfall with Q 1 and Q 2 might be due to the large variance of the daily rainfall data that was observed for the eight prefectures (Table 3 c). However, the amount of rainfall is subject to the amount of water vapour in the air, which influences relative humidity [Reference Ogura23]. As a result, relative humidity vs. Q 1 and Q 2 indicated a scattering point (Table 2). The variances of relative humidity for the eight prefectures (Table 3 b) were relatively small compared to the variances of rainfall (Table 3 c). This result is because relative humidity is constrained by the amount of saturated vapour, which is dependent on the air temperature [Reference Ogura23]. Thus, it is reasonable to consider that the unimodal and bimodal cycles observed in temporal variations of the reported chickenpox incidence were dominated by temperature and had strong correlations with Q 1 and Q 2 (Table 2).
One study identified that reported chickenpox cases in the UK have a bimodal pattern, with two peaks in spring [Reference Brisson5]. In comparison, Canada has a unimodal pattern, with a single spring peak. The explanation that was offered for this difference was that the spring school holiday lasts at least 2 weeks (twice the duration of the chickenpox infectious period) in the UK, whereas the spring school holiday only lasts 1 week in Canada [Reference Brisson5]. With respect to Japan, the primary school spring holiday lasts about 2 weeks from the end of March to the beginning of April across the whole country [24, 25]. Thus, it is unlikely that the occurrence of bimodal reported chickenpox incidences in Japan is related to the school calendar. Rather, the bimodal pattern might result from the mean temperature, as observed in Figure 6(a, a’).
The occurrence point of temperature of the second peaks in the annual cycles of reported chickenpox incidences has attracted the attention of researchers [Reference Kokaze4, Reference Shoji, Tsunoda and Ishida22]. In Figure 8, the decreasing trend separates two regions of Japan (solid and dashed lines in Fig. 8). The solid line indicates that the bimodal cycle disappears as the latitude becomes lower. The dashed line indicates that the unimodal cycle appears as the latitude becomes lower. In Figure 8, the anomalous behaviour at T ≅ 8·5 bestriding the boundary between the two decreasing trends is considered to correspond to a transitional region between the bimodal and unimodal cycles. This result supports the following previous reports on the occurrence point of temperature for second peaks in annual cycles in reported chickenpox cases in Japan: T = 5·0 by Shoji et al. [Reference Shoji, Tsunoda and Ishida22] and T = 7·5 by Furushima et al. [Reference Furushima26].
The epidemiology of chickenpox differs in temperate and tropical regions [Reference Lolekha27]. In temperate regions, chickenpox is a disease of preschool and school-aged children. In tropical regions, chickenpox typically occurs at a later age, with many cases in adolescents and adults who are at risk of developing more severe disease. The relatively small number of reported chickenpox cases in children in tropical regions may result from the reduced chickenpox virus transmission in those areas [Reference Lee28]. Garnett et al. [Reference Garnett29] proposed that the transmission potential of chickenpox virus might be adversely affected by a combination of high ambient temperatures and humidity in tropical regions. For example, in India, outbreaks of chickenpox appear to be more common in the cooler months of the year than the warmer months [Reference White30]. By contrast, in tropical regions such as Singapore, the incidence does not seem to vary according to season [31]. Recently, Rice [Reference Rice32] interpreted the seasonality of reported chickenpox incidences in tropical regions from the viewpoint of the level of ultra-violet radiation and air pollution. Thus, the effect of meteorological factors on chickenpox incidence might differ from one country to another in tropical regions. To understand the underlying causes of chickenpox virus transmission in tropical regions and to utilize the obtained results effectively for health service, it is necessary to conduct a systematic study to quantify the impact of meteorological factors on chickenpox incidence for each country in the tropical regions. For this purpose, the Susceptible-Exposed-Infective-Recovered (SEIR) model, which is a well-known mathematical model of infectious disease epidemics, might be useful, as in the case of malaria [Reference Martens33]. Thus, it is expected that a theoretical procedure such as the SEIR model will contribute to the future investigation of meteorological factors for chickenpox transmission [Reference Luo7]. This investigation should be conducted in future research.
The chickenpox vaccine was first licensed in Japan in 1987 and is administered at the request of an individual or a child's legal guardian as part of the voluntary vaccination programme. For the prefectures that were used as illustrative examples in our study, in 2006, the vaccination coverage rates for Hokkaido and Miyagi exceeded the national average (35·7%) and those for Nagano and Kyoto were below it [34]. However, the temporal patterns of the incidence data for these four prefectures indicated approximately the same pattern in 2006, i.e. the bimodal cycle (Fig. 5a, b, d, e , respectively). From 2006 until recently, the vaccination coverage rate has remained low at about 30–40% [3, Reference Ozaki35], and the temporal patterns of the four prefectures has continued to indicate the bimodal cycle (Fig. 5a, b, d, e ). Thus, the vaccination coverage rate might not have affected the temporal patterns of the incidence data throughout the time range that was investigated in this study (2000–2011). When the vaccination coverage rate exceeds 80% in Japan, the seasonal peak superposed on a 1-year cycle will diminish, as observed in the USA [Reference Seward36]. The Strategic Advisory Group of Experts (SAGE) on immunization of the World Health Organization concluded that before countries introduce the chickenpox vaccine into routine childhood immunization programmes, they should establish an adequate disease surveillance system to assess the burden of chickenpox, with the provision of continued surveillance after the introduction of the vaccination [Reference Brisson37]. This is because resources must be sufficient to ensure that a vaccine coverage of ⩾80% is reached and sustained because a vaccine coverage of 20–80% would shift chickenpox to older ages, with the risk of an associated increase in severe disease and mortality [38]. SAGE also indicated that meteorological factors and other country-specific factors, rather than the country's world region, are key determinants of chickenpox incidence [Reference Brisson37]. Thus, it is expected that for countries without universal chickenpox vaccination, our method of time-series analysis will contribute to the estimation of the correlation of meteorological factors with chickenpox incidences.
In this study, bimodal cycles of reported chickenpox incidences that were clearly observed in northern Japan disappeared at lower latitudes, and unimodal cycles appeared in the south. Based on the results in Figure 6(a, a’), this transition of patterns of reported chickenpox incidences might be temperature-dependent. The Intergovernmental Panel on Climate Change Third Assessment Report indicated that ‘changes in climate that will affect potential transmission of infectious diseases include temperature, humidity, altered rainfall, and sea-level rise’ [Reference McCarthy39]. Based on this report, it is possible that the temporal chickenpox pattern in northern Japan will change from bimodal to unimodal if the temperature increases in Japan. The chickenpox virus is devoid of thermostatic mechanisms, and its reproductions and survival rates are strongly affected by fluctuations in temperature as well as other viruses, parasites and bacteria [Reference Meeburg and Kijllstra40, Reference Patz41]. Thus, the investigation of the effect of meteorological factors on the epidemiology of infectious diseases, including chickenpox, is necessary for practitioners and public health policy-makers to control disease and for media events to encourage preventive activities.
APPENDIX
On the determination of the value of ‘contribution ratio’. Based on the result of MEM spectral analysis, we assign periodic modes f n in equation (2) that construct seasonal variations of chickenpox data. First, the power of each periodic mode is evaluated by the square of amplitude, A n 2, of the nth mode constituting the LSF curve. Second, we estimate R corresponding to the power of residual time series which is obtained by subtracting the LSF curve from the original time series. As a result, the total powers of the original time series Q is obtained by
 $$Q = A_n^2 + R.$$
When both sides of equation (A1) are divided by Q, we obtain the following normalized relation:
 $$A_n^2 /Q\, + \,R/Q = 1,$$
Where A n 2/Q and R/Q correspond to the contribution of A n 2 and R to Q, respectively. We define the first term of the left-hand side of equation (A2) the ‘contribution ratio’, which means the contribution A n 2 normalized by Q. If A n 2/Q in the first term becomes large, then the second term R/Q becomes small.
ACKNOWLEDGEMENTS
This study was supported in part by a Grant-in-Aid of Scientific Research (Grant no. 25460769) from the Ministry of Education, Culture, Sports, Science, and Technology of Japan.
DECLARATION OF INTEREST
None.


