


INTRODUCTION
Avian influenza viruses (AIVs) may infect many different bird species. In wild aquatic birds, the natural reservoir of AIVs, AIV infections are mainly subclinical and the viruses circulate freely without causing harm to the hosts [Reference Webster1, Reference Olsen2]. However, in poultry species AIVs may cause a variety of symptoms. Therefore, two pathotypes of AIV are considered, based on the symptoms the virus causes in chickens. In poultry, most AIVs produce subclinical infections or signs of a localized infection such as respiratory disease with general depression and a drop in egg production, which may or may not be aggravated by opportunistic infections [Reference Nili and Asasi3–Reference Swayne and Pantin-Jackwood5]. These AIVs are typically classified as low pathogenic avian influenza viruses (LPAIVs). As a result of mutations, LPAIVs belonging to the H5 and H7 subtypes (low pathogenic notifiable avian influenza viruses; LPNAIVs) may evolve into highly pathogenic avian influenza viruses (HPAIVs) which cause systemic disease and have very high mortality rates, often up to 100%. These outbreaks may lead to large economic disasters [Reference Swayne6, 7]. It is currently widely accepted that HPAIVs emerge by mutation from LPNAIVs when they are circulating in poultry [Reference Koch and Elbers8].
In order to install surveillance and control programmes directed towards a rapid detection of LPNAIVs that are circulating in poultry [9], reliable scientific data on the transmission of these viruses is required. Transmission experiments allow for the study of the effect of a single factor on LPNAI transmission and have been used for studying the modes of LPNAI transmission [Reference Van der Goot10–Reference Yee17]. With this information, decision makers can direct surveillance and control strategies to focus more on those sectors of the poultry industry that are at risk, thereby increasing the odds of detecting LPNAIVs more quickly and improving the allocation of resources [Reference Welby18]. Additionally, estimating LPNAIV transmission parameters provides insight in the velocity of LPNAI spread in poultry flocks, which can then be used for setting the specific requirements of surveillance programmes and their feasibilities [Reference Gonzales19, Reference Gonzales20].
Transmission experiments are mainly conducted by exposing susceptible animals to experimentally inoculated animals for a certain amount of time or until the final state of the experiment is reached. Such experiments are typically referred to as standard transmission experiments. Since higher LPNAIV inoculation doses may lead to chickens excreting higher amounts of virus during a longer time period [Reference Capua21–Reference Lu and Castro23], it can be reasonably assumed that the use of inoculated instead of naturally infected animals may lead to an overestimation of transmission. Alternatively, extended transmission experiments can be performed [Reference Velthuis24]. In these experiments, inoculated animals are used to create a first generation of contact-infected animals, which are then brought into contact with susceptibles. It can be assumed that these contact-infected animals might more closely resemble naturally infected animals [Reference Bouma, De Jong and Kimman25]. To our knowledge, such extended transmission experiments have not yet been conducted to model the transmission of LPNAIVs in chickens. In the present study, we conducted extended transmission experiments with two chicken-originated LPNAIVs; one H5 and one H7 LPAIV. Estimating the basic reproduction ratio (R 0), which is essentially the average number of susceptible individuals that are infected by one typical infectious individual during its entire infectious period in a fully susceptible population [Reference Diekmann, Heesterbeek and Metz26], it was assessed if virus transmission from contact-infected chickens to susceptible chickens differs importantly from virus transmission from inoculated to susceptible chickens.
MATERIALS AND METHODS
Viruses
Two LPNAIVs were used in the present study. LPAIV H5N2 A/Ch/Belgium/150VB/99 was isolated in 1999 by the Veterinary and Agrochemical Research Institute (VAR). The virus was isolated from chickens in a mixed backyard poultry holding with about 100 chickens and 20 ducks. The first clinical signs such as depression, diarrhoea and respiratory distress appeared 10 days after a few chickens were bought from a dealer at a local market [Reference Meulemans27]. A second egg passage of this virus was used for inoculation of the animals.
LPAIV H7N1 A/Ch/Italy/1067/v99 was isolated by the Istituto Zooprofilattico Sperimentale. This virus was isolated from chickens during the 1999 LPAI epidemic in northeastern Italy [Reference Capua28]. A fourth egg passage of this virus was used for inoculation of the animals.
Animals
Experiments were conducted with specific pathogen-free (SPF) chickens. Eggs were delivered by Lohmann-Valo (Germany) and hatched at own facilities. Chickens were housed in biosafety level-3 isolators (type: HM1500, Montair Process Technology B.V., The Netherlands) from the day of hatching until the end of the experiment. The isolators have a floor surface of 1·2 m2 and the internal volume measures 0·9 m3. The floor of the isolators comprised covered wood shavings (Agrospan Houtkrullen, Vividerm, Belgium). A negative air pressure of 45 ± 5 m3/h was maintained. Each animal experiment was conducted under the authorization and supervision of the Biosafety and Bioethics Committee at VAR, following national and European regulations.
Experimental design
Two extended transmission experiments were conducted. Each experiment consisted of two trials, which were replicates. In experiment 1 (trials 1 and 2), LPAIV H5N2 A/Ch/Belgium/150VB/99 was used. In experiment 2 (trials 3 and 4), LPAIV H7N1 A/Ch/Italy/1067/v99 was used.
At the beginning of each experiment, twelve 5-week-old SPF chickens were oculonasally inoculated with a virus dose of 106 egg infectious dose (EID)50/100 μl. This day is referred to as the inoculation day, or day −4. At day −3, the transfer day, these 12 inoculated chickens (I chickens) were randomly separated in two groups of six and allocated to one of the two trials of the experiment. This way, both trials of each experiment started with inoculated chickens that were inoculated at the same time and with the same inoculum. Each group of six I chickens was then moved to a different isolator which contained six susceptible animals, hereafter referred to as first-contact chickens (C1 chickens). The I and C1 chickens were housed together for 3 days, until the replacement day (day 0). On the replacement day, the C1 chickens were moved to another isolator which again contained six susceptible animals, hereafter referred to as second-contact chickens (C2 chickens). C1 and C2 chickens were then housed together until the experiment was ended, at day 21 (Fig. 1).
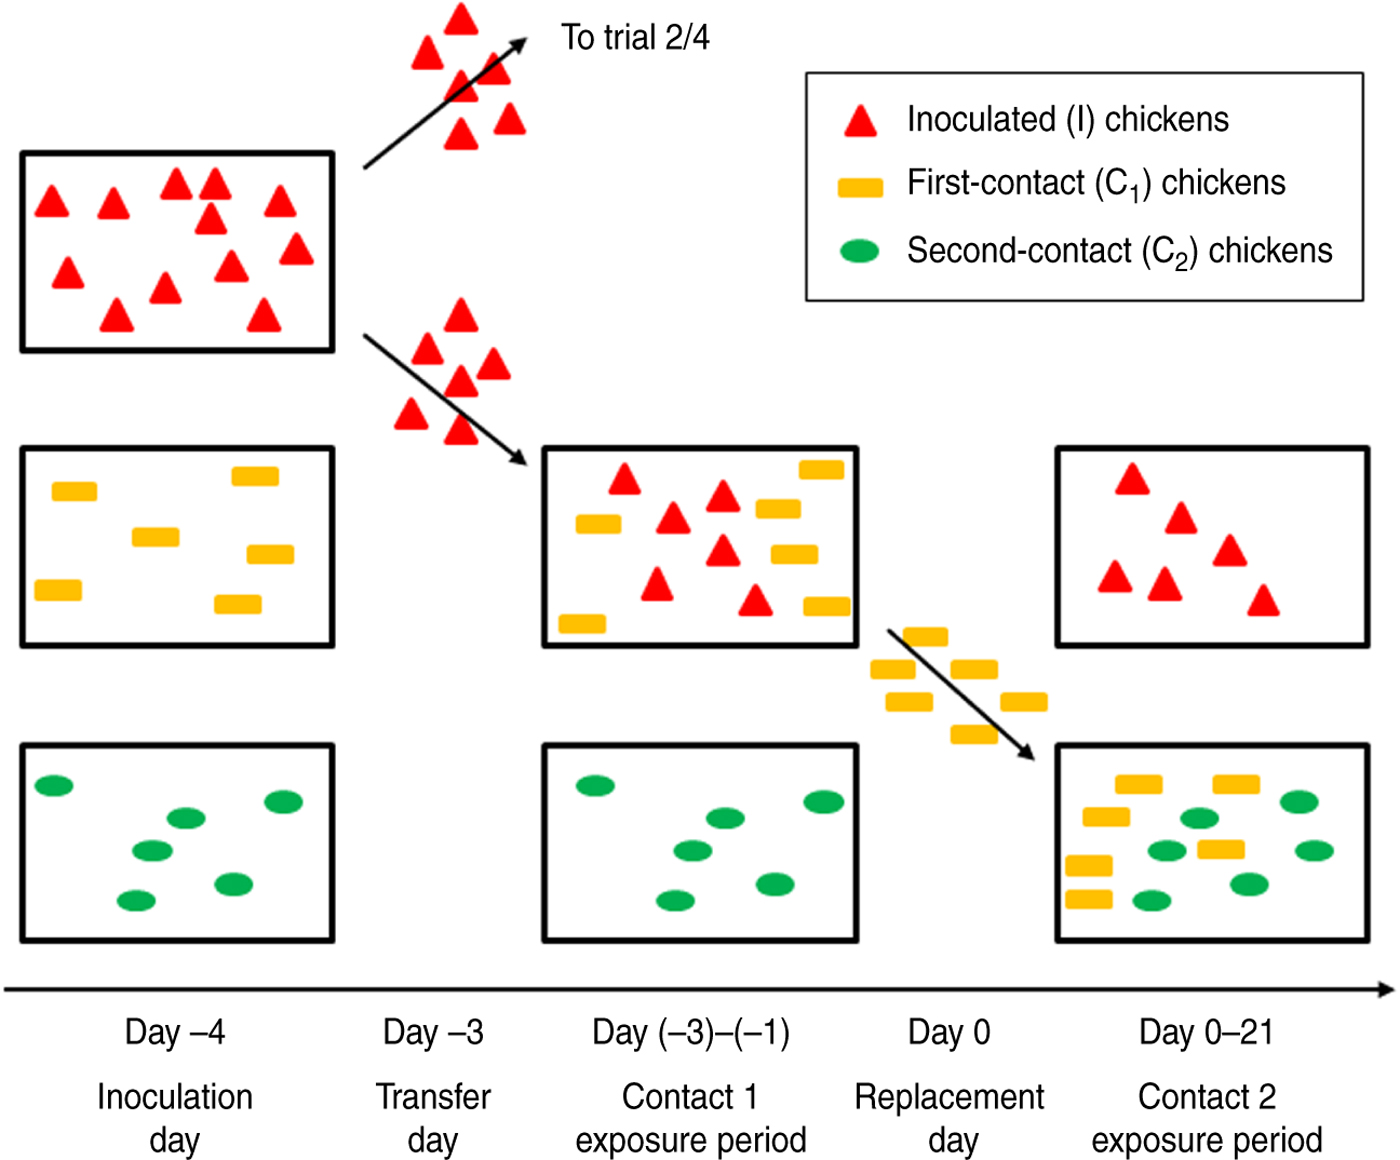
Fig. 1. Experimental design of extended transmission experiments conducted in the present study. For each of the two experiments, twelve 5-week-old specific pathogen-free chickens were inoculated at day −4. The next day, these I chickens (red triangles) were randomly separated into two groups of six chickens each, allocated to one of the two trials and moved to a different isolator which contained six susceptible animals (C1 chickens; yellow rectangles). After 3 days of close contact between I chickens and C1 chickens (contact 1 exposure period), the C1 chickens were moved to another isolator, again containing six susceptible animals (C2 chickens; green ovals). C1 and C2 chickens were then housed together until the experiment was ended, at day 21 (contact 2 exposure period).
Sampling
Blood samples were collected from I chickens, prior to the onset of the experiment and at 14 and 21 days post-inoculation (dpi). For the assessment of virus transmission, blood samples were collected from C1 and C2 chickens prior to the onset of the experiments and at 7, 10, 14 and 21 days post-exposure (dpe). Blood samples were allowed to coagulate, after which sera were harvested and stored at −20°C, awaiting further analysis.
Assessment of virus shedding was done by taking oropharyngeal (OP) and cloacal (CL) swabs at critical time points only, to reduce stress for the animals as much as possible. I chickens were sampled on the transfer day (day −3) and again sampled on the replacement day (day 0). The C1 chickens were sampled on day 0 and again on day 4. The C2 chickens were swabbed on days 1, 3 and 7. Swabs were immediately immersed in brain-heart-infusion broth enriched with a mixture of antibiotics (106 U/l penicillin G, 2 g/l streptomycin, 1 g/l gentamycin sulfate and 66 ml/l kanamycin sulfate x100). Sample tubes were briefly vortexed to release swab material after which the cotton was discarded. Samples were then stored at −80°C, awaiting further analysis.
Sample analysis
Blood sera were tested for presence of antibodies directed towards the AIV nucleoprotein with IDScreen influenza A antibody competition ELISA kit (IDvet, France). The test was conducted according to the manufacturer's instructions. Serum samples with a sample-to-negative (S/N) ratio ⩾0·5 were considered negative, and S/N ratios <0·5 were considered positive. Sera were also tested for antibodies directed towards the homologous antigen, using a haemagglutination inhibition (HI) assay. HI assays were performed according to OIE recommendations, using homologous antigen [29]. Samples with a HI titre ⩾16 were considered positive and the assay's detection limit was 4096.
Swabs were tested for presence of viral RNA (vRNA) using a one-step real-time reverse transcription–polymerase chain reaction (rRT–PCR). Viral RNA was semi-automatically extracted from 50 μl thawed sample material using a KingFisher magnetic particle processor and the MagMax™ AI/ND-96 Viral RNA kit (Ambion Inc., USA). A total of 25 μl reaction volume (containing 2 μl of purified RNA) was prepared using the Quantitect Probe RT–PCR kit (Qiagen GmbH, Germany) and amplification of the matrix gene was carried out in a 7500 real-time PCR cycler (Applied Biosystems, Belgium) [Reference Van30]. Samples with a cycle threshold value ⩾40 were considered negative. With each run, a series of 1:10 dilutions of synthetic matrix RNA was included to calculate the number of vRNA copies in each sample. A series of 1:10 dilutions of the stock solution of each virus was analysed to create a calibration curve from which EID50 equivalents per ml (EID50 eq/ml) sample medium was calculated. Results were finally expressed as EID50 eq/ml sample medium.
Statistical analysis
Animals were considered infected if at least one serum sample was found positive by nucleoprotein (NP) ELISA. Virus transmission between C1 and C2 chickens was assessed according to the Susceptible-Infectious-Recovered (SIR) model [Reference Velthuis24]. For an estimation of the basic reproduction ratio (R 0), the maximum likelihood estimator was used, according to following formula:
 $$R_0 = \max \prod\limits_{i = 1}^n {{\rm Prob}(x_i. R_0 \vert N.S_0. I_0 ),} $$
where R 0 is the basic reproduction ratio, x i is the number of contact-infected animals, N is the total number of animals, S 0 is the number of susceptible animals at the beginning of the experiment and I 0 is the number of infectious animals at the beginning of the experiment. I 0 was determined as the number of C1 chickens found positive by rRT–PCR at day 0. Ninety-five percent confidence intervals (CIs) were constructed symmetrically around the estimate of R 0 [Reference de Jong and Kimman31, Reference Bouma32]. No basic reproduction ratios were estimated for virus transmission between I and C1 chickens, since the exposure was interrupted before the end-state was reached.
RESULTS
Experiment 1: Extended transmission of H5N2 A/Ch/Belgium/150VB/99
Trial 1
All six I chickens were successfully infected. Virus shedding was observed in every I chicken at least once throughout the contact 1 exposure period. OP virus shedding was present in 5/6 I chickens at day −3 and again in 5/6 I chickens at day 0. CL virus shedding was witnessed in 4/6 I chickens, all at day 0 only (Table 1). Immune responses were present in all I chickens as well (Table 2). HI assays indicated HI titres at day 21 ranged between 128 and 4096 (Fig. 2).

Fig. 2. Schematic presentation of HI titres found in serum samples obtained at 14 and 21 days post-inoculation (dpi) for I chickens (red boxes) and 7, 10, 14 and 21 days post-exposure (dpe) for C1 and C2 chickens (yellow and green boxes). The thick line inside the boxes represents the median value, the top and bottom of the boxes represent the 25th and 75th percentiles and the whiskers represent the 5th and 95th percentiles. Outliers are represented as circles. HI titres are represented as log2 values.
Table 1. Overview of virus shedding data obtained from experiments performed in this study

I, Inoculated chicken; C1, first-contact chicken; C2, second-contact chicken; OP, oropharyngeal swab; CL, cloacal swab; IQR, interquartile range; n.t., not tested.
* Median EID50 eq/ml sample medium.
Table 2. Overview of nucleoprotein ELISA and haemagglutination inhibition assay results for all trials conducted in this study

I, Inoculated chicken; C1, first-contact chicken; C2, second-contact chicken; n.t., not tested.
The number of individuals found positive by NP ELISA (before the hyphen) and by HI assay (after the hyphen) are presented for blood samples collected at 7, 10, 14 or 21 days post-inoculation/exposure.
At the replacement day, 5/6 C1 chickens proved to be shedding virus, via the OP route only. At day 4, OP virus shedding was observed in 5/6 C1 chickens, one of which exhibited CL virus shedding as well (Table 1). At the end of the trial, all C1 chickens were found to have seroconverted. However, one of them had a transient immune response which was only detected by NP ELISA, at day 14 (Table 2).
OP virus shedding was observed in one C2 chicken at day 3 and four C2 chickens at day 7. No CL virus shedding was observed. The same four virus-shedding C2 chickens and an additional fifth C2 chicken, which was not found to be shedding virus at days 1, 3 or 7, were found positive by NP ELISA (Table 2).
Trial 2
OP virus shedding was detected in 3/6 I chickens at day −3 and 5/6 I chickens at day 0. CL virus shedding was detected in one animal, at day 0 only (Table 1). All I chickens developed an immune response (Table 2). HI titres at day 21 were generally lower than in trial 1, ranging between 128 and 512 (Fig. 2).
All C1 chickens were found to be shedding virus at days 0 and 4. CL virus shedding was not observed (Table 1). By the end of the experiment, all C1 chickens had developed an immune response (Table 2).
OP virus shedding was observed in five C2 chickens, one at day 1, the other animals at days 3 and 7 (Table 1). CL virus shedding was not observed. The same animals that demonstrated virus shedding were also found to have seroconverted (Table 2).
Differences in immune response intensities
Figure 2 represents the HI titres observed in sera from animals that were found positive by HI assay with the homologous H5N2 virus. Combining the results of both trials, an independent-samples t test showed no significant difference between the intensity of the log2 HI titres in I chickens and C1 chickens at 14 days (P = 0·14) and a borderline significant difference at 21 days (P = 0·05) post-inoculation/exposure. No significant difference between the intensity of the log2 HI titres in C1 chickens and C2 chickens was observed at 14 dpe (P = 0·10) and at 21 dpe (P = 0·23). The intensity of the log2 HI titres in I chickens and C2 chickens at 14 days and at 21 days was significantly different (P = 0·01 and P = 0·03, respectively).
Quantification of transmission
A reproduction ratio was estimated for virus transmission from C1 to C2 chickens. Results from both trials were combined and the R 0 was estimated at 2·11 (95% CI 0·85–6·15).
Experiment 2: Extended transmission of H7N1 A/Ch/Italy/1067/v99
Trial 3
OP virus shedding was detected in 5/6 I chickens at day −3 and 4/6 I chickens at day 0. CL virus shedding was witnessed in one I chicken, at day 0 only (Table 1). All I chickens seroconverted (Table 2).
At day 0, none of the C1 chickens showed virus shedding (Table 1). An immune response was detected in only one C1 chicken, at 21 dpe only, a result that was borderline positive (Table 2).
None of the C2 chicken swabs were found to contain vRNA at day 1 (Table 1). Therefore, because virus shedding was not observed in C1 chickens, no further swabs were analysed. None of the C2 chickens were found to have developed an immune response (Table 2). One C2 chicken died from a non-influenza-related cause at day 10.
Trial 4
Viral RNA was detected in OP swabs from 4/6 I chickens at days −3 and 0. CL virus shedding was not observed (Table 1). Five I chickens were found to have seroconverted.
None of the C1 chickens were found positive by rRT–PCR at the day of transfer (day −3). Immune response was seen in only one C1 chicken (Table 2), HI titres in sera derived from this animal were low (Fig. 2).
In C2 chickens, virus shedding was not detected at day 1 (Table 1). One C2 chicken was found borderline positive by NP ELISA alone, at 14 dpe, while immune response was absent in all other C2 chickens (Table 2).
Quantification of transmission
A reproduction ratio was estimated for virus transmission from C1 to C2 chickens. The joint R 0 was estimated at 0·73 (95% CI 0·03–12·55).
DISCUSSION
The transmission of LPAIVs in poultry is traditionally examined through standard transmission experiments. In the present study, we tested the hypothesis that inoculation-infected chickens are more infectious than contact-infected chickens. To this end, we conducted extended transmission experiments with two LPNAIVs which we had previously used in a series of standard transmission experiments, LPAIV H5N2 A/Ch/Belgium/150VB/99 and LPAIV H7N1 A/Ch/Italy/1067/v99 [Reference Claes14]. In analogy with that study, we considered chickens infected if antibodies against the virus were detected by NP ELISA, even if this immune response was transient.
In the extended transmission experiment conducted with H5N2 A/Ch/Belgium/150VB/99 LPAIV (experiment 1), virus transmission was seen from contact-infected SPF chickens to susceptible chickens. A comparison of the results obtained from this experiment with results obtained in a previous study [Reference Claes14] suggests that SPF chickens that are inoculated with this virus are approximately equally infectious as contact-infected SPF chickens. Indeed, the joint reproduction ratio we estimated in the present study was found to be only slightly larger than the R 0 that was previously estimated for the same virus, in a standard transmission experiment (1·77, 95% CI 0·55–4·14) [Reference Claes14]. Furthermore, the EID50 equivalents we detected in swabs from C1 chickens were similar to those detected in swabs from inoculated chickens in standard transmission experiments [Reference Claes14]. However, a possible difference in virus shedding could have been missed since swab samples from only 2 days were analysed in the present study. These observations suggest that the infectivity of SPF chickens inoculated by a single oculonasal administration of a 106 EID50/dose of this virus, as described in Claes et al. [Reference Claes14], does not differ importantly from the infectivity of chickens that have become infected as the result of a 3-day exposure to infectious chickens under the current circumstances. Whether this means that a natural infection with this virus in the field can be confidently reproduced with the considered inoculation method remains uncertain; however, the assessment of infectivity is based on a limited set of data and the R 0 estimate has a fairly large 95% CI. We additionally investigated if differences in immune response intensities can be seen in I, C1 and C2 chickens. In this regard, a difference can only be assumed from the graphical representation of HI assay results obtained for trial 1 (Fig. 2), while an independent-samples t test did not indicate a general trait. Arguably, the intensity of the immune response might be related to the stronger intestinal virus replication observed in this trial and is not a good indicator for the infectivity of animals.
For extended transmission experiments with H7N1 A/Ch/Italy/1067/v99 LPAIV, the R 0 estimate was smaller than the one estimated before, in a standard transmission experiment (1·72, 95% CI 0·68–4·14) [Reference Claes14]. However, since this R 0 estimate falls within the then estimated 95% CI, the observed low degree of virus transmission could be due to a normal variation in transmission [Reference Van der Goot10]. Moreover, very little virus transmission was observed during the contact 1 exposure period, which resulted in few C1 chickens being infectious at the start of the contact 2 exposure period. As a consequence, the 95% CI for the thus obtained R 0 estimate was very wide, which decreases the value of this estimate for drawing a conclusion. The low degree of virus transmission during the contact 1 exposure period was unanticipated. Compared to virus shedding data obtained previously, in Claes et al. [Reference Claes14], virus shedding during the contact 1 exposure period seems not to have been unusually low. Therefore, we believe that the low number of infected C1 chickens was due to the timing of the contact 1 exposure period, which may have been too short or may have been planned too soon after inoculation. Since the first 3 days following inoculation is generally characterized by OP virus shedding for this virus [Reference Claes14, Reference Gonzales20, Reference Marché, Lambrecht and van den Berg33], the C1 chickens were not exposed to infectious faecal matter. Despite oral LPAI transmission being recognized in chickens in several studies, faecally shed virus has been suggested to increase virus transmission [Reference Claes14, Reference Yee17]. It can thus be assumed that the infectious dose required for transmission was not attained by oral virus shedding between 1 and 4 dpi alone.
Combining results from the present study and from Claes et al. [Reference Claes14] it can be assumed that H5N2 A/Ch/Bel/150VB/99 LPAIV may be capable of spreading more rapidly throughout a susceptible chicken population than H7N1 A/Ch/Italy/1067/v99 LPAIV, which is a virus with a much more severe history [Reference Capua28]. Therefore, the fact that H5N2 A/Ch/Bel/150VB/99 LPAIV was isolated on only one occasion [Reference Meulemans27] makes this virus particularly interesting. Considering the conditions in which the virus was obtained, spread to other backyard flocks connected via the same dealer could be assumed, while spread to commercial poultry holdings may not have occurred [Reference Meulemans27]. However, since no other cases were detected, it is possible that the virus died out spontaneously because the available number of susceptible individuals in backyard holdings is generally small and because Belgian backyard poultry holdings rarely have off-farm movements [Reference Van34]. It is hereby suggested that potentially dangerous LPNAIVs may be present in backyard poultry holdings, but that transmission to commercial poultry is determined by the contact structures between these two sectors. In Belgium, where contacts between backyard and commercial poultry are rather limited, these two sectors can be considered to be epidemiologically isolated from each other [Reference Van34, Reference Bavinck35]. Arguably, this is the reason why H5N2 A/Ch/Bel/150VB/99 LPAIV did not cause outbreaks in commercial poultry, while our results show that the virus is theoretically capable of doing so. Backyard poultry holdings are not included in the Belgian active AI surveillance programme, which may indeed not be necessary. However, in countries with more complex contact structures between rural and industrial poultry holdings, such as Italy, complex contacts between the two sectors make disease control very difficult [Reference Cecchinato36, Reference Terregino37]. Therefore, special focus on those holdings that are connected to both the rural and industrial poultry sectors may prove very useful and may need to be included in the Belgian active AI surveillance programme [Reference Cecchinato36].
While LPNAIVs may transmit in different ways, the hypothesis that inoculation-infected chickens are more infectious than contact-infected chickens could not be confirmed for the two LPNAIVs used in this study. Our results additionally show that the timing of the exposure period may influence transmission, the impact of this factor being highly dependent on the LPNAI strain under consideration. This finding may be of limited importance for industrial poultry holdings, but could suggest that some poultry-adapted LPNAIVs are less likely to be transmitted at bird gatherings where the exposure time can be short, like street markets or live bird markets.
ACKNOWLEDGEMENTS
The authors thank Mieke Steensels, Anouar Nadi, Christophe Delgrange and Marc van den Broeck for their technical and laboratory assistance. We also thank Dr Ilaria Capua (Istituto Zooprofilattico Sperimentale delle Venezie, Legnaro, Padova, Italy) for providing the H7N1 virus used in this study. This work was supported by Belgian Contractual Research (Flutrans, Belspo).
DECLARATION OF INTEREST
None.


