


Introduction
The Proterozoic Eon encompasses some of the most dramatic changes in the history of Earth and life, including the evolution and radiation of eukaryotes, the evolution of stem group metazoans, the origins of both eukaryotic and metazoan biomineralization (Knoll Reference Knoll2003), possible changes in the oxidative state of the planet’s atmosphere and oceans (e.g., Scott et al. Reference Scott, Lyons, Bekker, Shen, Poulton, Chu and Anbar2008; Planavsky et al. Reference Planavsky, Reinhard, Wang, Thomson, McGoldrick, Rainbird, Johnson, Fischer and Lyons2014), and two globally distributed, low latitude glacial events (Hoffman Reference Hoffman1998; Rooney et al. Reference Rooney, Strauss, Brandon and Macdonald2015). Proterozoic environmental change has been reconstructed through a wide variety of geochemical and sedimentological proxies (e.g., Lyons et al. Reference Lyons, Reinhard and Planavsky2014; Li et al. Reference Li, Evans and Halverson2013), whereas the record of life is reconstructed solely from the fossil record and molecular clocks (Peterson et al. Reference Peterson, Lyons, Nowak, Takacs, Wargo and McPeek2004; Knoll et al. Reference Knoll, Javaux, Hewitt and Cohen2006; Erwin et al. Reference Erwin, Laflamme, Tweedt, Sperling, Pisani and Peterson2011; Parfrey et al. Reference Parfrey, Lahr, Knoll and Katz2011). Since the proliferation of molecular clock data, a first order goal of Proterozoic geobiology has been to reconcile these data with the fossil record (e.g., Sperling et al. Reference Sperling, Robinson, Pisani and Peterson2009). While there has been much concern about limitations of molecular clock data (Roger and Hug Reference Roger and Hug2006), little has been done to address the myriad biases inherent in the Proterozoic fossil record, including issues of rock record availability, poor age constraints, taphonomy, and the enigmatic nature of many Proterozoic fossils. Although Proterozoic paleobiology cannot yet attempt the massive sample standardized long term analyses possible in the Phanerozoic (Alroy et al. Reference Alroy, Aberhan, Bottjer, Foote, Fürsich, Harries, Hendy, Holland, Ivany, Kiessling, Kosnik, Marshall, McGowan, Miller, Olszewski, Patzkowsky, Peters, Villier, Wagner, Bonuso, Borkow, Brenneis, Clapham, Fall, Ferguson, Hanson, Krug, Layou, Leckey, Nürnberg, Powers, Sessa, Simpson, Tomašových and Visaggi2008) the significant increase in publications describing new eukaryotic taxa from the Proterozoic (Fig. 1) combined with a statistical approach and a close analysis of potential biases enables us to attain a more nuanced understanding of what the fossil record can and cannot tell us about changing environments and biota in the Proterozoic Eon.

Figure 1 Cumulative graph of publications documenting Proterozoic eukaryotic fossils; note large increase in publications since 2010. See Supplementary Appendix for details.
Here, we assess the existing record of Proterozoic fossils and test the robustness of this record by investigating potential biases presented by taphonomy, fossil categorizations, regional sampling, and uncertainties in age models. We then layer on existing paleogeographic, geochemical, and climatological datasets and assess potential relationships between eukaryotic diversification and environmental change. Questions we seek to illuminate with improved datasets include: What was the relationship between eukaryotic diversification and a putative rise in oxygen (Lenton et al. Reference Lenton, Boyle, Poulton, Shields-Zhou and Butterfield2014; Planavsky et al. Reference Planavsky, Reinhard, Wang, Thomson, McGoldrick, Rainbird, Johnson, Fischer and Lyons2014)? Did the breakup of the supercontinent Rodinia lead to changes in the diversity and distribution of microfossil assemblages (Valentine and Moores Reference Valentine and Moores1970; Dalziel Reference Dalziel1997; Hoffman Reference Hoffman1998)? Was the diversification of crown group eukaryotes and origin of biomineralization (Parfrey et al. Reference Parfrey, Lahr, Knoll and Katz2011, Cohen et al. Reference Cohen, Schopf, Butterfield, Kudryavtsev and Macdonald2011) driven by tectonically modulated changes in ocean chemistry (e.g., Halverson et al. Reference Halverson, Wade, Hurtgen and Barovich2010; Squire et al. Reference Squire, Campbell, Allen and Wilson2006)? Did increased sinking of newly evolved mineralized tests drive changes in the biogeochemical cycles and climate (Tziperman et al. Reference Tziperman, Halevy, Johnston, Knoll and Schrag2011)? What were the effects of global glaciation (a.k.a. Snowball Earth; Hoffman et al. 1998) on microeukaryotes? Were microeukaryotic diversification and the appearance of metazoans driven by predation (Porter Reference Porter2011), changing ocean chemistry, or other factors? These questions can only be fully answered by a detailed and critical view of both chemical proxy data and the fossil record itself. Below, we discuss hypotheses related to the nature of Proterozoic evolution and argue that tests must necessarily be limited to the fidelity of the fossil record.
Previous Assessments of Proterozoic Diversity
Proterozoic diversity has been assessed in each of the last three decades (Vidal and Knoll Reference Vidal and Knoll1983; Vidal and Moczydłowska-Vidal Reference Vidal and Moczydłowska-Vidal1997; Knoll et al. Reference Knoll, Javaux, Hewitt and Cohen2006). The earliest reviews (Vidal and Knoll Reference Vidal and Knoll1983; Vidal and Moczydłowska-Vidal Reference Vidal and Moczydłowska-Vidal1997) focused solely on acritarch taxa, assumed by the authors to be the remains of photosynthetic taxa. Other have looked at different metrics of diversity, such as morphological disparity, again focusing solely on acritarch taxa (Huntley et al. Reference Huntley, Xiao and Kowalewski2006) or macroalgal taxa (Xiao and Dong Reference Xiao and Dong2006). A later assessment by Knoll et al. (Reference Knoll, Javaux, Hewitt and Cohen2006) expanded diversity analyses to include taxa not presumed to be photosynthetic, such as vase shaped microfossils, and looked at within assemblage (alpha) diversity, as opposed to total (gamma) diversity, in the Proterozoic.
The most critical differences between this assessment of Proterozoic eukaryotic diversity and previous ones are the improved temporal resolution and the increased number of publications describing fossils, especially from between the Sturtian and Marinoan aged glaciations. For example, the last comprehensive assessment of eukaryotic diversity was done in 2006 by Knoll and co-authors; our database includes 32 manuscripts that have been published since 2006, which represents almost a doubling of records. In addition, this analysis takes a more statistical approach and considers potential biases and influencing factors in a way that has not been previously addressed, including geography, lithology, and preservation pathways.
Here we follow Knoll et al. (Reference Knoll, Javaux, Hewitt and Cohen2006) by assessing diversity within individual assemblages. There are several advantages of the within assemblage approach (Bambach Reference Bambach1977), especially for the Proterozoic: 1) With poor age constraints, determining the relative or absolute temporal relationship between stratigraphic units can be difficult or impossible. For example, if two diverse assemblages of different ages are lumped together because age constrains are poor, summed diversity in a particular bin may be exaggerated. Conversely, extracting a fossil assemblage from a bin due to poor age constraints could also lead to anomalously low diversity. 2) Most eukaryotic fossils from Proterozoic strata have poor taxonomic control. For example, smooth walled leiospherid acritarchs have been hypothesized to be algal, metazoan, or fungal, but these fossils likely represent multiple eukaryotic and potentially even non eukaryotic organisms. Although leiospheres may be the most challenging fossil group in terms of assigning affinity, the problem of uncertain taxonomic affinity remains across many other fossil types. In addition, different taphonomic windows make it challenging to determine if microfossils from different lithologies are indeed the same species or even genus (e.g., Moczydłowska Reference Moczydłowska2005). Many microfossil groups have a small number of distinctive morphological characters, and morphological differences or similarities may be obscured by variable preservation. Thus, determining genus or species level diversity will be influenced by taphonomy and the taxonomic decisions of authors, and determining overlapping species between varying lithologies may be intractable.
In the future, we hope that taxonomic work will move forward to the point where overlapping taxa can be more accurately determined, allowing for the distinction of origination, turnover, and extinction rates in the Proterozoic fossil record. However, the scope of this paper is limited to within assemblage diversity patterns through time, which we believe at present is the most reliable indicator of biotic changes in the Proterozoic.
Materials and Methods
Scope of Literature Search
All data was compiled from published literature; a broad search was undertaken using Google Scholar and GeoRef databases. Search terms included the time designations ‘Proterozoic’, ‘Precambrian’, ‘Vendian’, ‘Mesoproterozoic’, ‘Neoproterozoic’, and ‘Ediacaran’, plus ‘fossil’ and ‘microfossil’. Not all non English literature is included, but those non English publications documenting a high diversity of novel eukaryotic fossils were included. Fossils were only included in the database if they could confidently be assigned to Eukarya, with the exception of smooth walled leiospherid acritarchs, which were included despite the fact that there is the potential for some of them to be non eukaryotic. The Ediacaran fauna and end Ediacaran metazoan taxa such as Cloudina are not included as we chose to focus on non metazoan components of the eukaryotic record. The database includes all found literature published before 01 March 2015. Each publication reporting eukaryotic fossils was entered separately; therefore multiple entries may exist for one stratigraphic unit. However, overlapping taxa were only counted once. For example, a taxon described in a publication on a formation from 1990 was not re-counted in another publication on the same formation from 2000 even if it is described in the later work. The number of taxa described from each publication was reported at the species level where available, where no species names are given, we used morphotypes described and documented by the authors of each publication.
Categorical Assignments of Fossil Taxa
Because of issues with taxonomic assignments discussed above, we did not to categorize fossils by genus or species. In addition, not all Proterozoic fossils of interest have been assigned taxonomic names (e.g., Bosak et al. Reference Bosak, Lahr, Pruss, Macdonald, Gooday, Dalton and Matys2011a,Reference Bosak, Lahr, Pruss, Macdonald, Dalton and Matysb,Reference Bosak, Macdonald, Lahr and Matysc). Our approach was thus to count the total diversity described in each publication and then assign fossils to one of ten morphologically based categories, building off of the categories described in Knoll et al. (Reference Knoll, Javaux, Hewitt and Cohen2006). These categories were chosen to capture the morphological diversity of any given stratigraphic unit (Fig. 2). The categories and their descriptions are as follows:

Figure 2 Representative images of fossil categories. A, Smooth walled organic microfossil. B, ornamented organic walled microfossil Satka favosa, from Javaux et al. (Reference Javaux, Knoll and Walter2004). C, Organic walled microfossil with asymmetrical processes, Ceratosphaeridium sp. D, Organic walled microfossil with symmetrical processes. E, Vase shaped microfossil (VSM). F, Test of putative ciliate from Mongolia. G, Microscopic multicellular, Proterocladus from Butterfield (Reference Butterfield2009). H, Scale microfossil, Characodictyon skolopium. I, Macroscopic MOWS (macroscopic organic warty sheet) from Mongolia.
Smooth walled
These fossils are defined as closed, organic walled structures with no surface ornamentation or processes. Generally, fossils in this category fall into the leiosphaerid acritarch grouping, a likely polyphyletic group of fossils with few morphological characters, which makes their taxonomic affinity challenging to assess. While leiosphaerids are likely eukaryotic, some structures that would be considered in the smooth walled category may not be eukaryotic; this possibility is dealt with in subsequent analyses of the data.
Ornamented
These fossils are defined as closed, organic walled structures with surface ornamentation, but no external processes. Examples include a variety of acritarch taxa including Valeria lophostriata. These structures have a higher likelihood of eukaryotic affinity than the smooth walled category due to their more complex exterior morphologies (Javaux et al. Reference Javaux, Knoll and Walter2004) and general larger size in the Proterozoic, however, they still may represent a polyphyletic group.
Asymmetrical Processes
These fossils are defined as closed, organic walled structures with external processes arranged asymmetrically across the surface of the vesicle. Examples include the acritarch genus Trachyhystrichosphaera. Because of their complex external morphological structure, these fossils can confidently be assigned to groups within the Eukarya (Javaux et al. Reference Javaux, Knoll and Walter2003). Further taxonomic affinities are challenging to determine, though both algal and fungal affinities have been proposed (e.g., Butterfield Reference Butterfield2005).
Symmetrical Processes
These fossils are defined as closed, organic walled structures with external processes arranged symmetrically across the surface of the vesicle. Examples include the acritarch genera Gyalosphaeridium and Alicesphaeridium. Due to their complex external morphological structure, these fossils can confidently be assigned to groups within the Eukarya including metazoans, microalgae, and possibly fungi as well (Knoll et al. Reference Knoll, Javaux, Hewitt and Cohen2006; Yin et al. Reference Yin, Zhu, Knoll, Yuan, Zhang and Hu2007; Moczydłowska et al. Reference Moczydłowska, Schopf and Willman2009; Cohen et al. Reference Cohen, Knoll and Kodner2009).
Vase Shaped Microfossils
Vase Shaped Microfossils (VSMs) refer to microfossils with variously shaped tests that in profile can resemble that of a vase, though morphologies are variable. These fossils are believed to be the preserved tests of Amoebazoan and Rhizarian organisms (Porter and Knoll Reference Porter and Knoll2000).
Macroeukaryotes
This category captures fossils that are larger than mm scale and confidently assigned to the Eukarya. Examples include various carbonaceous compression fossils such as Chuaria (Vidal et al. Reference Vidal, Moczydtowska and Rudavskaya1993) and macroscopic organic warty sheets found in the Taishir Formation of Mongolia (Cohen et al. Reference Cohen, Macdonald, Pruss, Matys and Bosak2015). We have excluded some macroeukaryotic fossils, such as Grypania, and other unnamed carbonaceous compression fossils, which cannot be confidently assigned to the Eukarya (Butterfield Reference Butterfield2009; Sharma and Shukla Reference Sharma and Shukla2009; Srivastava Reference Srivastava2012). While some of these macroscopic fossils may eventually be determined to be eukaryotic, we have erred on the side of caution by excluding them from these analyses. For many carbonaceous compression fossils, we follow the guidelines outlined in Xiao and Dong (Reference Xiao and Dong2006) to determine general consensus on the eukaryotic nature of contentious taxa.
Microscopic Multicellular
This category captures multicellular forms that are sub mm scale in size. Examples include various algal taxa such as Palaeovaucheria and Bangiomorpha (Butterfield Reference Butterfield2004; Butterfield Reference Butterfield2000).
Tests
This category captures fossils interpreted as eukaryotic tests that are not VSMs. The most conspicuous example is the putative ciliate tests found in Sturtian aged cap carbonates of Mongolia (Bosak et al. Reference Bosak, Macdonald, Lahr and Matys2011c). Fossils that are similar to VSMs but cannot confidently be placed within the VSM category are also included here.
Scales
This category captures the unique scale microfossils from the Fifteenmile Group, Yukon (Allison and Hilgert Reference Allison and Hilgert1986; Cohen and Knoll Reference Cohen and Knoll2012).
Other
This category captures enigmatic forms such as the “string of beads” inferred by some authors to be eukaryotic (Calver et al. Reference Calver, Grey and Laan2010).
Splitting vs. Lumping
There is a risk that diversity assessments can be affected by individual taxonomic assignments of authors. Thus, diversity could be inflated or deflated for a particular publication or stratigraphic unit because of the taxonomic techniques and standards used by a particular researcher. However, the scope of this project and the use of statistical techniques such as binning and the proportional composition of biotas through time help mitigate these biases. In addition, some discretion was applied when determining diversity as presented in the publications, that is, some taxa previously split were lumped.
Age Constraints
Age constraints for each fossil bearing stratigraphic unit were determined based on the current literature. Updated age constraints were determined for many fossil assemblages based on new geochronological data and on revised sequence and chemo stratigraphic correlations. Preference is given to precise U/Pb zircon dates, but other dating techniques are considered where these are lacking. See Appendix for data sources and information on age constraints of specific units.
In this review, we focus on the Mesoproterozoic and Neoproterozoic eras because few, if any, definitively eukaryotic fossils have been identified in the Paleoproterozoic. We treat the Mesoproterozoic as a whole due to the small number of fossiliferous assemblages. We subdivide the Neoproterozoic following the interim divisions approved by the International Commission on Stratigraphy (ICS). The ICS recommended shortening the Cryogenian Period, defining the base below the oldest Cryogenian glacial deposit. The Cryogenian Period is characterized by at least two global glaciations that left diamictites on every paleocontinent between 720 and 635 Ma (Condon et al. Reference Condon, Zhu, Bowring, Wang, Yang and Jin2005; Macdonald et al. Reference Macdonald, Schmitz, Crowley, Roots, Jones, Maloof, Strauss, Cohen, Johnston and Schrag2010b; Rooney et al. Reference Rooney, Strauss, Brandon and Macdonald2015). The base of the Cryogenian Period is thus taken here at 720 Ma; the Tonian is thus defined from between 1000–720 Ma. The Ediacaran is defined from between 635 Ma and 541 Ma; additional stage boundaries are not included here due to the relatively low number of fossil assemblages per stage.
Lithological, Taphonomic, Paleogeographic, and Environmental Assignments
Lithology was determined from data presented in each publication. Where more than one fossiliferous lithology was documented, this was taken into account. For example, if a single taxon was found in both carbonate and shale lithologies in a single publication, then the total diversity counted would only be one, but “carbonate” and “shale” would also both receive one diversity count each. Thus, the sum of the lithology diversity totals is potentially higher than the total diversity for that publication, if that publication describes multiple taxa from more than one lithology. This is noted when applicable. Preservational categories were also taken from each publication according to those documented by the authors.
Paleogeographic assignments were determined using information provided in each publication, along with recent refinements to the Proterozoic geological record and paleogeographic reconstructions. To avoid addressing all possible paleogeographic reconstructions, we plot Proterozoic fossil finds on a modern paleogeography (Fig. 3). This is sufficient for our purposes because we are concerned primarily with regional biases in reporting. However, these localities can easily be transferred to future paleogeographic maps to address issues of endemism and potential relationships between paleogeography and diversification.

Figure 3 Map of locations of fossiliferous stratigraphic units in this study. Dotted margins represent approximate Proterozoic paleo cratons used here.
Analytical Methods
All analyses were performed using our database and the statistical computing software R, v. 3.0.1. For box plots, mean and median within assemblage diversity was calculated for each Period with and without smooth walled acritarchs. Upper and lower “hinges” were calculated as the first and third quartiles (the 25th and 75th percentiles). For scatterplots, assemblages or publications were plotted using their mean ages and trend lines were calculated using LOESS smoothing (locally weighted polynomial regression). When the data allows, 95% confidence intervals were calculated and are shown around trend lines using a t-based approximation.
We used data based Monte Carlo simulation (Kowalewski and Novack Gottshall Reference Kowalewski and Novack-Gottshall2010) to evaluate the potential role of sampling in producing observed diversity trends. Within assemblage diversity values were randomly shuffled across all Periods, and for each Period a number of within assemblage diversity values equal to the number actually sampled from that Period were extracted without replacement and the mean within assemblage diversity calculated. We repeated this procedure 1000 times to produce 95% confidence intervals on mean within assemblage diversity values expected in the absence of any temporal trend. This was done with all data and then again without the two highest diversity assemblages.
Results
Overall Trends
Within assemblage diversity is low through the Mesoproterozoic Era and into the early to middle Tonian Period. Towards the end of the Tonian Period, within assemblage diversity increases, only to decline in the Cryogenian Period (Figs. 4, 5). A resurgence in within assemblage diversity occurs in the aftermath of the Marinoan aged glaciation, and appears to be relatively stable until the end of the Ediacaran Period when diversity drops off again. These overall patterns hold when the data is analyzed by publication and by formation and when the data is binned by Period (Figs. 4, 5, 6). Monte Carlo simulation of the data support both the low diversity in the Cryogenian, and the high diversity in the Ediacaran, though Mesoproterozoic and Tonian diversity is within 95% confidence intervals for random sampling (Fig. 7A). These trends hold even when the two highest diversity assemblages (the Doushantuo Formation and the Fifteenmile Group) are excluded (Fig. 7B). Importantly, low diversity assemblages persist throughout the entire Proterozoic. Thus, the increase in time bin mean within assemblage diversity is due to an increase in the maximum within assemblage diversity, not an increase in the minimum. Because the taxonomy of smooth walled microfossils is contentious, we also ran diversity analyses excluding all smooth walled taxa. These metrics show similar overall trends as the full data set, but with slightly lowered diversity in the earlier parts of the Proterozoic, and a decrease in the apparent higher diversity in the early Mesoproterozoic (Fig. 6B).

Figure 4 Within assemblage diversity (WAD) of all fossiliferous Proterozoic stratigraphic units. The height of each individual bar represents the total number of unique species or morphotypes described per stratigraphic unit; stratigraphic unit age uncertainties or ranges are shown as the width of each bar.

Figure 5 Scatterplot of within assemblage diversity (WAD; number of unique species or morphotypes described) in each publication or stratigraphic unit by the stratigraphic unit’s mean age. Trend line is LOESS smoothing (fitted locally). Grey shaded area represents 95% confidence intervals around the trend line using a t-based approximation. A, Diversity per publication. B, Diversity per stratigraphic unit.

Figure 6 Box and whisker plot showing a summary of WAD data (number of unique species or morphotypes) binned by Period. Horizontal lines are the median. The upper and lower box lines correspond to the first and third quartiles. The upper whisker extends to the highest value that is within 1.5 of the inter quartile range (IQR). The lower whisker extends to the lowest value within 1.5 * IQR of the hinge. Data beyond the end of the whiskers are outliers and plotted as points. Solid black diamond represents the mean. A, Per stratigraphic unit. B, Per stratigraphic unit with smooth walled acritarchs excluded.

Figure 7 Monte Carlo simulation of mean within assemblage diversity per Period. Open circles are the means of 1000 random means (without replacement). Filled triangles are true means per Period. Bars represent 95% and 5% confidence intervals on simulation means. A, All data. B, Doushantuo Formation and Fifteenmile Formation excluded from the analysis.
Our overall results are consistent with previous assessments that document an increase in diversity metrics through the Proterozoic and into the Ediacaran (e.g., Knoll et al. Reference Knoll, Javaux, Hewitt and Cohen2006, Vidal and Moczydłowska-Vidal Reference Vidal and Moczydłowska-Vidal1997, Huntley et al. Reference Huntley, Xiao and Kowalewski2006). However, our results represent a large increase in temporal resolution, especially with relation to Cryogenian diversity patterns.
Sensitivity to Stratigraphic and Lithological Biases
Sensitivity to Lithology
The fossil record of eukaryotes in the Proterozoic is dominated by shale hosted biota (Fig. 8). Thus, there is a risk that this dominance may be skewing the view of overall diversity, as shale is deposited in a limited set of depositional environments, predominantly deep water or quiet water settings restricted from open ocean conditions. The record of Proterozoic eukaryotes when shale hosted taxa are excluded is challenging to interpret because it is so data poor (Fig. 9). However, broad scale patterns of increased diversification through the Proterozoic remain apparent even without shale hosted taxa. This highlights the importance of new taphonomic windows, including carbonates; without them, the non shale hosted record of eukaryotic diversity would be uninterpretable.

Figure 8 Counts of fossil taxa described in each major lithology per Period. Carb=carbonate, Phosph=phosphorite.

Figure 9 Within assemblage diversity (number of unique species or morphotypes described) of fossiliferous Proterozoic stratigraphic units, excluding all shale hosted biota. The height of each individual bar represents the total diversity per formation; formation age uncertainties or ranges are shown as the width of each bar.
The predominance of shale preservation in the Proterozoic fossil record highlights the fact that changing dominance of taphonomic pathways and depositional environments over space and time affect our view of fossil diversity. For example, prior to the evolution of pelagic silica biomineralizing organisms, Proterozoic silicification occurred predominantly on carbonate platforms in peritidal settings (Maliva et al. Reference Maliva, Knoll and Siever1989), creating a relatively limited window for fossil preservation in shallow water carbonate environments. Conversely, preservation of organic walled taxa such as acritarchs is most common in quiet water siliciclastic settings. Although recent work has shown that carbonate rocks can also preserve organic walled tests and other organic structures (Bosak et al. Reference Bosak, Macdonald, Lahr and Matys2011c; Cohen et al. Reference Cohen, Macdonald, Pruss, Matys and Bosak2015), acritarchs are comparatively rare from carbonate macerations, suggesting taphonomic selectivity.
Biases may also be the product of diagenetic environments or sample preparation. For example, biomineralized structures are rare in siliciclastic settings. This may be due to the effects of different diagenetic pathways and preservation in differing lithologies. Alternatively, the lack may be due to the process by which these samples are prepared; traditional hydrochloric and hydrofluoric acid macerations techniques would destroy any existing biomineralized material present. Microfossils in siliciclastic lithologies can also be identified in thin section (Butterfield et al. Reference Butterfield, Knoll and Swett1994), but the use of thin sections of shale in Proterozoic paleontology is not widespread, and thus may not be prevalent enough to discount a bias against mineralized fossils in shale lithologies.
In general, formations with multiple lithologies have higher diversity. Examples include the Fifteenmile Group, which has carbonate and chert hosted biota, and the Doushantuo, which has fossils preserved in chert, shale, and phosphorites. This is unsurprising, but useful to consider when assessing diversity trends through time.
Sensitivity to Geographic Location of Collection
The majority of publications currently available document Proterozoic eukaryotic assemblages from Laurentia (Figs. 3, 10). When Laurentian localities are excluded from the analysis, the increase in diversity into the Ediacaran is clearly apparent, but the increase in diversity seen in the Tonian in global compilations disappears entirely (Fig. 11). Thus, areas of the record do seem sensitive to a “Laurentian bias”. This bias may be due to more micropaleontological work in North America than in other regions. Alternatively, in a macrostratigraphic framework, paleontological trends may be driven by the abundance of rock packages during specific intervals (Peters and Heim Reference Peters and Heim2010) (Fig. 10). An abundance of Mesoproterozoic and Neoproterozoic basins in North America may in part explain the corresponding relative abundance of fossil reports; this also creates a bias in the record towards particular basin forming events on Laurentia. For example, gaps in the middle Mesoproterozoic and early Tonian fossil record coincide with depositional hiatuses and limited basin formation on Laurentia, and a minimum in passive margin development globally (Bradley Reference Bradley2008). Thus, strengthening macrostratigraphic resolution for the Proterozoic will be key in assessing the influence of regional or basin scale dynamics on the fossil record.

Figure 10 Histogram of number of stratigraphic units by mean age, separated out by craton. Only cratons with more than two fossiliferous stratigraphic units are shown. Note the peak in Laurentian diversity in the mid late Tonian, and gap in the earliest Neoproterozoic.

Figure 11 Scatterplot of total within assemblage diversity (number of unique species or morphotypes described) from non Laurentian localities described in each stratigraphic unit by its mean age. Trend line is LOESS smoothing (fitted locally). Grey shaded area represents 95% confidence intervals around the trend line using a t-based approximation. WAD=within assemblage diversity.
Sensitivity to Age Uncertainties
Many stratigraphic units in our compilation have age constraints greater than 50 million years (Fig. 4, Supplementary Appendix) and the lack of better age constraints puts limits on the interpretive power of some aspects of our dataset. This emphasizes the importance of additional work on age constraints and correlations. For example, until recently, fossiliferous strata from Death Valley now interpreted as late Tonian (Macdonald et al. Reference Macdonald, Prave, Petterson, Smith, Pruss, Oates, Waechter, Trotzuk and Fallick2013) were believed to be Cryogenian in age (Corsetti et al. Reference Corsetti, Awramik and Pierce2003), which would have elevated the diversity of that time bin by 40%.
Noticeable Data Gaps
The newly compiled data and age constraints suggest that there is a gap in fossil data in the early Tonian (Fig. 4). This gap coincides with an apparent low in deposition on Laurentia (Fig. 10), and thus may be an artifact of rock availability on the most dominant craton in the Tonian. If so, this compilation presents a new perspective on sampling strategies. The late Tonian to Cryogenian rifting of the supercontinent Rodinia created a late Neoproterozoic peak in the abundance of passive margin deposits (Bradley Reference Bradley2008; Fig. 10). Similarly, there is an apparent increase in within assemblage diversity during the late Mesoproterozoic from ca. 1250 to 1000 Ma, but this may just be due to the lack of well studied early Mesoproterozoic (1600–1250 Ma) deposits. Currently, early Mesoproterozoic assemblages are dominated by smooth walled taxa of uncertain taxonomic affinity (Fig. 12), and the discovery of one moderately diverse early Mesoproterozoic fossil assemblage would eliminate the apparent late Mesoproterozoic diversification. Thus, it is difficult to argue for a robust increase in within assemblage diversity until the late Tonian Period.

Figure 12 Number and type of fossil categories within each stratigraphic unit. Each bar represents one stratigraphic unit, colors represent the number of described species or morphotypes from each of the fossil categories, total height represents the total number of described species or morphotypes per stratigraphic unit. Bars above each stratigraphic unit code represent the fossil bearing lithologies of that unit. WAD=within assemblage diversity.
The Carbonate Taphonomic Window
Recent work has shown that carbonate rocks can host diverse Proterozoic fossil assemblages (Figs. 8, 12) (Bosak et al. Reference Bosak, Lahr, Pruss, Macdonald, Gooday, Dalton and Matys2011a,Reference Bosak, Lahr, Pruss, Macdonald, Dalton and Matysb,Reference Bosak, Macdonald, Lahr and Matysc; Cohen and Knoll Reference Cohen and Knoll2012; Cohen et al. Reference Cohen, Macdonald, Pruss, Matys and Bosak2015). The addition of the carbonate hosted window fundamentally changes the record of eukaryotes in the Proterozoic by populating the Cryogenian nonglacial interlude, as well as creating a new search image for future paleontological research. In addition, the types of fossils preserved in carbonate are different from those preserved in other lithologies, especially shale (Fig. 12). Thin organic walled microfossils such as acritarchs are not often preserved in carbonate successions, whereas more robust forms such as the Fifteenmile scale microfossils and putative ciliate tests from the Taishir Formation of Mongolia are (Cohen and Knoll Reference Cohen and Knoll2012; Cohen et al. Reference Cohen, Schopf, Butterfield, Kudryavtsev and Macdonald2011; Bosak et al. Reference Bosak, Macdonald, Lahr and Matys2011c). Thus, while the carbonate window provides an additional and important view of Proterozoic diversity, it also serves as a reminder that no single lithology can accurately capture the true fossil diversity of any time period in Earth history (e.g., Porter Reference Porter2004).
Importantly, most of the carbonate hosted microfossils have been recovered from a very narrow temporal window in the ~10 Myr after the ca. 717–660 Ma Sturtian glaciation. This may be due to a biased sampling strategy focused on the aftermath of Snowball Earth events. Alternatively, rapid depositional rates (Rooney et al. Reference Rooney, Macdonald, Strauss, Dudás, Hallmann and Selby2014) and the peculiar carbonate environments of a post Snowball world (Pruss et al. Reference Pruss, Bosak, Macdonald, McLane and Hoffman2010) may have facilitated preservation of these fossils. This can only be addressed with more systematic searches for acid resistant fossils in carbonate rocks throughout the Neoproterozoic
Distribution of Fossil Categories
Temporal Patterns of Fossil Categories
Some fossil categories show variability in within assemblage diversity through the Proterozoic, while others do not (Figs. 12, 13). For example, smooth walled acritarchs show little variability in their diversity over the Proterozoic, maintaining low within assemblage diversity through the entire Proterozoic. As noted earlier, smooth walled acritarchs are likely polyphyletic, and have little identifiable morphology, making trends in diversity challenging to asses. On the other hand, with so few morphological features, convergence is likely, and there could be patterns within the data that are essentially invisible. The same lack of variability is apparent for ornamented acritarchs (Fig. 13) perhaps for the same reasons: groups that have lower taxonomic specificity will inherently have less of a temporal pattern. Other groups, such as acritarchs with symmetrical processes, VSMs, and macroeukaryotes, have distinct temporal trends (Fig. 13). Some of this pattern is due to evolutionary innovation—for example, sampling of shale in the Proterozoic is high enough that it is unlikely that we are missing many symmetrically acanthomorphic acritarchs or eukaryotic carbonaceous compressions in older strata. Thus, we feel confident that the patterns of within assemblage diversity seen in these groups in our data are real. Other groups may show temporal patterns because they are newly discovered or represent a new taphonomic window (i.e., the Fifteenmile Group scale microfossils). Thus, data on a specific category of fossil must be interpreted in light of factors that may influence its occurrence in the sedimentary record as well as in the literature.

Figure 13 Scatterplot of the number of described species or morphotypes in each stratigraphic unit by the unit’s mean age, separated by each fossil category. Scales not shown as they only have one occurrence. WAD=within assemblage diversity.
Distribution of Resistant Taxa
Taxa categorized as resistant, which include VSMs, other tests, and scales, have only been described in late Tonian and Cryogenian strata with one exception (Fig. 14). As we would expect more resistant taxa to have a more complete fossil record, this suggests that there is a true lack of these fossils in Ediacaran and Mesoproterozoic strata. However, lithological and sampling biases may yet play a role, as there is a lack of published microfossil assemblages and studies on Ediacaran carbonates, and many of the older resistant forms have been described from carbonate environments (e.g., Cohen and Knoll Reference Cohen and Knoll2012; Bosak et al. Reference Bosak, Lahr, Pruss, Macdonald, Gooday, Dalton and Matys2011a). The Ediacaran has more lithological units sampled per million years than the rest of the sampled Periods (Fig. 15), so we cannot account for the lack of resistant taxa in shale, chert, and phosphorite through a lack of sampling.
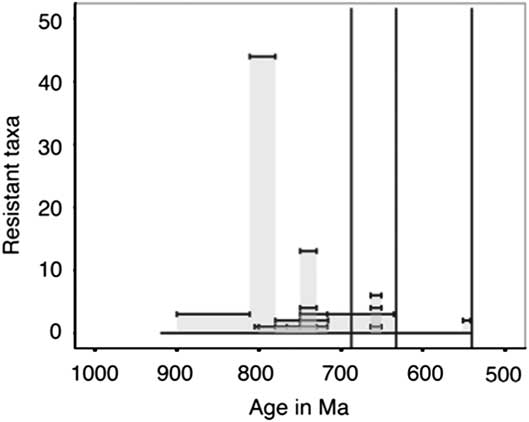
Figure 14 Within assemblage diversity of taxa categorized as resistant (VSMs, tests, and scales). The height of each individual bar represents the total number of described species or morphotypes per stratigraphic unit; stratigraphic unit age uncertainties or ranges are shown as the width of each bar.

Figure 15 A, Correlation between mean diversity (the number of described species or morphotypes) per Period and the number of stratigraphic units with described fossil assemblages per Period. B, Correlation between mean diversity (the number of described species or morphotypes) per Period and the number of stratigraphic units per Ma duration of Period. The length of the Cryogenian has been shortened to account for the amount of time now estimated that sediments were being deposited during the two glacial events. Cry=Cryogenian, Ed=Ediacaran, Mes=Mesoproterozoic, Ton=Tonian.
Discussion
Diversity Patterns in Relation to Ecological Factors
Relationship to Eukaryotic Clade Diversification
Molecular clock estimates calibrated from the fossil record (e.g., Parfrey et al. Reference Parfrey, Lahr, Knoll and Katz2011) indicate that major eukaryotic groups originated in the Paleoproterozoic and Mesoproterozoic eras, and further diversified during the Neoproterozoic. The Mesoproterozoic and early Neoproterozoic records are currently too scant to corroborate the earliest branches in the eukaryotic tree with fossil data. These clocks are calibrated with key fossils such as ca. 1100 Ma Bangiomorpha (Turner and Kamber Reference Turner and Kamber2012; Butterfield et al. 2000), interpreted as a crown group red alga, the ca. 800 Ma Paleovaucheria, interpreted as a crown group Vaucherian (chromalveolate) alga, ca. 800 Ma Proterocladus, interpreted as a crown group green alga (Butterfield Reference Butterfield2004; 2011), and ca. 742 Ma VSM taxa from the Chuar and Callison Lake formations representing amoebozoans and rhizarians (Porter and Knoll Reference Porter and Knoll2000; Strauss et al. Reference Strauss, Rooney, Macdonald, Brandon and Knoll2014). Thus, although within assemblage fossil diversity remains low until the late Tonian, eukaryotic clade originations are high during the Tonian, with at least four Tonian taxa that can be attributed to eukaryotic crown groups appearing in the fossil record, and molecular clock results showing a large number of inferred originations before the late Tonian (Parfrey et al. Reference Parfrey, Lahr, Knoll and Katz2011). During the Cryogenian, putative foraminifera (Bosak et al. Reference Bosak, Lahr, Pruss, Macdonald, Gooday, Dalton and Matys2011a) and ciliates (Bosak et al. Reference Bosak, Macdonald, Lahr and Matys2011c) appear at ca. 660 Ma. These three data sets—within assemblage fossil diversity, crown group FADs, and molecular clock estimates—indicate a possible discrepancy between within assemblage diversity and the origination of major eukaryotic clades (Fig. 16).

Figure 16 Overview of major events and fossil diversity in the Proterozoic. Carbon isotope data compiled from Macdonald et al. (2009, 2010), Halverson et al. (Reference Halverson, Wade, Hurtgen and Barovich2010), and Cox et al. (unpublished). SE=Shuram carbon isotope excursion, Tr=Trezona carbon isotope excursion, Tai=Taishir carbon isotope excursion, ICIE=Islay carbon isotope excursion, BSS=Bitter Springs stage, SGE=Sturitian aged glacial event, MGE=Marinoan aged glacial event, GGE=Gaskiers aged glacial event. Trend line and confidence interval for within assemblage fossil diversity from Figure 5. Eukaryotic clade ranges from this analysis.
Role of Predation in Eukaryotic Diversification
Was the microeukaryotic diversification seen in the Tonian and Ediacaran driven by predation? The presence of ornate mineralized scales (apatitic scale microfossils, or ASMs) in the mid Tonian Fifteenmile Group, Yukon, has been suggested to be a response to protistan predation pressure (Cohen et al. Reference Cohen, Schopf, Butterfield, Kudryavtsev and Macdonald2011; Porter Reference Porter2011). This hypothesis is supported by the interpretation of some VSMs as predatory amoeba (Porter Reference Porter2011). In fact, many single celled eukaryotes can predate on other eukaryotes of a similar or even larger size (Fenchel Reference Fenchel1968; Han et al. Reference Han, Wang, Lin and Dumont2007; Sayre Reference Sayre1973). More broadly, the role of predation in the fossil record has often been invoked to explain diversification events in the history of life (Stanley Reference Stanley1973; Vermeij Reference Vermeij1977; Huntley and Kowalewski Reference Huntley and Kowalewski2007). One issue with predation driven hypotheses is that the Fifteenmile scale microfossils do not co exist with VSM fossils, and the majority of VSM occurrences appear approximately 40 Myr later in the Tonian. However, other heterotrophic predatory eukaryotes may have co existed with the ASM taxa, perhaps not leaving behind a robust fossil record. In addition, we would expect protistan predation to increase, or at least remain relatively constant throughout the Proterozoic, thus presenting a puzzle—why do resistant forms stop appearing in the fossil record before the Marinoan glaciation?
The Question of the VSMs
As noted in our analyses, VSMs are relatively common during the late Tonian, yet are apparently absent in the early Tonian, Cryogenian, and Ediacaran (Porter and Knoll Reference Porter and Knoll2000; Strauss et al. Reference Strauss, Rooney, Macdonald, Brandon and Knoll2014). Many of these VSMs have been assigned to modern eukaryotic clades that contain strikingly similar taxa. Thus, a conundrum is presented—were testate amoeba not forming tests during the Cryogenian, Ediacaran and the majority of the Phanerozoic? Are the Tonian VSMs phylogenetically related to modern testate amoeba or was there an extinction and re evolution of test formation in amoeboid groups? Alternatively, perhaps there is taphonomic bias present in Ediacaran and Phanerozoic lithologies that reduces the likelihood of preservation? One interesting possibility is provided by the fact that in the modern, testate amoeba are most common in lacustrine environments, so perhaps these organisms experienced a change in environmental distribution and tolerance, which affected their preservation potential.
Relationship to Metazoan Origins and Diversification
While we have assumed thus far that fossils in our database reflect non metazoan eukaryotes, some component of this record, especially the Ediacaran acanthomorphic acritarchs, may actually be a record of metazoans (Yin et al. Reference Yin, Zhu, Knoll, Yuan, Zhang and Hu2007; Cohen et al. Reference Cohen, Knoll and Kodner2009). Thus, this record is not necessarily entirely complementary, but may have taxonomic overlap with a record of metazoan diversification. Molecular clocks of metazoans indicate a deep branching in the later Neoproterozoic, with the roots of the metazoan clade seeded within latest Tonian to Cryogenian (Erwin et al. Reference Erwin, Laflamme, Tweedt, Sperling, Pisani and Peterson2011). Molecular data has thus given us a rich picture of what we expect to find in the fossil record. However, the search for early metazoans has thus far been limited to biomarkers from 711–635 Ma rocks in Oman (Love et al. Reference Love, Grosjean, Stalvies, Fike, Grotzinger, Bradley, Kelly, Bhatia, Meredith, Snape, Bowring, Condon and Summons2008) and various fossils of uncertain taxonomic affinity (e.g., Maloof et al. Reference Maloof, Rose, Beach, Samuels, Calmet, Erwin, Poirier, Yao and Simons2010). It is possible that other fossils categorized here as non metazoan eukaryotes actually represent early branching or stem metazoans but are unrecognizable as such. The earliest metazoans would have had physiologies very similar to their microeukaryote cousins, thus it is reasonable to assume that any forces (such as changing redox conditions) that influenced non metazoan eukaryotic diversification would also affect metazoan eukaryotes.
Diversity Patterns in Relation to Tectonic and Geochemical Factors
The Effects of Snowball Earth Events
What were the effects of global glaciation (a.k.a. Snowball Earth) on microeukaryotes? Our only robust view of eukaryotic life in the Cryogenian nonglacial interlude comes from a limited number of low diversity carbonate samples from Mongolia and Namibia (Bosak et al. Reference Bosak, Lahr, Pruss, Macdonald, Gooday, Dalton and Matys2011a,Reference Bosak, Lahr, Pruss, Macdonald, Dalton and Matysb,Reference Bosak, Macdonald, Lahr and Matysc; Dalton et al. Reference Dalton, Macdonald, Lahr and Pruss2013) and shale hosted biota from Australia (Riedman et al. 2014). Prior to the identification of the carbonate window it had previously been suggested that the Cryogenian Period was variously depauperate, or contained the rich Fifteenmile scale biota (Kaufman et al. Reference Kaufman, Knoll and Awramik1992) and VSMs of the Pahrump Group (Corsetti et al. Reference Corsetti, Awramik and Pierce2003), however, this was based on the absence of fossils other than leiospheres in Australian drill cores and poor age models (Macdonald et al. 2010a,Reference Macdonald, Schmitz, Crowley, Roots, Jones, Maloof, Strauss, Cohen, Johnston and Schragb; Macdonald and Cohen Reference Macdonald and Cohen2011). Recent geochronological constraints have trimmed the duration of the Cryogenian nonglacial interlude to between 660 and 635 Ma (Zhou et al. Reference Zhou, Tucker, Xiao, Peng, Yuan and Chen2004; Condon 2005; Rooney et al. Reference Rooney, Macdonald, Strauss, Dudás, Hallmann and Selby2014), which indicates this interval may be additionally biased by its narrow temporal range. In addition, much of the Cryogenian record is composed of glacial diamictites that are not well suited to preserving microfossils. If we consider that approximately two thirds of Cryogenian strata formed during global glaciations, this lithological difference could have strongly biased fossil preservation rates.
The Cryogenian carbonate hosted fossils that have been discovered in recent years all come from the Cryogenian nonglacial interlude. Our understanding of life during the glaciations themselves may remain elusive, due to a reduction of normal sedimentation during ice coverage. Molecular clocks, calibrated with older fossil occurrences, allow us a glimpse into the evolution of eukaryotes at this time. These results indicate that major diversifications were occurring during the Cryogenian (Parfrey et al. Reference Parfrey, Lahr, Knoll and Katz2011). However, if eukaryotic communities were provincial, surviving in small population sizes in relatively small geographic areas, the limited sampling from the Cryogenian nonglacial interlude is likely not adequate to capture the full record of evolutionary innovation. Geographic isolation may also be responsible for the diversification of eukaryotic groups during the Cryogenian. Several recent studies have documented evidence of geographic isolation and divergence in modern protist groups (Boenigk et al. Reference Boenigk, Pfandl, Garstecki, Harms, Novarino and Chatzinotas2006; Foissner et al. Reference Foissner, Chao and Katz2007; Casteleyn et al. Reference Casteleyn, Leliaert, Backeljau, Debeer, Kotaki, Rhodes, Lundholm, Sabbe and Vyverman2010), suggesting that protists in modern ecosystems are not cosmopolitan. As such, global glaciation may have potentially stimulated diversification, while keeping overall abundance low.
Despite the issues outlined above, fossil sampling of the Cryogenian is much more complete than it was a decade ago (e.g., Riedman et al. 2014). The question arises then as to whether the signal of low diversity and depauperate fossil assemblages is real, or a bias of the record as described above (Fig. 5). In order to test the robustness of the low diversity seen in the Cryogenian nonglacial interlude, we ran a Monte Carlo simulation (Figure 7) which shows that the within assemblage diversity in the nonglacial interlude is lower than would be expected from a random distribution of the diversity data.
To further analyze the unique nature of the Cryogenian, we plotted the number of stratigraphic units per period against the mean diversity in that period (Fig. 15A). At first glace, the low mean diversity of assemblages in the Cryogenian is consistent with the low number of sampled stratigraphic units (Fig. 15A). However, the Cryogenian stands out in stark contrast to the Ediacaran, which has a similar number of fossiliferous stratigraphic units, but a much higher mean diversity. When the same data is plotted against the number of stratigraphic units per million years, and the Cryogenian is constrained only to the nonglacial interlude, the Cryogenian again stands out as an outlier with respect to mean diversity (Fig. 15B). Whether or not this is exclusively a true biological signal, or an artifact of the nonglacial period’s short temporal time span and unique sedimentological regime remains an open question.
Nonetheless, the current record does preserve a remarkable turnover in eukaryotic microfossils from diverse assemblages of resistant tests and microscopic multicellular eukaryotes to low diversity assemblages of agglutinating tests in the Cryogenian nonglacial interlude, and a radiation of acritarchs with symmetrical processes and algal taxa in the Ediacaran (Fig. 12). Thus, it is clear that many clades of eukaryotes survived the Snowball earth events, but different members of those clades appeared both between and after the both global glaciations. Further work is needed both to confirm this apparent trend, as well as to understand taxonomic selectivity across the glaciations.
Break up of Rodinia: Weathering and Biomineralization
The apparent coincidence of the break up of the supercontinent Rodinia (Li et al. Reference Li, Bogdanova, Collins, Davidson, De Waele, Ernst, Fitzsimons, Fuck, Gladkochub, Jacobs, Karlstrom, Lu, Natapov, Pease, Pisarevsky, Thrane and Vernikovsky2008) and the diversification of eukaryotes including the origin of the metazoan clade, is striking, and has been noted by several authors (Valentine and Moores Reference Valentine and Moores1970; Dalziel Reference Dalziel1997; Hoffman Reference Hoffman1998; Fig. 16). Potential driving mechanisms could include an increase in geographic isolation driving allopatric speciation, but assessing the likelihood of this hypothesis will require a better handle on both taxonomy and paleogeography in the Neoproterozoic.
Although the timing and nature of the break up of Rodinia is still debated (for a recent review, see Evans Reference Evans2013), it is apparent that several margins began to rift between ca. 830 and 780 Ma with the deposition of continental deposits in narrow grabens (Wang et al. Reference Wang, Li, Li, Li and Zhang2011; Li et al. Reference Li, Evans and Halverson2013), which coincided with the emplacement of the ca. 830 Ma composite Guibei Willouran large igneous province (LIP) in South China and Australia and the ca. 780 Ma Gunbarrel and Kanding LIPs of western Laurentia and South China (Fig. 16; Wingate et al. Reference Wingate, Campbell, Compston and Gibson1998; Li et al. Reference Li, Li, Kinny and Wang1999; Ernst et al. Reference Ernst, Wingate, Buchan and Li2008; Wang et al. Reference Wang, Li, Li, Li, Liu, Yang, Liang and Tu2008).
Rifting of Rodinia and the widespread emplacement of large igneous provinces may have led to a myriad of chemical changes in the ocean that culminated in both evolutionary and climate change. A long term rise in strontium isotope values in carbonates through the Tonian are consistent with low latitude rifting, an increase in continental margin length, and increased global silicate weathering (Halverson et al. Reference Halverson, Wade, Hurtgen and Barovich2010). This rise in strontium isotope values through the Tonian is stalled by short term falls coincident with the emplacement of unradiogenic LIPs (Halverson et al. Reference Halverson, Wade, Hurtgen and Barovich2010). On average, basalt contains ~3 times as much phosphorus as granite (Ronov Reference Ronov1982; Halverson et al. Reference Halverson, Cox, Hurtgen, Sansjofre, Kunzmann, Strauss and Macdonald2014; Cox et al. unpublished) and the low latitude weathering of extensive LIPs between 820 and 720 Ma may have led to an additional increase in phosphorous delivery to the oceans. Fe speciation studies through Tonian and Cryogenian strata have found predominantly anoxic and ferruginous subsurface conditions (Poulton and Canfield Reference Poulton and Canfield2011) with oxic shallow water (Sperling et al. Reference Sperling, Halverson, Knoll, Macdonald and Johnston2013) and local euxinia through organic carbon loading (Johnston et al. Reference Johnston, Poulton, Dehler, Porter, Husson, Canfield and Knoll2010). These conditions are ideal for the “Fe-P shuttle” (Berner Reference Berner1973; Poulton and Canfield Reference Poulton and Canfield2006; Creveling et al. Reference Creveling, Johnston, Poulton, Kotrc, März, Schrag and Knoll2013) and enhanced delivery of phosphorite to the ocean, which may have been limited in the Mesoproterozoic, not only by the lack of weatherable phosphorous rich basalts, but also by low surface oxygenation and a riverine phosphorous trap (Laakso and Schrag Reference Laakso and Schrag2014). If phosphate was the limiting factor on primary productivity during the Tonian Period, then an increase in both total silicate weathering and the weathering of phosphorous rich basalts may have allowed sufficient phosphorous to skip the riverine trap and resulted in both an increase in primary productivity in the oceans, fractional organic carbon burial, and free oxygen. These ideas are consistent with a rise in phosphorous iron ratios recorded in iron formation in Sturtian glacial deposits (Planavsky et al. Reference Planavsky, Rouxel, Bekker, Lalonde, Konhauser, Reinhard and Lyons2010). As discussed below, δ13C data is also consistent with an increase in fractional organic carbon burial during the early Tonian Period, although other factors are likely at play in driving variability in δ13C records (e.g., Schrag et al. Reference Schrag, Higgins, Macdonald and Johnston2013).
Studies in modern ecosystems indicate that increasing nutrients, including phosphate, are positively correlated with biodiversity and species richness over large spatial and temporal scales (Chase and Leibold Reference Chase and Leibold2002). Modern studies of phosphate are mainly restricted to lacustrine environments, as P is less limiting than other key nutrients in the modern ocean. However, as noted above, P may have been more limiting in late Mesoproterozoic to early Neoproterozoic marine ecosystems, thus providing a potential abiotic control on eukaryotic diversification. Increased phosphorous concentrations in the ocean would have also increased the availability of phosphate for biomineralization. Indeed, the first occurrence of phosphatic biomineralization in eukaryotes (Cohen et al. Reference Cohen, Schopf, Butterfield, Kudryavtsev and Macdonald2011) occurs directly on the heels of the emplacement of the ca. 830 Ma LIPs in South China and Australia (Wingate et al. Reference Wingate, Campbell, Compston and Gibson1998; Li et al. Reference Li, Li, Kinny and Wang1999; Wang et al. Reference Wang, Li, Li, Li, Liu, Yang, Liang and Tu2008).
The rifting of the supercontinent Rodinia may have not only changed chemical environments, but also physical environments. Thermal subsidence of many continental margins (Bradley Reference Bradley2008) increased the area of near shore and epicontinental sedimentary environments (Li et al. Reference Li, Evans and Halverson2013), thus increasing habitat area for eukaryotes living in relatively shallow near shore environments, including early metazoans. In addition, organisms living in near shore environments have a higher chance of being preserved in the sedimentary record. Quantifying the potential bias for more epicontinental preservation will require a macrostratigraphic analysis (c.f. Peters and Heim Reference Peters and Heim2010) of Proterozoic sedimentary records.
Relationship to Geochemical Proxies for Ocean Oxygenation
Hypotheses to explain the origin and radiation of metazoans commonly call on a Neoproterozoic rise of oxygen (Cloud Reference Cloud1968; Rhoads and Morse Reference Rhoads and Morse1971; Knoll Reference Knoll1999), however, increasing oxygen levels do not provide a driving mechanism for the generation of biodiversity (Marshall Reference Marshall2006; Erwin et al. Reference Erwin, Laflamme, Tweedt, Sperling, Pisani and Peterson2011). In fact, early animals may not have required elevated oxygen levels (Mills et al. Reference Mills, Ward, Jones, Sweeten, Forth, Treusch and Canfield2014), but rather oxygenation was likely more important for metabolically expensive activities like predation (Knoll and Sperling Reference Knoll and Sperling2014). The role of oxygen in the radiation of eukaryotes is even less clear. Almost all eukaryotes require some amount of free oxygen, though many modern taxa live in low to dysoxic environments for extended periods of time, and some can live in anoxic environments for weeks to months (Heinz and Geslin 2012). Thus, it is unlikely that Neoproterozoic oxygen levels in and of themselves would have directly constrained the radiation of eukaryotic groups.
Moreover, independent geochemical evidence for a Neoproterozoic oxygenation event is not well resolved in space and time. The concept of a Neoproterozoic oxygenation event was reviewed (Kah and Bartley Reference Kah and Bartley2011) and extended by Och and Shields (Och and Shields-Zhou Reference Och and Shields-Zhou2012) who used molybdenum, uranium, and vanadium concentrations to argue that a rise in oxygen had occurred by the Ediacaran, but the lack of analyses on Cryogenian samples precluded an understanding of the relationship to glaciation. An early Ediacaran rise in oxygen was also suggested from molybdenum, uranium, vanadium concentration measurements and sulfur isotope analyses (Partin et al. Reference Partin, Bekker, Planavsky, Scott, Gill, Li, Podkovyrov, Maslov, Konhauser, Lalonde, Love, Poulton and Lyons2013; Sahoo et al. Reference Sahoo, Planavsky, Kendall, Wang, Shi, Scott, Anbar, Lyons and Jiang2013), however, it has remained uncertain if there was an earlier rise, and if oxygen levels remained high throughout the Ediacaran (Johnston et al. Reference Johnston, Poulton, Tosca, O'Brien, Halverson, Schrag and Macdonald2013). In fact, statistical analysis of iron geochemical data does not show a significant change through the Ediacaran and Cambrian periods (Sperling et al. 2015).
Planavsky et al. (Reference Planavsky, Reinhard, Wang, Thomson, McGoldrick, Rainbird, Johnson, Fischer and Lyons2014) used Cr isotope studies to argue for an increase in oxygen at ca. 810 Ma to >0.1% PAL. This would seem to correlate nicely with the appearance of several eukaryotic clades in the fossil record (Fig. 16); however, this estimate is model dependent and lacks global coverage from earlier strata to substantiate that it represents a significant rise.
If oxygenation was a trigger to diversification, it is likely that the effects of rising oxygen were felt by eukaryotes most strongly through oxygen’s effects on the bioavailability of other elements and nutrients, and food webs, as opposed to through oxygen concentrations themselves (e.g., Anbar and Knoll Reference Anbar and Knoll2002). Examples of these effects can be found by looking at experiments on metal utilization among modern eukaryotes as well as examining genomic information to determine the metal co factor needs of ancient eukaryotic groups. For example, work by Dupont and colleagues (Reference Dupont, Butcher, Valas, Bourne and Caetano-Anollés2010) indicates that eukaryotes use relatively late evolving proteins for Zn, Ca, and Fe utilization as compared to akaryote relatives. Eukaryotes depend on Zn for a variety of protein functions, and Zn is less bio available in the low oxygen conditions, and is thus presumed to have been low early in the Proterozoic (Saito et al. Reference Saito, Sigman and Morel2003). Thus, increasing levels of atmospheric oxygen would have enabled eukaryotes to better access key bio elements. While the picture of redox changes in global oceans during the Proterozoic is not yet clear, if a rise in oxygen facilitated eukaryotic diversification, it likely did so through a limited rise past critical ecological thresholds (Sperling et al. 2015).
Evolution of Sinking, Carbon Burial, and the Carbon Cycle
One interesting implication for the temporal distribution of resistant taxa (Fig. 14) is the role that such resistant structures may play in increasing the rate of sinking of organic matter to the seafloor. Tziperman et al. (Reference Tziperman, Halevy, Johnston, Knoll and Schrag2011) proposed that the radiation of eukaryotes in the Neoproterozoic could be partially responsible for fluctuations the carbon cycle and the initiation of Snowball Earth (Tziperman et al. Reference Tziperman, Halevy, Johnston, Knoll and Schrag2011). Specifically, they implicate biomineralized taxa and larger eukaryotic cell sizes as a potential trigger for increased sinking, complementing the hypotheses discussed above that the rifting of Rodinia, increased basin formation, weathering, and phosphorous delivery to the ocean all could have led to increased organic carbon export, burial, and anaerobic remineralization. Ultimately, the long term oxygenation of the oceans must have been driven by the removal of reduced carbon from the ocean atmosphere system into the sedimentary reservoir, and while increased basin formation with the rifting of Rodinia provided the backdrop for this change, organic carbon sequestration was likely aided by increased productivity and sinking. Thus, the record of increased diversification and the timing of recalcitrant tests and scales documented here supports the hypothesis of positive feedbacks between tectonics, evolutionary innovations and changing oceanographic and geochemical conditions.
Conclusions
Our new analysis of the Proterozoic eukaryotic fossil record indicates that within assemblage diversity rose through the Proterozoic, especially during the late Tonian and Ediacaran. The overall rise documented here is due in large part to an increase in the number of high diversity assemblages; low diversity assemblages remain common throughout the Proterozoic. Diversity is low in the Cryogenian nonglacial interlude, likely due to a combination of biological factors coupled with rock record and sampling biases. In general, lithological, taphonomic, and sampling biases do persist and can influence our view of the tempo and mode of eukaryotic fossil diversity. Despite these biases, our results indicate that eukaryotic ecosystems became more complex and diverse through the Proterozoic. In addition, this re-analysis sheds light on the intricate relationship between biotic and abiotic events in the Proterozoic, including changing redox conditions, rising oxygen levels, glacial episodes, and supercontinent breakup, and hints at complex feedbacks between evolution of life and the environment. A closer assessment of the overall trends as well as the biases inherent in the Proterozoic fossil record also allows us to move forward with a clearer picture of sampling strategies. This analysis provides a framework into which future paleontological and geobiological sampling and research can be placed, allowing for a more holistic view of Proterozoic Earth system dynamics.
Acknowledgements
We thank S. Finnegan, B. Heggeseth, B. Kotrc, J. McKay, and S. Peters for technical assistance and feedback. This paper was improved by reviews from S. Xiao and J. Huntley. Support was provided by a National Aeronautics and Space Administration Astrobiology Institute grant through the Massachusetts Institute of Technology and Williams College.
Supplementary Material
Supplemental material deposited at Dryad: doi:10.5061/dryad.5pc3g


 Open access