


1. Introduction
To understand the source to sink relationships in a sedimentary basin it is crucial to comprehend the coupling between regional and local tectonics, together with climate changes and hinterland geomorphology. Interest has therefore increased on the onshore–offshore relationship to study the relation between climate and tectonics (e.g. Riis, Reference Riis1996; Gabrielsen et al. Reference Gabrielsen, Braathen, Olesen, Faleide, Kyrkjebø, Redfield, Wandås, Nystuen, Eide and Gradstein2005, Reference Gabrielsen, Faleide, Pascal, Braathen, Nystuen, Etzelmuller and O’Donnell2010; Stoker et al. Reference Stoker, Praeg, Shannon, Hjelstuen, Laber, Nielsen, Van Weering, Sejrup, Evans, Doré and Vinning2005; Japsen et al. Reference Japsen, Bonow, Green, Chalmers and Lidmar-Bergström2006; Nielsen et al. Reference Nielsen, Gallagher, Leighton, Balling, Svenningsen, Jacobsen, Thomsen, Nielsen, Heilmann-Clausen, Egholm, Summerfield, Clausen, Piotrowski, Thorsen, Huuse, Abrahamsen, King and Lykke-Andersen2009; Medvedev, Souche & Hartz, Reference Medvedev, Souche and Hartz2013; Miller et al. Reference Miller, Sak, Kirby and Bierman2013; Redfield & Osmundsen, Reference Redfield and Osmundsen2013).
It is evident from observations of siliciclastic wedges in the eastern North Sea basin that the source area of terrigenous detritus changed from being situated to the west during Paleocene and Eocene times to becoming mainly situated to the north (i.e. southern Norway) during Oligocene time (e.g. Jordt et al. Reference Jordt, Faleide, Bjørlykke and Ibrahim1995; Jordt, Thyberg & Nøttvedt, Reference Jordt, Thyberg, Nøttvedt, Nottvedt, Larsen, Gabrielsen, Olaussen, Brekke, Torudbakken, Birkelnad and Skogseid2000; Michelsen et al. Reference Michelsen, Danielsen, Heilmann-Clausen, Jordt, Laursen, Thomsen and Steel1995; Faleide et al. Reference Faleide, Kyrkjebø, Kjennerud, Gabrielsen, Jordt, Fanavoll, Bjerke, Dorè, Cartwright, Stoker, Turner and White2002). It has previously been proposed that observed changes in the sedimentary pattern at the Eocene–Oligocene boundary of North Europe was due to tectonic uplift of Scandinavia and associated subsidence in the adjacent North Sea basin (e.g. Jordt et al. Reference Jordt, Faleide, Bjørlykke and Ibrahim1995; Michelsen et al. Reference Michelsen, Danielsen, Heilmann-Clausen, Jordt, Laursen, Thomsen and Steel1995; Faleide et al. Reference Faleide, Kyrkjebø, Kjennerud, Gabrielsen, Jordt, Fanavoll, Bjerke, Dorè, Cartwright, Stoker, Turner and White2002; Gabrielsen et al. Reference Gabrielsen, Faleide, Pascal, Braathen, Nystuen, Etzelmuller and O’Donnell2010). The same authors suggested that tectonic increase in relief was the triggering mechanism of changes in climatic conditions and associated switches in erosion and drainage systems. In a series of recent studies this view has however been challenged by the interpretation that the recorded changes in sedimentary trends can be ascribed solely to major climatic cooling at the Eocene–Oligocene boundary (e.g. Clausen et al. Reference Clausen, Gregersen, Michelsen and Sørensen1999; Huuse & Clausen, Reference Huuse and Clausen2001; Huuse, Lykke-Andersen & Michelsen, Reference Huuse, Lykke-Andersen and Michelsen2001; Nielsen et al. Reference Nielsen, Gallagher, Leighton, Balling, Svenningsen, Jacobsen, Thomsen, Nielsen, Heilmann-Clausen, Egholm, Summerfield, Clausen, Piotrowski, Thorsen, Huuse, Abrahamsen, King and Lykke-Andersen2009, Reference Nielsen, Clausen, Jacobsen, Thomsen, Huuse, Gallagher, Balling and Egholm2010; Goledowski, Nielsen & Clausen, Reference Goledowski, Nielsen and Clausen2012). Nielsen et al. (Reference Nielsen, Gallagher, Leighton, Balling, Svenningsen, Jacobsen, Thomsen, Nielsen, Heilmann-Clausen, Egholm, Summerfield, Clausen, Piotrowski, Thorsen, Huuse, Abrahamsen, King and Lykke-Andersen2009, Reference Nielsen, Clausen, Jacobsen, Thomsen, Huuse, Gallagher, Balling and Egholm2010) suggest that the topography of southern Norway has been significant since the establishment of the Caledonian Orogeny during Silurian–Devonian time, and mainly changed through the combined effects of erosion due to climatically forced weathering/erosion and associated isostatic response and extensional collapse. This view therefore excludes the effect of increased relief from tectonic uplift of Scandinavia during Oligocene time.
In our view, several aspects of the tectono-dynamic and climatic changes that influenced Cenozoic sedimentation of the eastern North Sea are not yet fully understood, such as the relationship between the creation of accommodation space and global climate changes and basin subsidence. In this context, the Oligocene succession studied provides relevant and new information on sediment transport directions, sedimentation rates and migration of depocentres, and is a good candidate for studying the relationship between tectonic and climatic influence in a source to sink system. In particular, we emphasize the development of accommodation space in the basinal area and its possible link to the development of relief in the hinterland area and/or climate changes during Oligocene time via integrated studies of bio- and Sr-stratigraphy, seismic sequence stratigraphic techniques and published climate data. The present work therefore aims to re-evaluate the Oligocene sedimentary succession in the eastern North Sea area, based on improved age control and enhanced seismic coverage in the Norwegian sector (Fig. 1). These data are complementary to the dataset used in previous studies (Michelsen & Danielsen, Reference Michelsen, Danielsen, De Batist and Jacobsen1996; Danielsen, Michelsen & Clausen, Reference Danielsen, Michelsen and Clausen1997), which had their main focus on the Oligocene sequences in the Danish sector. Our study includes an analysis of any relative influence of tectonic uplift and climate changes on the development of relief and the rate of erosion in the hinterland and sedimentary flux to the basin. We also discuss the processes influencing the accommodation space in the basin such as basin subsidence, eustasy and halokinesis. Furthermore, we discuss the interplay between climate change and tectonics from seismic sequence stratigraphic analyses. The study area is situated within longitude 3–8° E and latitude 55–58° N (Fig. 1).

Figure 1. (a) Location of the study area. (b) Structural elements within the study area, including wells applied in this study (CG – Central Graben; DCS – Danish Continental Shelf; CSFC – Coffee–Soil Fault Complex; EB – Egersund Basin; FFZ – Fjerrislev Fault Zone; HG – Horn Graben; KFZ – Kreps Fault Zone; LFB – Lista Fault Blocks; NCS – Norwegian Continental Shelf; NDB – Norwegian Danish Basin; RFH – Ringkøbing Fyn High; SG – Skagerrak Graben; STZ – Sorgenfrei Torquist Zone; ÅG – Åsta Graben). See correlation between Norwegian wells 11/10–1, 9/12–1 and 2/2–2 in Figure 4. (c) Seismic data coverage available for this study (courtesy of Fugro Multi Client Services and TGS Nopec).
2. Regional geology
The main structural element in the study area is the Norwegian–Danish Basin, which is a major NW–SE-oriented basin of Mesozoic age in the central and eastern North Sea. It is bounded to the south by the Ringkøbing–Fyn High and the Coffee–Soil Fault Complex and to the north by the Fjerritslev Fault Zone and Farsund Basin (Fig. 1). The Fjerritslev Fault Zone and Farsund Basin are closely associated with the Sorgenfrei–Tornquist Zone, as known from Denmark and further south-eastwards, and are often considered as the Fennoscandian Border Zone (Ziegler, Reference Ziegler1990; Berthelsen, Reference Berthelsen1998; Fredriksen, Nielsen & Balling, Reference Fredriksen, Nielsen and Balling2001; Heeremans & Faleide, Reference Heeremans, Faleide, Wilson, Neumann, Davies, Timmerman, Heeremans and Larsen2004; Heeremans et al. Reference Heeremans, Timmerman, Kirstein, Faleide, Wilson, Neumann, Davies, Timmerman, Heeremans and Larsen2004).
One of the most striking events in the North Sea basin during Cenozoic time was the marked change in sediment provenance at the Eocene–Oligocene boundary in the eastern North Sea area (e.g. Jordt et al. Reference Jordt, Faleide, Bjørlykke and Ibrahim1995; Jordt, Thyberg & Nøttvedt, Reference Jordt, Thyberg, Nøttvedt, Nottvedt, Larsen, Gabrielsen, Olaussen, Brekke, Torudbakken, Birkelnad and Skogseid2000; Huuse, Reference Huuse, Dorè, Cartwright, Stoker, Turner and White2002; Faleide et al. Reference Faleide, Kyrkjebø, Kjennerud, Gabrielsen, Jordt, Fanavoll, Bjerke, Dorè, Cartwright, Stoker, Turner and White2002; Anell, Thybo & Stratford, Reference Anell, Thybo and Stratford2010). During latest Paleocene–Eocene time, sediments of the North Sea basin were primarily derived from the East Shetland Platform and the British Isles to the west (Galloway et al. Reference Galloway, Garber, Liu, Sloan and Parker1993; Jordt et al. Reference Jordt, Faleide, Bjørlykke and Ibrahim1995; Rohrman et al. Reference Rohrman, Van der Beek, Andriessen and Cloetingh1995; Faleide et al. Reference Faleide, Kyrkjebø, Kjennerud, Gabrielsen, Jordt, Fanavoll, Bjerke, Dorè, Cartwright, Stoker, Turner and White2002; Anell, Thybo & Stratford, Reference Anell, Thybo and Stratford2010; Anell, Thybo & Rasmussen, Reference Anell, Thybo and Rasmussen2012). This was related to tectonic uplift of the East Shetland Platform during the late Paleocene break-up of the NE Atlantic (e.g. Jordt et al. Reference Jordt, Faleide, Bjørlykke and Ibrahim1995; Faleide et al. Reference Faleide, Kyrkjebø, Kjennerud, Gabrielsen, Jordt, Fanavoll, Bjerke, Dorè, Cartwright, Stoker, Turner and White2002). Minor sediment influx from the north during Paleocene time in the eastern North Sea area (e.g. Hamberg et al. Reference Hamberg, Dam, Wilhelmson, Ottesen, Dorè and Vining2005) may also indicate a tectonic uplift of parts of southern Norway during the break-up of the NE Atlantic (Jordt et al. Reference Jordt, Faleide, Bjørlykke and Ibrahim1995; Jordt, Thyberg & Nøttvedt, Reference Jordt, Thyberg, Nøttvedt, Nottvedt, Larsen, Gabrielsen, Olaussen, Brekke, Torudbakken, Birkelnad and Skogseid2000; Martinsen et al. Reference Martinsen, Boen, Charnock, Mangerut, Nøttvedt, Fleet and Boldy1999; Huuse, Reference Huuse, Dorè, Cartwright, Stoker, Turner and White2002; Faleide et al. Reference Faleide, Kyrkjebø, Kjennerud, Gabrielsen, Jordt, Fanavoll, Bjerke, Dorè, Cartwright, Stoker, Turner and White2002; Dmitrieva et al. Reference Dmitrieva, Jackson, Huuse and Mccarthy2012). The main sediment transport was focused towards the eastern North Sea during early Oligocene time, reflecting a shift from a mainly western source area during Paleocene–Eocene time to a mainly northern source area during Oligocene time (e.g. Jordt et al. Reference Jordt, Faleide, Bjørlykke and Ibrahim1995, Michelsen et al. Reference Michelsen, Danielsen, Heilmann-Clausen, Jordt, Laursen, Thomsen and Steel1995; Clausen et al. Reference Clausen, Gregersen, Michelsen and Sørensen1999; Jordt, Thyberg & Nøttvedt, Reference Jordt, Thyberg, Nøttvedt, Nottvedt, Larsen, Gabrielsen, Olaussen, Brekke, Torudbakken, Birkelnad and Skogseid2000; Faleide et al. Reference Faleide, Kyrkjebø, Kjennerud, Gabrielsen, Jordt, Fanavoll, Bjerke, Dorè, Cartwright, Stoker, Turner and White2002; Japsen, Bidstrup & Lidmar-Bergström, Reference Japsen, Bidstrup and Lidmar-Bergström2002; Gabrielsen et al. Reference Gabrielsen, Braathen, Olesen, Faleide, Kyrkjebø, Redfield, Wandås, Nystuen, Eide and Gradstein2005, Reference Gabrielsen, Faleide, Pascal, Braathen, Nystuen, Etzelmuller and O’Donnell2010; Japsen et al. Reference Japsen, Green, Nielsen, Rasmussen and Bidstrup2007; Schiøler et al. Reference Schiøler, Andsbjerg, Clausen, Dam, Dybkjær, Hamber, Heilmann-Clausen, Johannessen, Kristensen, Prince, Rasmussen and Rasmussen2007; Anell, Thybo & Artimieva, Reference Anell, Thybo and Artimieva2009; Anell, Thybo & Stratford, Reference Anell, Thybo and Stratford2010; Anell, Thybo & Rasmussen, Reference Anell, Thybo and Rasmussen2012). The same authors ascribe this shift in main provenance area to a tectonic uplift of southern Norway during late Palaeogene – Neogene times. A second tectonic phase was proposed to have occurred during middle Miocene time (e.g. Japsen & Chalmers, Reference Japsen and Chalmers2000; Stoker et al. Reference Stoker, Praeg, Shannon, Hjelstuen, Laber, Nielsen, Van Weering, Sejrup, Evans, Doré and Vinning2005; Japsen et al. Reference Japsen, Green, Nielsen, Rasmussen and Bidstrup2007; Rasmussen, Reference Rasmussen2009). However, other authors have suggested that the Oligocene siliciclastic wedges and middle Miocene unconformity are related to climatic changes, reflected by increased erosion and sediment transport (e.g. Huuse, Lykke-Andersen & Michelsen, Reference Huuse, Lykke-Andersen and Michelsen2001; Huuse, Reference Huuse, Dorè, Cartwright, Stoker, Turner and White2002; Goledowski, Nielsen & Clausen, Reference Gabrielsen, Faleide, Pascal, Braathen, Nystuen, Etzelmuller and O’Donnell2012). These authors suggest that only isostasy, climate and eustatic changes influenced erosion and sediment transport on an already-established topography. Nielsen et al. (Reference Nielsen, Gallagher, Leighton, Balling, Svenningsen, Jacobsen, Thomsen, Nielsen, Heilmann-Clausen, Egholm, Summerfield, Clausen, Piotrowski, Thorsen, Huuse, Abrahamsen, King and Lykke-Andersen2009, Reference Nielsen, Clausen, Jacobsen, Thomsen, Huuse, Gallagher, Balling and Egholm2010) also believe that the then existing topography in southern Norway was a remnant of the Caledonian Orogeny (the isostacy–climate–eustacy or ICE hypothesis).
During Pliocene–Pleistocene time, glaciations in Scandinavia gave rise to increased erosion rates of the Norwegian mainland, with subsequent isostatic response and basinward tilting (i.e. dip-direction to the SW) of the Mesozoic and Cenozoic sedimentary successions in the eastern North Sea (e.g. Riis, Reference Riis1996; Huuse, Lykke-Andersen & Michelsen, Reference Huuse, Lykke-Andersen and Michelsen2001; Faleide et al. Reference Faleide, Kyrkjebø, Kjennerud, Gabrielsen, Jordt, Fanavoll, Bjerke, Dorè, Cartwright, Stoker, Turner and White2002; Huuse, Reference Huuse, Dorè, Cartwright, Stoker, Turner and White2002; Gabrielsen et al. Reference Gabrielsen, Braathen, Olesen, Faleide, Kyrkjebø, Redfield, Wandås, Nystuen, Eide and Gradstein2005, Reference Gabrielsen, Faleide, Pascal, Braathen, Nystuen, Etzelmuller and O’Donnell2010; Nielsen et al. Reference Nielsen, Gallagher, Leighton, Balling, Svenningsen, Jacobsen, Thomsen, Nielsen, Heilmann-Clausen, Egholm, Summerfield, Clausen, Piotrowski, Thorsen, Huuse, Abrahamsen, King and Lykke-Andersen2009). However, Stoker et al. (Reference Stoker, Praeg, Shannon, Hjelstuen, Laber, Nielsen, Van Weering, Sejrup, Evans, Doré and Vinning2005) showed that the onset of major progradation was initiated at about 4 Ma, which predates the growth of glaciation by at least 1 Ma, implying a potential tectonic phase during Pliocene time (Japsen et al. Reference Japsen, Green, Nielsen, Rasmussen and Bidstrup2007).
3. Seismic sequence stratigraphy
3.a. Data
The present study utilizes more than 20 000 km of long-offset 2D data (North Sea Renaissance survey), combined with detailed studies of three key wells (11/10–1, 9/12–1 and 2/2–2) in the Norwegian sector (Fig. 1). The NSR seismic survey was acquired by Fugro and TGS Nopec during the period 2003–2009 on the Norwegian continental shelf. The NSR seismic survey is a high-quality uniform dataset with a vertical resolution of c. 10–20 m, which offers seismic coverage beyond that seen in previous studies. In addition to the NSR survey, the NDT and UG surveys in the Norwegian sector and DCS, DK1, DK2, DT97, SP82 and UCGE97 surveys in the Danish sector were utilized to achieve a complete updated coverage of the study area and to perform a full comparison with previous studies.
3.b. Previously applied seismic stratigraphic sequences
The Cenozoic succession in the northern and eastern North Sea area has been subdivided into depositional sequences sensu Mitchum, Vail & Thompson (Reference Mitchum, Vail, Thompson and Payton1977) and Vail (Reference Vail and Bally1987) (Exxon Model) by Jordt et al. (Reference Jordt, Faleide, Bjørlykke and Ibrahim1995), Michelsen & Danielsen (Reference Michelsen, Danielsen, De Batist and Jacobsen1996), Danielsen, Michelsen & Clausen (Reference Danielsen, Michelsen and Clausen1997), Michelsen et al. (Reference Michelsen, Thomsen, Danielsen, Heilmann-Clausen, Jordt, Laursen, De Graciansky, Jacquin and Vail1998), Martinsen et al. (Reference Martinsen, Boen, Charnock, Mangerut, Nøttvedt, Fleet and Boldy1999), Jordt, Thyberg & Nøttvedt (Reference Jordt, Thyberg, Nøttvedt, Nottvedt, Larsen, Gabrielsen, Olaussen, Brekke, Torudbakken, Birkelnad and Skogseid2000) and Faleide et al. (Reference Faleide, Kyrkjebø, Kjennerud, Gabrielsen, Jordt, Fanavoll, Bjerke, Dorè, Cartwright, Stoker, Turner and White2002). However, these authors pointed out the challenges in identifying the system tracts that ought to be present according to the depositional sequence model of Exxon, particularly the lowstand and transgressive systems tracts (Michelsen et al. Reference Michelsen, Danielsen, Heilmann-Clausen, Jordt, Laursen, Thomsen and Steel1995; Michelsen & Danielsen, Reference Michelsen, Danielsen, De Batist and Jacobsen1996; Danielsen, Michelsen & Clausen, Reference Danielsen, Michelsen and Clausen1997; Michelsen et al. Reference Michelsen, Thomsen, Danielsen, Heilmann-Clausen, Jordt, Laursen, De Graciansky, Jacquin and Vail1998; Martinsen et al. Reference Martinsen, Boen, Charnock, Mangerut, Nøttvedt, Fleet and Boldy1999). Michelsen & Danielsen (Reference Michelsen, Danielsen, De Batist and Jacobsen1996) and Danielsen, Michelsen & Clausen (Reference Danielsen, Michelsen and Clausen1997) documented that downlap surfaces correlated with high gamma peaks and interpreted these surfaces as maximum flooding surfaces. However, they were also able to indentify the sequence boundary (sensu Exxon depositional model) on the basis of both seismic downlaps and onlaps, which appears contradictory as downlap presumes the presence of accommodation space above the surface. If the boundaries of the sequences defined by Michelsen et al. (Reference Michelsen, Danielsen, Heilmann-Clausen, Jordt, Laursen, Thomsen and Steel1995, Reference Michelsen, Thomsen, Danielsen, Heilmann-Clausen, Jordt, Laursen, De Graciansky, Jacquin and Vail1998) (and in the other studies referred to above that followed the same systematics) were formed as subaerial unconformities in accordance with the Exxon depositional sequence model (sensu Van Wagoner et al. Reference Van Wagoner, Mitchum, Posamentier, Vail and Bally1987, Reference Van Wagoner, Posamentier, Mitchum, Vail, Sarg, Loutit, Hardenbol, Wilgus, Hastings, Kendall, Posamentier, Ross and Van Wagoner1988, Reference Van Wagoner, Mitchum, Campion and Rahmanian1990; Posamentier, Jervey & Vail, Reference Posamentier, Jervey, Vail, Wilgus, Hastings, Kendall, Posamentier, Ross and Van Wagoner1988; Posamentier & Vail, Reference Posamentier, Vail, Wilgus, Hastings, Kendall, Posamentier, Ross and Van Wagoner1988), there would not be any marine accommodation space above these surfaces except in the deeper parts of the basins, and then above conformable surfaces correlative to the subaerial unconformity. Nevertheless, above some of these sequence boundaries there are downlapping prograding successions, implying that marine accommodation had formed.
3.c. Seismic sequence stratigraphic model applied in the present study
The challenges related to the identification of bounding surfaces between possible lowstand and transgressive deposits on seismic sections in Cenozoic successions in the North Sea area make it difficult to apply the lowstand, transgressive and highstand systems tracts of the Exxon depositional sequence model. However, as also pointed out by Michelsen et al. (Reference Michelsen, Thomsen, Danielsen, Heilmann-Clausen, Jordt, Laursen, De Graciansky, Jacquin and Vail1998), several of the Cenozoic successions display distinct transgressive–regressive (T-R) trends, demonstrated by seismic facies, clinoform geometry and well-log trends. Transgressive–regressive trends reflect the interplay between the creation and/or destruction of accommodation space and the rate of sedimentation, the controlling factors in basin infill dynamics irrespective of types of allogenic driving factors such as tectonics, eustasy, climate and geomorphology. In our sequence stratigraphic analysis we therefore apply the T-R sequence stratigraphic model (Embry, Reference Embry, Wilgus, Hastings, Posamentier, Wagoner, Ross and Kendall1988, Reference Embry1993, Reference Embry, Steel, Felt, Johannessen and Mathieu1995; Embry & Johannessen, Reference Embry, Johannessen, Vorren, Bergsager, Dahl-Stamnes, Holter, Johansen, Lie and Lund1992; Fig. 2).
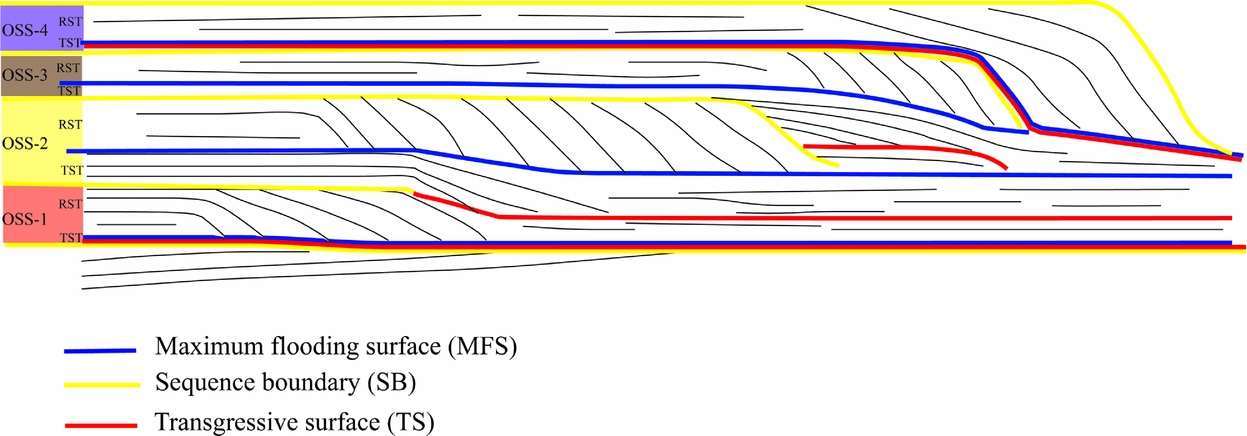
Figure 2. Sketch summarizing the four T-R sequences described in this study and the corresponding sequence boundaries (SB), transgressive surfaces (TS) and maximum flooding surfaces (MFS). Note the non-accretionary nature of the TST of OSS-1 and OSS-4, while the TST in OSS-2 and OSS-3 are aggradational. The sketch is not to scale.
The transgressive systems tract (TST) can be non-accretionary, implying a lack of sediments deposited during the rise in relative sea level, or consisting of sediment thicknesses less than the seismic resolution (Helland-Hansen, Reference Helland-Hansen, Steel, Felt, Johannessen and Mathieu1995). Accretionary TST consists of marine successions with aggrading stacking geometry (Fig. 2). The underlying bounding transgressive surface (TS) coincides with a regional unconformity, defined by toplap and/or toplap truncation. The part of the surface characterized by toplap truncation is interpreted as a subaerial unconformity (SU), whereas the toplap part of the surface is a candidate for the marine conformable part of the SU. Alternatively, this part of the regional unconformity may represent subaerial exposure without marked erosion or a shallow marine omission, bypass or ravinement surface. Onlap on the regional unconformity implies creation of accommodation space and hence the establishment of the TS, accompanied by sedimentation, as marine and/or coastal onlap. The combined subaerial unconformity and the transgressive surface are termed a SU/TS surface.
The transgressive systems tract is bounded at the top by a regional surface characterized by downlap. This is the maximum flooding surface (MFS), forming the lower bounding surface of the regressive systems tract (RST). In cases where a transgressive systems tract is absent, the MFS may coincide with both the regional unconformity and the transgressive surface, forming a combined SU/TS/MFS surface. The regressive systems tracts are distinguished by progradational successions with internal clinoform geometry. In this system, eventual deposits formed during a fall in relative sea level will be included in the regressive systems tract.
3.d. Nomenclature
In this study, we introduce an adjusted nomenclature for the Oligocene seismic sequences (OSS; Figs 2, 3) relative to previous studies (Jordt et al. Reference Jordt, Faleide, Bjørlykke and Ibrahim1995; Michelsen & Danielsen, Reference Michelsen, Danielsen, De Batist and Jacobsen1996; Danielsen, Michelsen & Clausen, Reference Danielsen, Michelsen and Clausen1997). New nomenclature is needed because the T-R systematic subdivision is employed in this study, whereas previous studies applied the Exxon systematics. We divide the Oligocene succession into four seismic sequences, where two of the sequences are of early Oligocene age (OSS-1 and OSS-2) and the two later sequences are of late Oligocene age (OSS-3 and OSS-4). The sequence boundaries are compared to previous studies and summarized in Figure 3.
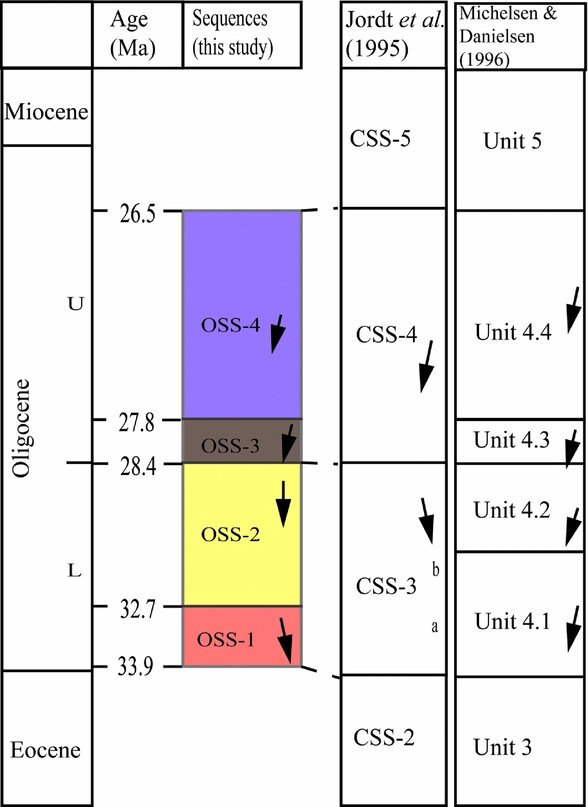
Figure 3. Seismic stratigraphic sequences correlation with the NSA zonation of King (Reference King, Jenkins and Murray1989) and Gradstein & Bäckström (Reference Gradstein and Bäckström1996), correlated to that by Michelsen & Danielsen (Reference Michelsen, Danielsen, De Batist and Jacobsen1996) and Jordt, Thyberg & Nøttvedt (Reference Jordt, Thyberg, Nøttvedt, Nottvedt, Larsen, Gabrielsen, Olaussen, Brekke, Torudbakken, Birkelnad and Skogseid2000). Arrows indicate direction of sediment progradation.
4. Methods
4.a. Well correlation
The seismic data were tied to available wells, including key wells 11/10–1, 9/12–1 and 2/2–2 in the Norwegian sector (Figs 4, 5) and wells F-1, Inez-1, D-1, Nini-1 and Ibenholt-1 in the Danish sector. Extensive studies, including biostratigraphy and Sr-stratigraphy, were carried out on material from the Norwegian wells. More comprehensive studies of the Norwegian wells are presented in Eidvin et al. (Reference Eidvin, Riis, Rasmussen and Rundberg2013). In combination with new information obtained from the biostratigraphical and chemostratigraphical studies, the seismic geometries were used to establish a depositional model for the study area. A particular emphasis was placed on recognizing progradation direction and transgressions, as well as maximum flooding surfaces.

Figure 4. Correlation between the three wells on the Norwegian Continental Shelf applied to this study for Sr-stratigraphy and biostratigraphic analysis.

Figure 5. Seismic correlation between the three key wells 11/10–1, 9/12–1 and 2/2–2 in this study.
4.b. Biostratigraphy and strontium isotope stratigraphy (SIS)
For this study, new micropalaeontological and Sr-isotope analyses of well 2/2–2, 9/12–1 and 11/10–1 are used to obtain better age control on the Oligocene sequence in the eastern North Sea. A total of 66 ditch cutting samples and two conventional core samples (well 2/2–2) were analysed (Table 1, Fig. 4).
Table 1. Strontium isotope data from well 11/10–1, 9/12–1 and 2/2–2, analysed at the University of Bergen. Sr ratios were corrected to NIST 987 = 0.710248. The numerical ages were derived from the SIS look-up table version 3:10/99 of Howarth and McArthur (Reference Howarth and McArthur1997). NIST – National Institute for Standards and Technology.
4.b.1. Micropalaeontological analyses
The micropalaeontological investigations are based on analyses of planktonic and benthic foraminifera and pyritized diatoms. The fossil assemblages are correlated with the biozonation of King (Reference King, Jenkins and Murray1989), who outlines a micropalaeontological zonation for Cenozoic sediments in the North Sea. Gradstein & Bäckström's (Reference Gradstein and Bäckström1996) faunal zonation of the North Sea and Haltenbanken is also used.
4.b.2. Strontium isotope analyses
Strontium isotope stratigraphy is used as an additional control on the biostratigraphic correlations. The 87Sr/86Sr ratio of seawater is very uniform on a global scale, which is a reflection of the long oceanic residence time of strontium (2–4 Ma) combined with a relative short (≤2000 a) oceanic mixing rate. Strontium isotope stratigraphy is an effective tool, particularly for the dating of Miocene and Oligocene sections. It has best resolution in sediments older than 15 Ma because the Sr isotopic composition of seawater changed rapidly during this period (e.g. Howarth & McArthur Reference Howarth and McArthur1997).
A total of 23 samples were investigated for their Sr isotopic compositions with 41 analyses (Table 1, Fig. 4). The majority (26 analyses) were conducted on tests of calcareous index foraminifera and the remainder on mollusc fragments (15 analyses from sandy sections). Strontium values were converted to age estimates using the SIS look-up table of Howarth & McArthur (Reference Howarth and McArthur1997). This table is based on the timescale compiled by Berggren et al. (Reference Berggren, Kent, Swisher, Aubry and Berggren1995), which for the Oligocene does not deviate significantly from the new timescale of the International Commission on Stratigraphy (see http://www.stratigraphy.org/ICSchart/ChronostratChart2013--01.pdf). For more details on the precision of the method, see Howarth & McArthur (Reference Howarth and McArthur1997), McArthur, Howarth & Bailey (Reference McArthur, Howarth and Bailey2001) and Eidvin & Rundberg (Reference Eidvin and Rundberg2001, Reference Eidvin and Rundberg2007). Note that the micropalaeontological zonation of King (Reference King, Jenkins and Murray1989) is based on the timescale of Berggren, Kent & Van Couvering (Reference Berggren, Kent, Van Couvering and Snelling1985), but we have converted the ages to the timescale of Berggren et al. (Reference Berggren, Kent, Swisher, Aubry and Berggren1995). The micropalaeontological zonation of Gradstein & Bäckström (Reference Gradstein and Bäckström1996) is based on the timescale of Cande & Kent (Reference Cande and Kent1992) in which the absolute ages are identical to those of Berggren et al. (Reference Berggren, Kent, Swisher, Aubry and Berggren1995).
4.c. Volume estimates and water depths
The sound wave velocity is set to 2000 m s−1 for the combined Cenozoic succession, as measured in the studied wells (check shot; 11/10–1, 9/12–1 and 2/2–2). A velocity of 2000 m s−1 was also applied by Jordt, Thyberg & Nøttvedt (Reference Jordt, Thyberg, Nøttvedt, Nottvedt, Larsen, Gabrielsen, Olaussen, Brekke, Torudbakken, Birkelnad and Skogseid2000). Volumes of sediments are calculated for each of the sequences within the 100 m (100 ms two-way travel time or TWT) contours (Fig. 6). The volumes are calculated between the upper and lower bounding surfaces for each sequence, hence including both the TST and the RST. Note however that these estimates give minimum volumes, because no allowance has been made for compaction and post-depositional erosion. In addition, there may be undetected sediment volumes deposited beyond the study area.
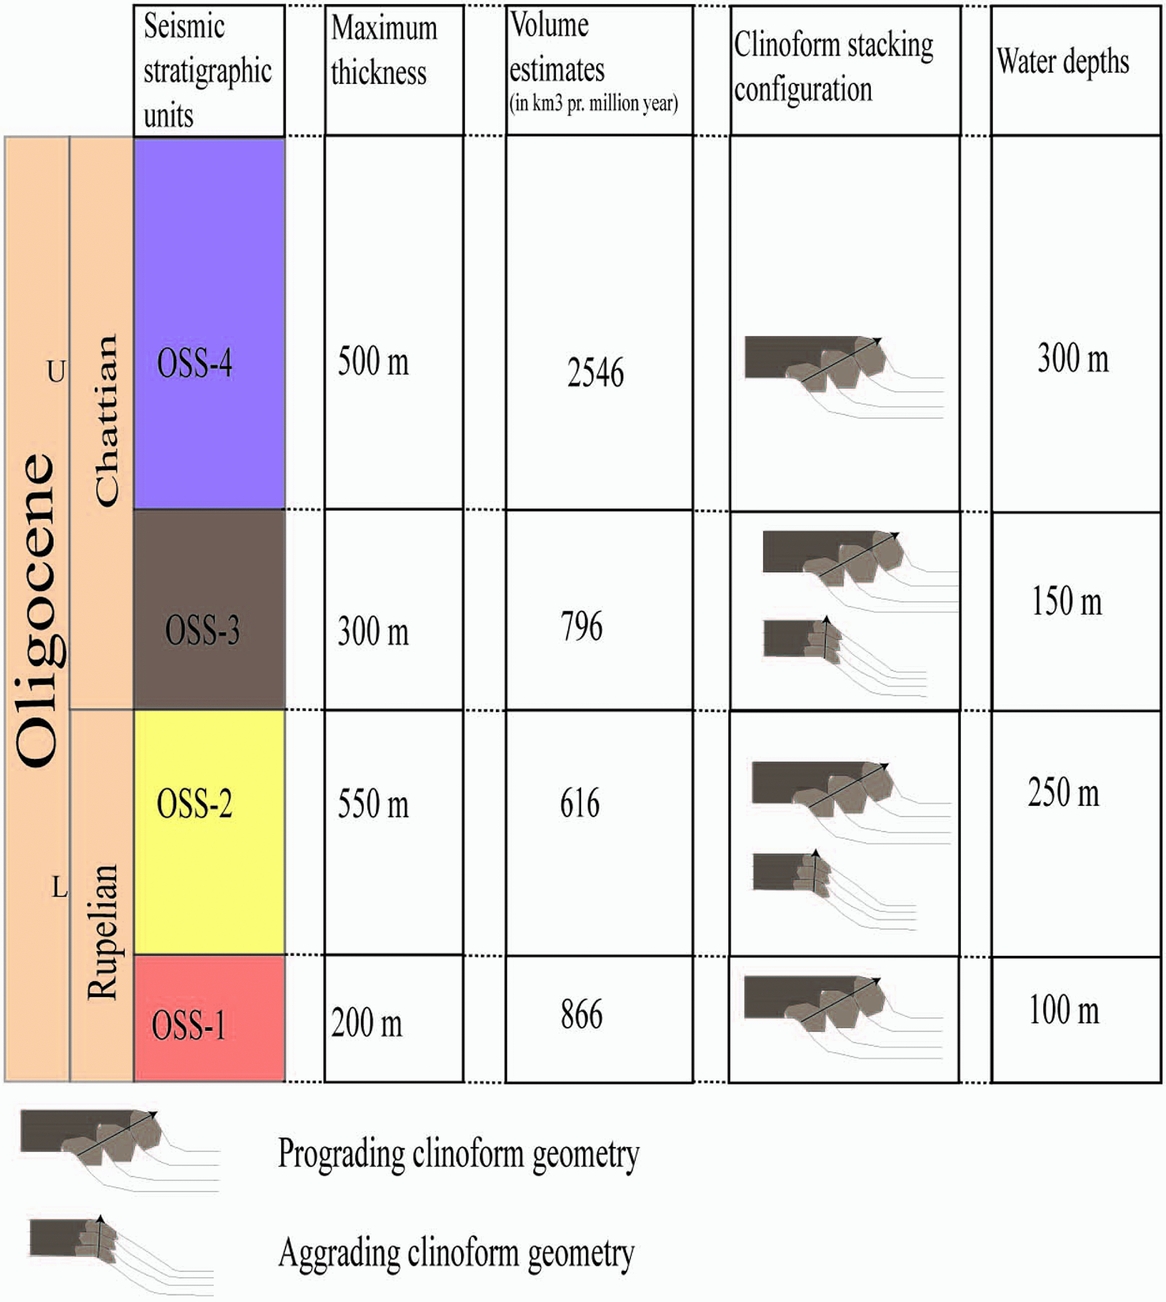
Figure 6. Seismic stratigraphic subdivision from this study, with characteristic features for each sequence. Note that water depth is calculated from clinoform heights.
The estimated water depths are based on the heights of clinoforms for each sequence as calculated after correcting for later tilting of the corresponding downlap surface, assuming that the clinoform height also represents the palaeowater depth.
5. Description and analysis of the seismic sequences
The Oligocene seismic succession was subdivided into four second-order seismic sequences, all of which are characterized as T-R sequences (Fig. 2). The following sections describe the four Oligocene seismic sequences (OSSs).
5.a. Oligocene seismic sequence 1 (OSS-1)
The lower boundary of OSS-1 is defined by a downlap surface (Fig. 7). This surface is characterized by a strong and continuous reflector which can be mapped across the entire study area. It represents sedimentary strata which drape a surface that shows erosional truncation into underlying Eocene and Paleocene strata to the east and southeast of Norwegian well 9/12–1 (Fig. 8). OSS-1 is identified mainly in the Norwegian sector and is upward bounded by toplap truncation and succeeded by OSS-2 (Fig. 7). The upper sequence unconformity corresponds with the Oi1a global cooling event (Pekar et al. Reference Pekar, Christie-Blick, Kominz and Miller2002), which in well 11/10–1 also corresponds to a section including the dinoflagella cyst Svalbardella (Sliwinska and Heilmann-Clausen, Reference Sliwinska and Heilmann-Clausen2011).

Figure 7. (a) Time-thickness map of OSS-1. The clinoform facies for the various units represents the highstand systems tract and also the main depocentre at the time of deposition. (b) The upper surface of OSS-1 is marked in red in the seismic section (B–B’). (c) Seismic termination above offlap break, indicating clinoform toplap truncation.
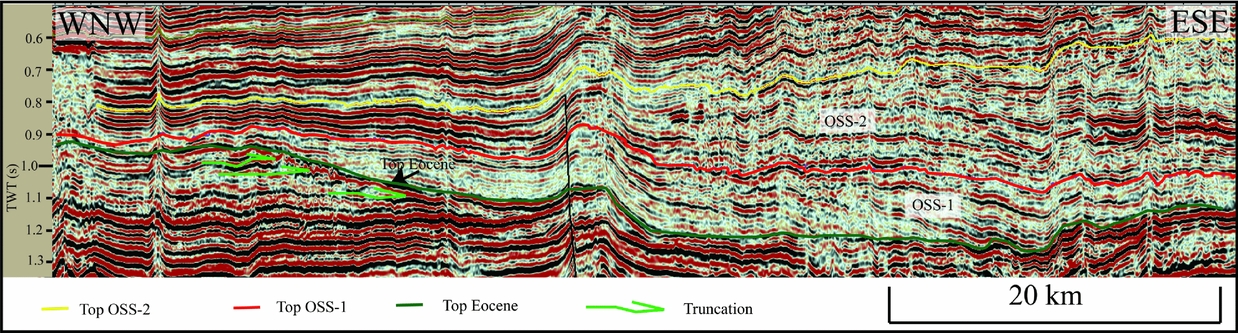
Figure 8. Seismic terminations indicating erosion of Eocene strata at base OSS-1. Note the strong seismic amplitude directly above the unconformity, corresponding to the downlap surface of OSS-1.
The main depocentre of OSS-1 is located in the area west and southwest of Norwegian well-site 11/10–1 (Fig. 7). Here the sequence reaches a maximum thickness of 300 m (Fig. 7) and the estimated net depositional volume rate is 866 km3 Ma−1. This is a minimum estimate, as volume loss from mechanical compaction and sediments transported beyond the study area are not included. The sequence thins eastwards to less than 50 m at the Danish well F-1, and also thins towards the west and southwest (Fig. 7).
In the central part of the depocentre, OSS-1 is strongly influenced by a salt structure (Fig. 9). This corresponds to the area where the sequence reveals its maximum thickness. OSS-1 strata thin across this salt structure and onlap its flanks (Fig. 9). Similarly, the sequence onlaps a salt structure southeast of well 11/10–1 on the Norwegian–Danish border, and further to the east its thickness is reduced to less than that detectable within the seismic resolution. OSS-1 is not seen in the Inez-1 well area. Towards the north, OSS-1 onlaps Eocene strata along the NW–SE-striking Fjerritslev Fault Zone (Figs 10, 11a). Note that, in contrast to OSS-1, the Eocene and Paleocene sequences thicken northwards, indicating that the Fjerritslev Fault Zone area represented parts of the depositional area during early Palaeogene time.

Figure 9. (a) Base map showing salt structures in the study area penetrating and/or affecting the Oligocene sequences. Seismic sections showing halokinesis during deposition of (b) OSS-1 and (c) OSS-3. Arrows mark seismic onlap against the salt structures.

Figure 10. Arbitrary seismic sections (striking NNE–SSW) illustrating the various systems tracts of the Oligocene sequences. Note the onlap pattern of OSS-1 against Eocene strata in the NE part. See Figure 1 for location of the seismic lines.

Figure 11. Seismic examples including well tie to well 11/10–1 and the prograding RSTs in the western part of the main depocentre relative to sequences (a) OSS-1 and (b) OSS-2. See Figure 7 for line locations. Note that OSS-1 onlap Eocene strata towards the north, whereas OSS-2 has a more uniform thickness northwards.
OSS-1 contains seismic geometries that are characterized by clinoforms prograding SSE, which is perpendicular to the basin axis during deposition (NE–SW; Fig. 7). The clinoforms have a complex sigmoidal/oblique geometry, with dips of 0.5–1°. The clinoform heights are approximately 100 m, and the prograding succession is upwards bounded by clinoform toplap truncation (SU). The clinoforms shift to a more sigmoidal geometry in the southwest part of the depositional area, where the clinoform topsets are preserved (Fig. 11b). Well 11/10–1, which penetrates the prograding clinoforms, reveals gamma log readings consistent with fine-grained sediments throughout OSS-1 (Fig. 4). The gamma log also reveals an upwards-decreasing gamma ray response of individual packages, interpreted as upwards-coarsening parasequences, typical of prograding regressive depositional systems.
5.a.1. Interpretation
Based on the downlapping of the internal clinoforms onto the basal bounding reflector of OSS-1 and the strong and regional character, this basal reflector is interpreted as a MFS. The Eocene–Oligocene boundary at the base of OSS-1 resembles a marine erosional surface, representing either a ravinement surface (>20 m water depth) or the action of deep marine currents (up to hundreds of metres water depth, e.g. Nichols, Reference Nichols2009). However, as the TST at the base of OSS-1 is non-accretionary, the lower bounding surface of OSS-1 is a combined SU/TS/MFS surface, at least in the platform margin areas of the basin. This is supported by well data offshore Denmark (Danielsen, Michelsen & Clausen, Reference Danielsen, Michelsen and Clausen1997) and by observations onshore Denmark. These reveal that the base of the Viborg Formation contains glauconite, supporting the presence of a well-developed hiatus (Christensen & Ulleberg, Reference Christensen and Ulleberg1973) that may represent a non-accretionary TST.
The clinoform heights indicate water depths of approximately 100 m during earliest Rupelian time. The shale lithology, as recorded in well 11/10–1, is consistent with a parallel and sigmoidal clinoform geometry together with gentle clinoform dips (0.5–1°), typical where fine-grained material dominates (e.g. Mitchum, Vail & Thompson, Reference Mitchum, Vail, Thompson and Payton1977; Veeken, Reference Veeken2007). Such depositional systems are also often characterized by low energy in the basin, where limited reworking of the sediments takes place.
The thinning of OSS-1 and its onlapping pattern against the salt diapir located within the central part of the OSS-1 depocentre (Fig. 9) is taken to indicate diapirism during deposition of the sequence during early Rupelian time. Similarly, halokinesis is interpreted to have controlled the eastern extent of the main depositional area of OSS-1. This is seen from the onlap contact and thinning of OSS-1 onto salt diapirs at the Norwegian–Danish border, reflecting bathymetric relief here during earliest Rupelian time. Salt mobilization is also known from onshore Denmark during Oligocene time (Japsen et al. Reference Japsen, Green, Nielsen, Rasmussen and Bidstrup2007).
5.b. Oligocene seismic sequence 2 (OSS-2)
The lower boundary of OSS-2 corresponds to the erosional surface representing the SU at the top of OSS-1. OSS-2 also contains an internal downlap surface, represented by a strong continuous seismic reflector which is recorded across most of the study area (Fig. 7). The upper boundary of OSS-2 is characterized by toplap truncation and severe incision (Fig. 12), and is considered equivalent to the upper boundary of unit 4.2 in Michelsen & Danielsen (Reference Michelsen, Danielsen, De Batist and Jacobsen1996; Fig. 3).

Figure 12. (a) Time-thickness map of OSS-2. (b) Clinoform facies for the sequence represents the highstand systems tract and is coherent with the main depocentre at the time of deposition. (c) Internal erosional surfaces in the seismic section and incision at the upper SU.
OSS-2 displays a maximum thickness of approximately 550 m south of wells 11/10–1 and F-1, and thins south- and westwards to less than 100 m (Fig. 12). Unlike OSS-1, OSS-2 maintains a uniform thickness northwards with no observed onlap or marked thinning in the Fjerritslev Fault Zone area (Fig. 10). Based on the recorded thicknesses, the bulk sediment volume rate is calculated as c. 616 km3 Ma−1 (Fig. 6).
In well 11/10–1 and southwards, the lower part of OSS-2 is characterized by seismic geometries showing SE-dipping clinoforms with offlap breaks defining a near-vertical trajectory, showing an aggrading depositional geometry of c. 100 m (Fig. 10). The gamma ray log trend in well 11/10–1 indicates the presence of slightly upwards-coarsening parasequences (Fig. 4). The gamma response culminates in the middle part of OSS-2 in a strong peak (Fig. 4) which, in stratigraphic position, coincides with a strong and continuous seismic reflection (Fig. 5). This continuous character of the seismic reflection likely reflects strata that drape the aggrading clinoforms and acts as a downlap surface for the upper part of OSS-2.
The upper part of OSS-2 is characterized by a seismic succession with prograding clinoforms dipping towards the south and southwest. The clinoforms have a tangential oblique geometry, with clinoform heights of approximately 200–250 m and clinoform dips of 1.5–5.5°. The upper boundary suggests erosion as evidenced by truncation and incision of the clinoform topsets (Fig. 12). The incision features on the clinoform topsets have vertical depths of up to 20–30 m (Fig. 12), indicating channel deposition. The clinoforms shift westwards to more complex sigmoidal/oblique geometry (Fig. 11b). Onlap from sediments belonging to OSS-3 is recorded against the upper SU of OSS-2, indicating coastal onlap (Fig. 12).
Internally, the clinoform system in the upper part of OSS-2 is highly complex with lensoidal subunits bounded by unconformities and onlap surfaces (Fig. 12), indicating internal clinoform reflectors dipping in various directions.
In the frontal part of the prograding clinoforms (i.e. basinwards), OSS-2 is characterized by a 150 m interval with strong seismic amplitude reflectors (Figs 10, 11a). These seismic reflectors downlap onto the bottom-bounding reflector relative to the succession of SSW-prograding clinoforms of the same sequence, as well as onlapping the frontal part of the prograding clinoforms towards the NNE (Fig. 10).
At the position of Norwegian wells 11/10–1 and 9/12–1 and northwards, OSS-2 is characterized by parallel seismic reflectors. The gamma ray log in well 11/10–1 reveals an upwards-coarsening succession, as indicated by the upwards decrease in gamma readings (Fig. 4).
5.b.1. Interpretation
The lower bounding surface for OSS-2 represents a sequence boundary separating OSS-1 and OSS-2. As indicated by the aggrading depositional pattern, the lowermost part of OSS-2 is interpreted as a TST where sediment input closely balanced the rate of creation of accommodation space during the transgression. The strong and continuous character of the reflector, its downlap pattern and the gamma ray peak of the reflector defining the top of the TST are all interpreted to represent the MFS. As indicated by the clinoform heights, the water depth during transgression is assumed to have reached approximately 250 m during maximum transgression.
The prograding part of OSS-2 is interpreted to constitute the RST. The oblique geometry of the clinoforms is typical of coarse-grained clastic debris (Hansen & Rasmussen, Reference Hansen and Rasmussen2008; Bullimore et al. Reference Bullimore, Henriksen, Liestøl and Helland-Hansen2005). However, the internal architecture of the upper part of OSS-2 with its shifting lensoid geometry and erosional surfaces (Fig. 12) probably represents various depositional lobes, shifting in position and progradational direction through time. Lateral shifts in sediment accumulation are typical of delta lobes and can be explained by avulsion and shifting transport directions of the fluvial system in the hinterland, as seen in modern deltas (e.g. the Mississippi delta; Coleman, Reference Coleman1988). However, as halokinesis is recorded at the time of deposition of OSS-2, local doming within the basin is likely to have created local barriers for the sediments and therefore also influenced the pattern of sedimentation laterally through time.
The sediments belonging to the TST of OSS-2 entered the basin from the NNW, following similar sediment routing as OSS-1. The shift in direction of progradation, from southeast for OSS-1 and the lower part of OSS-2 to south and southwest for the upper part of OSS-2, may indicate that the entry point of the sediment influx to the basin shifted or that depocentres of depositional lobes changed position. The parallel subhorizontal seismic reflectors in the northern part of the study area are interpreted as shallow marine shelf deposits.
Based on the downlap onto the maximum flooding surface and onlap onto the RST of OSS-2, the uppermost part of OSS-2 is interpreted as lowstand fan deposits. These are likely to contain gravity flow facies derived as erosional material from the shelf (Posamentier & Vail, Reference Posamentier, Vail, Wilgus, Hastings, Kendall, Posamentier, Ross and Van Wagoner1988).
The depositional evolution of OSS-2 was terminated by toplap truncation and major incision, creating an erosional surface interpreted as a sequence unconformity and a sequence boundary (Fig. 12). The upper sequence unconformity is probably of subaerial or shallow marine origin, which is supported by fossil assemblages typical of the upper shoreface in well 11/10–1 (Fig. 4), and potential fluvial incision (Fig. 12).
5.c. Oligocene seismic sequence 3 (OSS-3)
South of the 11/9–1 well area, the lower boundary of OSS-3 bears the characteristics of a marine flooding surface; in the area just south of well 11/10–1, this coincides with the erosional SU bounding OSS-2. Here, downlap of seismic reflectors is recorded in the distal part of the depocentre and the same reflectors onlap the RST of OSS-2 in the more proximal part of the depocentre (Fig. 10). The upper boundary of OSS-3 is also characterized by toplap truncation (Fig. 13), and corresponds to the top of unit 4.3 in Michelsen & Danielsen (Reference Michelsen, Danielsen, De Batist and Jacobsen1996; Fig. 3). The main depocentre of OSS-3 was located south of the depocentre of OSS-2, where a maximum thickness of c. 200 m (Fig. 13) is recorded. In the southern parts of the study area the lower part of OSS-3 thins across salt diapirs and onlaps against them (Fig. 9b). The thickness and duration of sedimentation are consistent with a sediment volume rate of c. 796 km3 Ma−1. The sequence thins to less than 100 m to the south and west, including the 9/12–1 well area (Fig. 13).

Figure 13. (a) Time-thickness map of OSS-3. (b) Clinoform facies for the sequence represents the highstand systems tract and also the main depocentre at the time of deposition. (c) The TST and RST are separated by a MFS.
In the lower part of OSS-3, seismic reflectors with an aggradational geometry dip towards the SSW. These onlap the prograding clinoforms related to OSS-2, including the erosional surface (SU) which towards the north truncates the OSS-2 clinoform succession (Figs 10, 13).
A strong continuous reflector, which extends across the entire study area, represents sedimentary draping of the aggrading clinoform set. This reflector represents a stratigraphic surface with prograding clinoforms downlapping onto it (Fig. 13). The prograding clinoforms above this surface dip towards the SSW with an oblique geometry, with clinoform toplap truncation below offlap break (Fig. 13). These prograding clinoforms are restricted to the area of maximum thickness of the sequence (>200 m; Fig. 13) and hence only identified in the Danish sector NNE of the Nini-1 well (Fig. 13). The clinoform height is approximately 100 m, with clinoform dips of 2–3°. Outside this area, the clinoforms shift to a more aggradational style. This is accompanied by a gradual thinning of the seismic successions to below seismic resolution west and southwest of the Nini-1 well, where the sequence boundary combines with the MFS within the T-R sequence.
In the northern part of the study area at well 11/10–1 and northwards, sequence OSS-3 consists of parallel subhorizontal reflectors. OSS-3 consists mostly of sandstone, with abundant fragments of limestone and molluscs (Fig. 4). Sandstone also dominates the lithology of this sequence in the Danish wells F-1, Inez-1, Ibenholt-1 and D-1 (Danielsen, Michelsen & Clausen, Reference Danielsen, Michelsen and Clausen1997). At the Norwegian well sites 2/2–2 and 9/12–1, which are positioned distally to the main depocentre, OSS-3 consists of shale (Fig. 4).
5.c.1. Interpretation
The upper sequence unconformity of OSS-2 was transgressed and the TS overlain by strata with an internal aggradational geometry of clinoforms. This aggradational succession is interpreted as representing the TST, in which the rate of sedimentation mostly equalled creation of accommodation space (in the same way as for the lower part of OSS-2). The lower boundary of OSS-3 reflects first a shift from lowering of relative sea level with subaerial erosion to stillstand or sediment bypass, succeeded by marine flooding and rise in relative sea level. The southwest dip of the clinoforms indicates that the main progradational direction is from the northeast, perpendicular to the orientation of the basin axis (Fig. 13).
As OSS-3 thins across salt structures in the southern parts of the depositional area, halokinesis appears to have influenced the depositional pattern and acted as barriers in various parts of the basin during deposition of the sequence.
The progradational succession above the MFS within OSS-3 is interpreted to be the RST of OSS-3. The oblique geometry, in addition to the steepness of the clinoforms, is typical of systems deposited in a high-energy environment where the coarser material may be trapped in the foresets (Bullimore et al. Reference Bullimore, Henriksen, Liestøl and Helland-Hansen2005; Veeken, Reference Veeken2007). The thickness map and the direction of clinoform dips may indicate that the sequence was sourced from the NNE (Fig. 13). The salt structures, which developed simultaneously as the deposition of OSS-3, likely influenced the continued south-westwards progradation of the succeeding RST by creating a narrow depositional basin for the prograding RST. This is supported by the oblique clinoform geometry, which is often characteristic of narrow depocentres (cf. Bullimore et al. Reference Bullimore, Henriksen, Liestøl and Helland-Hansen2005). The upper erosional surface that terminates the prograding clinoforms most probably formed as a subaerial unconformity (SU).
5.d. Oligocene seismic sequence 4 (OSS-4)
The lower boundary of OSS-4 is characterized as a downlap surface, where reflectors downlap onto a continuous high-amplitude reflector which extends across the study area. In the eastern parts of the depocentre, onlap patterns are recorded against the frontal parts of the RST of OSS-3 (Fig. 10). However, this is not observed elsewhere in the depocentre. The clinoforms which onlap the frontal parts of the RST of OSS-3 share the same downlap surface as the overall OSS-4. The upper boundary of OSS-4 is a seismic surface characterized by toplap truncation (Fig. 14), and correlates with the upper boundary of unit 4.4 in Michelsen & Danielsen (Reference Michelsen, Danielsen, De Batist and Jacobsen1996) and sequence CSS-4 in Jordt et al. (Reference Jordt, Faleide, Bjørlykke and Ibrahim1995). OSS-4 has a maximum thickness of 500 m and a sediment volume rate of c. 2546 km3 Ma−1.

Figure 14. (a) Time-thickness map of OSS-4. (b, c) Internal onlap surfaces, indicating lobe shifting during deposition of the RST of the sequence.
The main depocentre of OSS-4 is situated in the Norwegian–Danish Basin and is oriented NW–SE, as seen in the thickness map (Fig. 14). The sequence thins to less than 100 m to the south, southwest and west.
In OSS-4, seismic clinoforms dip towards the southwest and indicate progradation in this direction. The seismic geometry in the lower part of the sequence shifts from progradational to aggradational eastwards, although with the same direction of dip.
The prograding clinoforms have a sigmoidal geometry, with internal onlap surfaces and erosional surfaces recorded within the succession. However, these are less pronounced and the clinoforms are downlapping the same downlap surface as the overall prograding succession (Fig. 14). The clinoform heights of sequence OSS-4 are 200–300 m, with clinoform dips of 1–2°.
5.d.1. Interpretation
Based on the downlap pattern of the lowermost surface of OSS-4, this is interpreted as a maximum flooding surface (MFS) which, within the seismic resolution, coincides with a transgressive surface (TS). The TS succeeds a likely subaerial unconformity reflected by fossil assemblages in well 11/10–1, indicating a shallow marine environment, and the toplap truncation that terminates the underlying OSS-3 sequence in the platform areas of the basin. Although the onlap pattern at the frontal part of OSS-3 may represent a thin TST in the eastern part of the study area, the clinoforms share the same downlap surface as the overall sequence. This suggests that the sediment input may have been focused at another part of the basin during progradation. This is supported by the internal onlap surfaces recorded throughout the sequence, which indicate lobe switching and hence changes in direction of main sediment input.
As the transgressive systems tracts is only identified by the MFS at the base of OSS-4 (non-accretionary systems tract), and the maximum flooding surface appears to coincide with the toplap truncation surface cutting the underlying OSS-3, the transgression and resulting increase in accommodation space must have taken place quickly.
The prograding succession above this maximum flooding surface is interpreted to be the RST in OSS-4. The sigmoidal geometry, in addition to the steepness of the clinoforms, is typical of muddy systems, with sediments deposited in a low-energy system with substantial accommodation space (Mitchum, Vail & Thompson, Reference Mitchum, Vail, Thompson and Payton1977; Bullimore et al. Reference Bullimore, Henriksen, Liestøl and Helland-Hansen2005). The thickness map and the direction of clinoform dips indicate that the sequence was deposited into the basin from the northeast (Fig. 14).
6. Discussion
The Cenozoic succession in the North Sea area has been the subject of numerous publications in recent years. These publications have mainly been concerned with relating late Palaeogene and Neogene sedimentation variations and depocentre migration to either a tectonic model or climatic model. The tectonic model suggests tectonic uplift of southern Norway (e.g. Jordt et al. Reference Jordt, Faleide, Bjørlykke and Ibrahim1995; Michelsen & Danielsen, Reference Michelsen, Danielsen, De Batist and Jacobsen1996; Danielsen, Michelsen & Clausen, Reference Danielsen, Michelsen and Clausen1997; Michelsen et al. Reference Michelsen, Thomsen, Danielsen, Heilmann-Clausen, Jordt, Laursen, De Graciansky, Jacquin and Vail1998; Jordt, Thyberg & Nøttvedt, Reference Jordt, Thyberg, Nøttvedt, Nottvedt, Larsen, Gabrielsen, Olaussen, Brekke, Torudbakken, Birkelnad and Skogseid2000; Faleide et al. Reference Faleide, Kyrkjebø, Kjennerud, Gabrielsen, Jordt, Fanavoll, Bjerke, Dorè, Cartwright, Stoker, Turner and White2002; Anell, Thybo & Stratford, Reference Anell, Thybo and Stratford2010; Anell, Thybo & Rasmussen, Reference Anell, Thybo and Rasmussen2012). The climatic model describes how climatic changes and isostatic adjustments are the controlling factors regarding sediment dispersal and depocentre migration in the eastern North Sea (e.g. Huuse & Clausen, Reference Huuse and Clausen2001; Huuse, Lykke-Andersen & Michelsen, Reference Huuse, Lykke-Andersen and Michelsen2001; Nielsen et al. Reference Nielsen, Gallagher, Leighton, Balling, Svenningsen, Jacobsen, Thomsen, Nielsen, Heilmann-Clausen, Egholm, Summerfield, Clausen, Piotrowski, Thorsen, Huuse, Abrahamsen, King and Lykke-Andersen2009, Reference Nielsen, Clausen, Jacobsen, Thomsen, Huuse, Gallagher, Balling and Egholm2010; Goledowski, Nielsen & Clausen, Reference Goledowski, Nielsen and Clausen2012). However, more regional studies support the theory that both regional tectonics and climate changes influenced western Scandinavia during Cenozoic time. These studies show that the prograding successions described in this study correlate to a period of substantial lithospheric reorganization in the north Atlantic (e.g. Gaina, Gernigon & Ball, Reference Gaina, Gernigon and Ball2009), including alpine compression in southern Europe (e.g. Coward & Dietrich, Reference Coward, Dietrich, Coward, Dietrich and Park1989), and the global cooling event at the Eocene–Oligocene boundary (e.g. Haq, Hardenbol & Vail, Reference Haq, Hardenbol and Vail1987; Abreu & Anderson, Reference Abreu and Anderson1998; Miller et al. Reference Miller, Kominz, Browning, Wright, Mountain, Katz, Sugarman, Cramer, Christie-Blick and Pekar2005; DeConto et al. Reference Deconto, Pollard, Wilson, Palike, Lear and Pagani2008; Pekar & Christie-Blick, Reference Pekar and Christie-Blick2008; Scher et al. Reference Scher, Bohaty, Zachos and Delaney2011). The aim of this paper is to discuss the creation of accommodation space and sediment infill according to the observations presented in the previous section, with emphasis on both regional tectonics and climate changes.
6.a. Creation of accommodation space, climate and shifting depocentres
This section discusses the development and migration of depocentres in relation to well-known eustatic sea-level changes. The base Oligocene unconformity (Fig. 8) corresponds in time with eustatic sea-level fall at the Eocene–Oligocene boundary (e.g. Haq, Hardenbol & Vail, Reference Haq, Hardenbol and Vail1987; Miller et al. Reference Miller, Kominz, Browning, Wright, Mountain, Katz, Sugarman, Cramer, Christie-Blick and Pekar2005; Van Simaeys et al. Reference Van Simaeys, Brinkhuis, Pross, Williams and Zachos2005; Fig. 15), concurrent with major glaciation in Antarctica (e.g. Lear et al. Reference Lear, Rosenthal, Coxall and Wilson2004; Tripati et al. Reference Tripati, Backman, Elderfield and Ferretti2005; Pekar & Christie-Blick, Reference Pekar and Christie-Blick2008). Furthermore, it correlates with the regional O1 unconformity in the eastern North Sea (Huuse & Clausen, Reference Huuse and Clausen2001; Huuse, Reference Huuse, Dorè, Cartwright, Stoker, Turner and White2002; Stoker et al. Reference Stoker, Praeg, Shannon, Hjelstuen, Laber, Nielsen, Van Weering, Sejrup, Evans, Doré and Vinning2005; Japsen et al. Reference Japsen, Green, Nielsen, Rasmussen and Bidstrup2007). A marine origin for the unconformity is suggested from the shape of the erosional surface which resembles marine incision, possibly from ocean currents. Marine incision at the Eocene–Oligocene boundary has also been proposed by Clausen et al. (Reference Clausen, Gregersen, Michelsen and Sørensen1999) and Huuse & Clausen (Reference Huuse and Clausen2001) for offshore Denmark, to the east of the study area.
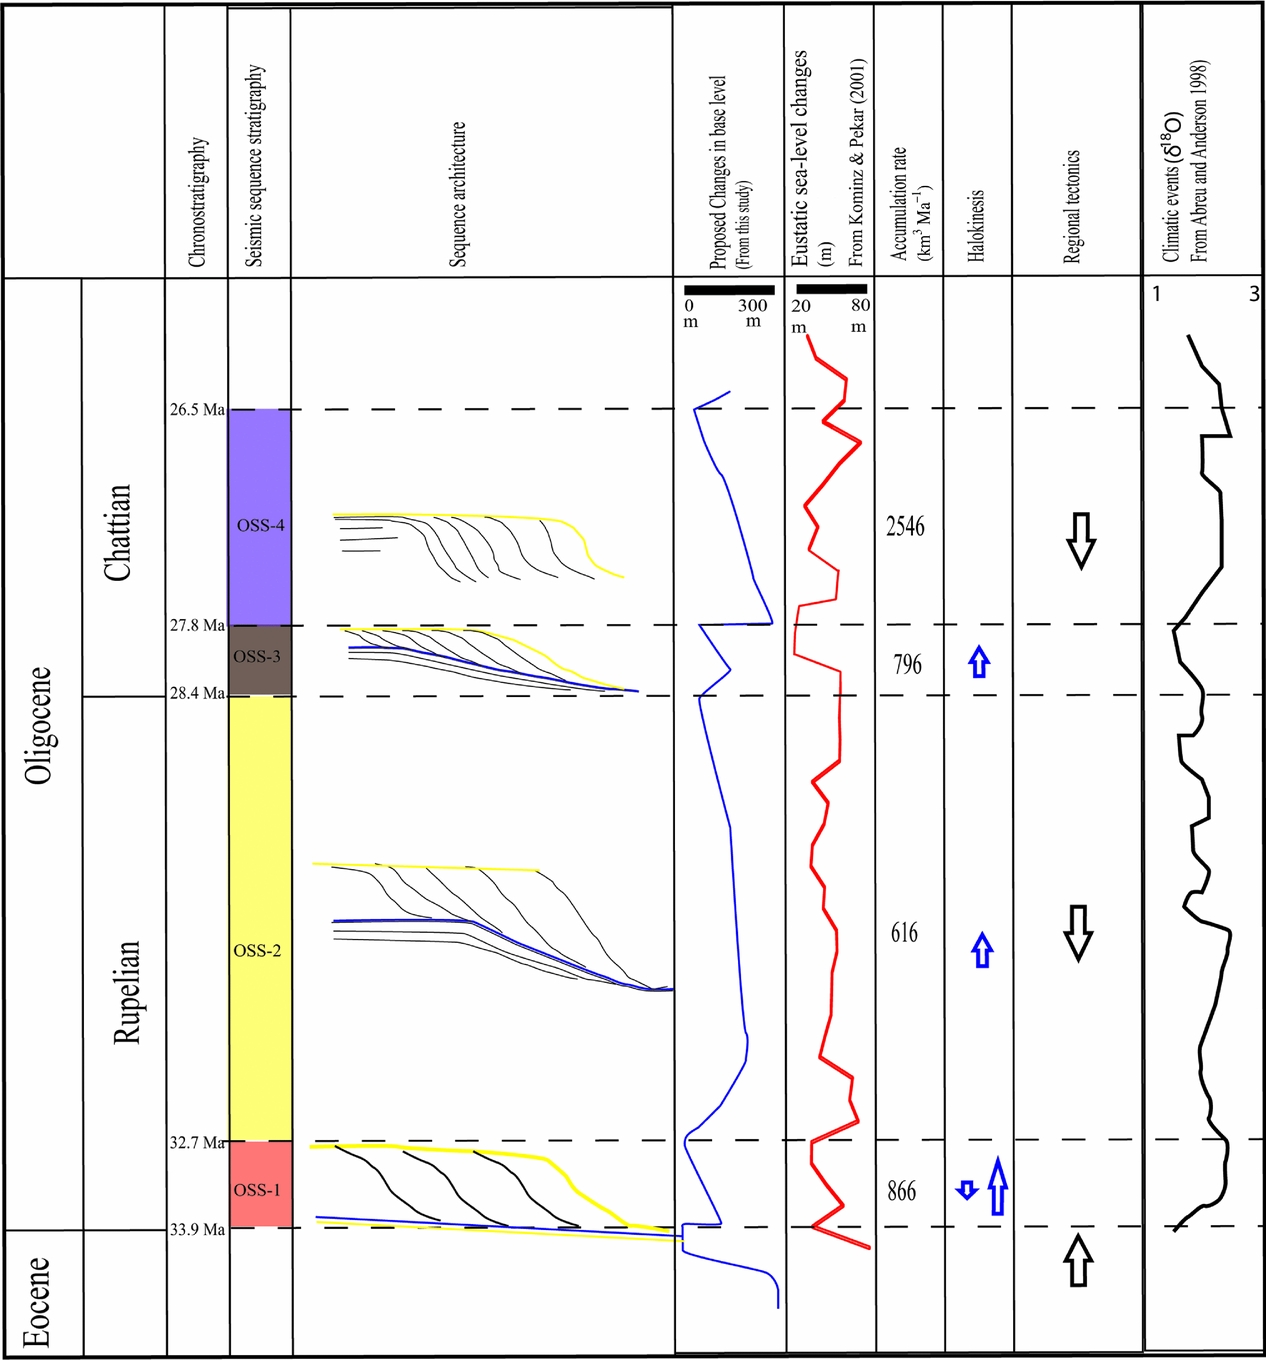
Figure 15. Summary of sea-level changes and regional subsidence during deposition of the individual sequences from this study compared to the eustatic sea-level changes proposed by Kominz & Pekar (Reference Kominz and Pekar2001). Note the vast sediment volume rate in OSS-4.
The sea-level rise associated with deposition of the TST at the base of OSS-1 is correlative with a rise in eustatic sea level of about 30 m during the early phase of deposition of OSS-1 (Kominz & Pekar, Reference Kominz and Pekar2001; Miller et al. Reference Miller, Kominz, Browning, Wright, Mountain, Katz, Sugarman, Cramer, Christie-Blick and Pekar2005; Fig. 15). However, when considering that water depth was c. 100 m during deposition of the RST of the same sequence, additional basin subsidence is required. In particular, one salt structure shows re-activation and diapir growth in the central part of the OSS-1 depocentre. Subsidence from salt removal in the subsurface may have led to additional basin subsidence during early Rupelian time (halokinesis is discussed in more detail in Section 6.b). This is a reflection of how the accommodation space related to OSS-1 developed mainly during marine erosion at the Eocene–Oligocene boundary, combined with halokinesis and rise in eustatic sea level during early Rupelian time.
Succeeding progradation and deposition of the RST of OSS-1 and erosion of the clinoform topsets indicates that the accommodation space created during early Rupelian time was infilled by the RST of the same sequence. The erosional character of the upper bounding surface of OSS-1 (Fig. 7) may reflect either: (1) subaerial exposure and continental incision; (2) erosion and truncation from deep marine currents; or (3) a shallow marine ravinement surface. Both subaerial and deep marine erosion are often recognized by incision, parallel and/or perpendicular to the direction of progradation. Deep marine erosion/incision often occurs basinwards of the clinoform break point, which has previously been documented to have occurred during Cenozoic time in the North Sea Basin (Clausen et al. Reference Clausen, Gregersen, Michelsen and Sørensen1999; Huuse & Clausen, Reference Huuse and Clausen2001). The SU at the top of OSS-1 signifies clinoform toplap truncation (Fig. 7). Incised valleys that may reflect deep marine or continental incision have not been observed at the top of OSS-1 anywhere in the study area. We therefore propose that shallow marine erosion formed the SU at the top of OSS-1, supported by the observation of shallow water fossil assemblages in well 11/10–1, indicating deposition in the middle neritic zone (Fig. 4). Although seismic resolution of the dataset should be adequate to identify channel incision, also observed at the SU at the top of OSS-2 (Fig. 12), it is noteworthy that similar features may be present but are below seismic resolution at the top of sequence OSS-1. However, based on the character of the erosional surface at the top of OSS-1, it is suggested here that the accommodation space available during early Rupelian time was infilled by OSS-1 sediments. As the upper sequence unconformity corresponds to the Oi1a global cooling event (Pekar et al. Reference Pekar, Christie-Blick, Kominz and Miller2002; Sliwinska & Heilmann-Clausen, Reference Sliwinska and Heilmann-Clausen2011), it is however also likely that a drop in eustatic sea level took place at the later phase of deposition of OSS-1.
Following maximum regression and toplap truncation during early Rupelian time (top of OSS-1), aggradation and subsequent flooding of the RST of sequence OSS-1 indicates a rise in relative sea level and the creation of new accommodation space. The aggrading TST in the lower part of OSS-2 corresponds to a period of increased eustatic sea level (Kominz & Pekar, Reference Kominz and Pekar2001; Fig. 15). This was followed by a lowering of the eustatic sea level of the same magnitude, which indicates that global sea-level changes alone cannot explain the development of new accommodation space involving an increase in water depth of a minimum of 250 m (Fig. 15). In general, isostatic flexuring due to denudation of the hinterland and sediment loading are important factors regarding subsidence in a sedimentary basin (Watts, Karner & Steckler, Reference Watts, Karner and Steckler1982; Reynolds, Steckler & Coakley, Reference Reynolds, Steckler and Coakley1991), and probably also during late Palaeogene and Neogene time in the North Sea (e.g. Huuse, Reference Huuse, Dorè, Cartwright, Stoker, Turner and White2002; Goledowski et al. Reference Goledowski, Nielsen and Clausen2012). These processes are considered to be slow, which may explain subsidence patterns over longer periods on the scale of first-order sequences (e.g. the complete Oligocene sedimentary succession in the North Sea; Watts, Karner & Steckler, Reference Watts, Karner and Steckler1982; Cloetingh et al. Reference Cloetingh, Gradstein, Kooi, Grant and Kaminski1990). Exceptions are when isostatic rejuvenations are related to glacial meltdown where isostatic adjustments of hundreds of metres may take place within a period as short as thousands of years, as revealed during post-glacial rebound in Scandinavia during Quaternary time (e.g. Riis, Reference Riis1996). The northern hemisphere was most likely devoid of continental glaciers during Oligocene time (e.g. DeConto et al. Reference Deconto, Pollard, Wilson, Palike, Lear and Pagani2008); isostatic rejuvenations therefore fail to explain basin subsidence and the rapid creation of accommodation space over the short time periods of the Oligocene seismic sequences in the eastern North Sea. The creation of accommodation space of c. 250 m during late early Oligocene time cannot be solely explained by isostatic flexuring effects caused by increased erosion and sedimentation rates in the hinterland. This is supported by the low volume rates (accumulation rates) during late Rupelian time (Fig. 15), which indicate drier climatic conditions and lower erosion rates in the hinterland. It is therefore proposed here that the accommodation space related to the RST of sequence OSS-2 was created during tectonic uplift of southern Norway and corresponding basin subsidence in the eastern North Sea. The fact that sequence OSS-2 has a uniform thickness across the Fjerritslev Fault Zone area indicates that the northernmost parts of the study area were also likely influenced by basin subsidence. This implies that the sedimentary basin extended northwards, potentially across parts of the present southern Norwegian mainland.
The deposition of OSS-3 and OSS-4 reflects continued creation of accommodation space due to the relative rise of sea level during Chattian time. Lowering of the eustatic sea level took place during deposition of OSS-3 (Fig. 15; Kominz & Pekar, Reference Kominz and Pekar2001), which may indicate that the creation of accommodation space within the study area had a more local origin. However, the accretionary TST in the lower part of the sequence, combined with the basinwards shift in progradation compared to the RST of OSS-2, support the theory that the creation of accommodation space may have been related to a combination of long-term flexural isostatic effects and sediment compaction. The accommodation space relative to sequence OSS-3 was completely infilled by the RST of the same sequence, based on clinoform topset truncation at the upper bounding sequence unconformity (Fig. 13). This is supported by microfossil assemblages, indicating sediment deposition in the inner to middle shoreface in the 11/10–1 well area (Fig. 4). An early Chattian global cooling period (Kominz & Pekar, Reference Kominz and Pekar2001) may explain the increase in accumulated sediment volumes compared to the Rupelian OSS-1 and OSS-2 sequences, since wet-based alpine glaciers may have developed in the hinterland (DeConto et al. Reference Deconto, Pollard, Wilson, Palike, Lear and Pagani2008; Nielsen et al. Reference Nielsen, Gallagher, Leighton, Balling, Svenningsen, Jacobsen, Thomsen, Nielsen, Heilmann-Clausen, Egholm, Summerfield, Clausen, Piotrowski, Thorsen, Huuse, Abrahamsen, King and Lykke-Andersen2009). This is supported by the SU of OSS-3 corresponding to a period of forced regression in the North Sea area during maximum regression (Clausen, Sliwinska & Goledowski, Reference Clausen, Sliwinska and Goledowski2012). The lowering of the sea level was related to a global cooling event, which appears to have been synchronous with the Oi2 cooling event (Miller et al. Reference Miller, Mountain, Browning, Kominz, Sugarman, Christie-Blick, Katz and Wright1998; Clausen, Sliwinska & Goledowski, Reference Clausen, Sliwinska and Goledowski2012).
Following exposure of the shelf corresponding to the SU at top of OSS-3, new accommodation space with a water depth of c. 300 m was created (Fig. 6). The eustatic sea level fluctuated by tens of metres during late Chattian time, although with an overall rise of only c. 20 m (Fig. 15; Kominz & Pekar, Reference Kominz and Pekar2001). This indicates that additional basin subsidence is required to explain the remaining accommodation space available during infill of the RST of OSS-4. The accumulation rate of OSS-4 is three times higher relative to sequence OSS-3 (Fig. 15), implying that the erosion rate during deposition of OSS-4 must have been significantly higher than during early Chattian time (OSS-3). This may be related to the fact that the lower part of sequence OSS-4 corresponds in time with the Oi-2b cooling phase (Van Simaeys et al. Reference Van Simaeys, Brinkhuis, Pross, Williams and Zachos2005; Sliwinska, Clausen & Heilmann-Clausen, Reference Sliwinska, Clausen and Heilmann-Clausen2010), dated at c. 27.1 Ma (Miller et al. Reference Miller, Mountain, Browning, Kominz, Sugarman, Christie-Blick, Katz and Wright1998), increasing the potential of build-up of alpine glaciers in the hinterlands. However, when considering that global cooling also affected the OSS-3 sequence, similar accumulation rates for OSS-3 and OSS-4 would have been expected. The creation of accommodation space related to OSS-4 was rapid, considering the non-accretionary TST at the base of the sequence. Since isostatic rejuvenation related to glacial meltdown is unlikely to have occurred during Oligocene time (DeConto et al. Reference Deconto, Pollard, Wilson, Palike, Lear and Pagani2008), the rapid creation of accommodation space is most likely related to tectonic subsidence. The tectonic subsidence may have taken place in conjunction with tectonic uplift of the hinterland, which may further explain the three-fold increase in accumulation rate during OSS-4 relative to OSS-3.
6.a.1. Mechanisms causing basin subsidence
The exact mechanism responsible for the creation of accommodation space during Oligocene time is still being debated (Faleide et al. Reference Faleide, Kyrkjebø, Kjennerud, Gabrielsen, Jordt, Fanavoll, Bjerke, Dorè, Cartwright, Stoker, Turner and White2002; Anell, Thybo & Stratford, Reference Anell, Thybo and Stratford2010). However, observations from the current study indicate that basin subsidence is related to regional tectonic processes. This implies that processes in the hinterland and in the basinal realm acted simultaneously, and that the same mechanism simultaneously created both uplift in the hinterland and subsidence in the eastern North Sea area. No indications of major tectonic displacement of local origin are observed within the basin. This indicates that basin subsidence is related to large-scale lithospheric processes, such as differential vertical movements during compression of the lithosphere (lithospheric folding) or mantle processes. Both processes may cause long-wavelength deformation of the lithosphere of up to hundreds of kilometres, and the depocentres are characterized by accelerated basin subsidence (Vågnes, Gabrielsen & Haremo, Reference Vågnes, Gabrielsen and Haremo1998; Bourgeois et al. Reference Bourgeois, Ford, Diraison, Veslud, Gerbault, Pik, Ruby and Bonnet2007; Cloetingh & Burov, Reference Cloetingh and Burov2011) that triggered potential non-accretionary TSTs. However, the exact mechanism is still debated, and the reader is referred to Faleide et al. (Reference Faleide, Kyrkjebø, Kjennerud, Gabrielsen, Jordt, Fanavoll, Bjerke, Dorè, Cartwright, Stoker, Turner and White2002) and Anell, Thybo & Stratford (Reference Anell, Thybo and Stratford2010) for an overview of the discussion.
6.a.2. Shifting depocentres and drainage system
Although progradation direction may be influenced by several basinal processes (e.g. wave and tidal currents) with longshore transport, changes in the direction of progradation may reflect changes in the drainage system along with basin subsidence (Fig. 16). However, the gradual shift in progradation from NNW–SSE during earliest Chattian time (OSS-1) to NE–SW during Rupelian time (OSS-3 and OSS-4) may reflect a dynamic fluvial drainage system in the hinterland. The first progradational sequence into the eastern North Sea during early Oligocene time (OSS-1) represents the most severe shift in sediment transportation during Cenozoic time. The transportation of only minor amounts of erosional material into the eastern North Sea during Palaeocene–Eocene time indicates that the Oligocene sequences represent sediment deposition related to the initial tectonic uplift phase of southern Norway in late Palaeogene – Neogene time.
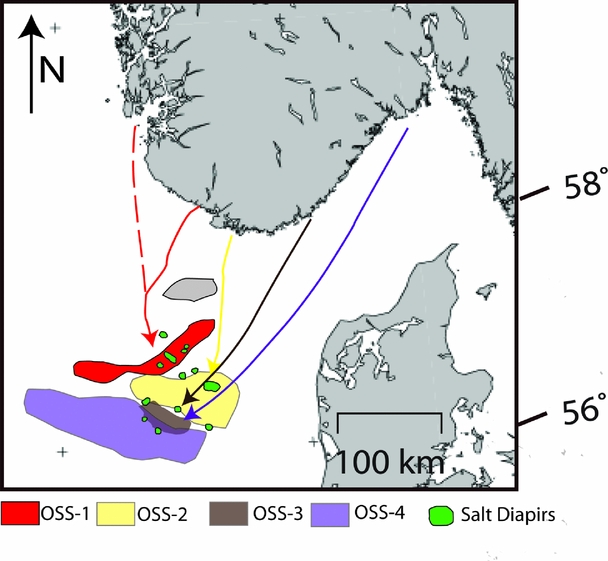
Figure 16. Position of the main depocentres of the OSS-sequences and illustration of drainage pattern during Oligocene time. Uplift of southern Norway may have forced the drainage system eastwards, with the result of sediment transportation mainly from the NNW and north during early Oligocene time and from the northeast during late Oligocene time.
The structural high along the Fjerritslev Fault Zone may have acted as a barrier during the deposition of OSS-1 and the lower part of OSS-2, forcing the sediment input to the west with subsequent south-eastwards dispersal (Fig. 15).
It is interpreted here that the drainage system shifted further eastwards during deposition of the upper part of OSS-2 and OSS-3 and OSS-4, allowing fluvial drainage systems to deliver detritus to the basin more from the north and northeast. Since only minor proportions of the Oligocene sedimentary succession in the northern North Sea have been sourced from southern Norway (e.g. Galloway et al. Reference Galloway, Garber, Liu, Sloan and Parker1993; Jordt et al. Reference Jordt, Faleide, Bjørlykke and Ibrahim1995; Jordt, Thyberg & Nøttvedt, Reference Jordt, Thyberg, Nøttvedt, Nottvedt, Larsen, Gabrielsen, Olaussen, Brekke, Torudbakken, Birkelnad and Skogseid2000; Faleide et al. Reference Faleide, Kyrkjebø, Kjennerud, Gabrielsen, Jordt, Fanavoll, Bjerke, Dorè, Cartwright, Stoker, Turner and White2002; Anell, Thybo & Artimieva, Reference Anell, Thybo and Artimieva2009), the watershed is likely to have been located far to the west, causing most of the erosional material to be transported south and south-eastwards. We believe the uplift of southern Norway has influenced the drainage pattern, as reflected by the shift in sediment transport direction and subsequent direction of progradation. As uplift continued more landmasses were gradually exposed, forcing the drainage system to follow established N–S- and NE–SW-striking lineaments on present-day eastern and southern Norway. This probably continued during Miocene time, when the lower Miocene deposits of onshore Denmark were sourced from southern Norway (Olivarius, Reference Olivarius2009) and south-westwards sediment dispersal and depocentre migration continued into the Central Graben area (e.g. Jarsve et al. Reference Jarsve, Faleide, Gabrielsen, Nystuen, Martinius, Ravnås, Howell, Olsen, Steel and Wonham2014).
6.b. Halokinesis
The prime mechanism for halokinesis in the study area generally appears to be related to differential loading. This often developed in sedimentary basins as prograding successions created greater loading in some parts of the depositional area compared to elsewhere (e.g. Trusheim, Reference Trusheim1960; Seni & Jackson, Reference Seni and Jackson1983; Hughes & Davison, Reference Hughes and Davison1993; Kossow et al. Reference Kossow, Krawczyk, Mccann, Strecker and Negendank2000; Steward, Reference Steward, Ries, Butler and Graham2007). However, we cannot exclude the effect of active tectonism on salt mobilization in the study area, which was the prime mechanism regarding salt mobilization onshore Denmark during early Oligocene time (Japsen et al. Reference Japsen, Green, Nielsen, Rasmussen and Bidstrup2007).
The focus of this study is the intrinsic control on sedimentation caused by salt diapirism; one salt diapir in particular influenced the main depocentre of OSS-1. The actual size of the salt diapir appears to be limited in size relative to the size of the depocentre for it to have influenced basin development, however. We therefore believe halokinesis was insignificant with respect to the creation of accommodation space during early Oligocene time (OSS-1). However, halokinesis does seem to have influenced maximum progradation for OSS-1, OSS-2 and OSS-3 in parts of the depocentres, indicated by the thinning of all the seismic sequences across salt diapirs at the margins of the depocentres. Parts of the main depocentre infilled by OSS-1 are located around a salt structure located WSW of well 11/10–1 (Figs 7, 9), onlapping against the salt structure. These observation shows that the salt diapirs form intra-basinal topography, affecting sediment progradation. This effect also influences OSS-2 and OSS-3 progradation (Fig. 9). Sediment progradation is observed on either side of the salt diapirs, supporting the theory that halokinesis had an intrinsic control on sediment progradation. These observations indicate that halokinesis controlled the extension of maximum progradation and exerted an internal control of progradation within the main depocentres.
7. Conclusions
We have shown that renewed interpretation of the Oligocene succession, combining seismic sequence stratigraphic techniques, biostratigraphy and Sr-isotope stratigraphy and published climate data, provides an improved understanding of the coupling of tectonic and climatic influence on the Oligocene source to sink system in the eastern North Sea area.
Each of the four seismic sequences described in this article are characterized as T-R sequences, with a transgressive systems tract (TST) overlain by a regressive systems tract (RST). In OSS-1 and OSS-4 the TST are non-accretionary, while in OSS-2 and OSS-3 they are aggradational. Accommodation space developed simultaneously with initial sediment progradation from NNW. The main findings from this study are as follows.
-
• New age constraints from this study show that the sediment progradation from southern Norway was initiated during earliest Oligocene time and slightly post-dates the global cooling event at the Eocene–Oligocene boundary.
-
• It is documented here that the vast increases in water depths during deposition of the Oligocene seismic sequences were related to basin subsidence that outpaced a generally shallowing fall in eustatic sea level. It has also been shown that the creation of accommodation spaces was out of phase relative to intra-Oligocene eustatic sea-level fluctuations.
-
• Basin subsidence is likely to have accompanied tectonic rise of the southern Norwegian landmass, where the eastern part of the North Sea basin experienced subsidence forced by differential vertical movements of the lithosphere. These vertical movements gave rise to rapid changes in palaeowater depth and accompanying changes from potential subaerial exposure of basin platforms to marine flooding and water depths of up to c. 300 m.
-
• The shift in progradation direction from southeast during earliest Rupelian time to south and southwest during late Rupelian – Chattian time was a response to tectonic uplift in the western part of southern Norway, which may have forced the drainage system eastwards.
-
• Within the basin, halokinesis influenced the lateral extension of sediment progradation throughout Rupelian – early Chattian time. The halokinesis was caused by differential sediment loading in adjacent areas of the depositional basin. However, the limited sizes of the salt diapirs means that they are not considered to have influenced basin subsidence.
We have demonstrated that the creation and infill of accommodation spaces during Oligocene time in the eastern North Sea are related to both tectonic processes and climate changes. This study also highlights the importance of studying the interplay between tectonics and climate in order to better understand the source to sink relationship.
Acknowledgements
The authors would like to thank Fugro and TGS Nopec for making the seismic data available for this study. Erik S. Rasmussen, Mette Danielsen, Mads Huuse, Peter Japse and Amanadine Prelat are thanked for insightful and constructive comments on this paper. We are also grateful to Adrian Read for proofreading and commenting on the manuscript. We would also like to thank Rune Goa of NPD for improving the figures in the paper.


 Open access