


Data from several surveys in middle-income countries( Reference Oulamara, Agli and Frelut 1 – Reference Orden, Bucci and Petrone 4 ) have revealed an increase in prevalence of overweight in children and adolescents in the last decade. By contrast, studies in high-income countries have suggested that the rise in the prevalence of childhood overweight has plateaued, or even decreased( Reference Olds, Maher and Zumin 5 ). In Brazil, overweight among 5–9-year-old children more than tripled between 1974 and 2009, from 11 % to more than 33 %( 6 ). These data, as well as most studies on obesity trends, are based on BMI. BMI is widely used as a proxy for fatness, with the well-known advantage of being easy to measure, although it is a measure of excess weight relative to height rather than excess adiposity( Reference Freedman and Sherry 7 ). Moreover, BMI cannot indicate how body fat is distributed. In studies to monitor secular trends in growth and body composition for children and adolescents BMI has limitations, because the changes in fat-free mass cannot always be readily distinguished from changes in fat mass since BMI is a proxy for both( Reference Hughes, Li and Chinn 8 , Reference Kuczmaski 9 ).
Anthropometric measures of adiposity include skinfold thicknesses (SFT) and waist circumference (WC). SFT, a measure of subcutaneous adipose tissue, is well correlated with total body fat mass( Reference Sardinha, Going and Teixeira 10 ) and has been used to monitor adiposity in population studies( Reference Olds 11 , Reference Thompson, Baxter-Jones and Mirwald 12 ). WC and waist-to-height ratio (WHtR) are highly sensitive measures of central body fat accumulation that predict adverse cardiovascular risk factors( Reference Savva, Tornaritis and Savva 13 , Reference Browning, Hsieh and Ashwell 14 ). Central or abdominal body fat distribution in children and adolescents has been associated with metabolic abnormalities( Reference Freedman, Serdula and Srinivasan 15 ).
Temporal changes in BMI and adiposity measures in children have been reported in several countries( Reference Ying-Xiu and Shu-Rong 2 , Reference Orden, Bucci and Petrone 4 , Reference Kolle, Steene-Johannessen and Holme 16 – Reference Garnett, Baur and Cowell 18 ). The secular trend in height and weight in the Brazilian population was obtained by comparing surveys conducted in 1974/75, 1989, 2002/03 and 2008/09( 6 ). Additional data on temporal changes in BMI and prevalence of overweight and obesity in children and adolescents are scarce, as are data on their regional or local origin( Reference Flores, Gaya and Petersen 3 , Reference Cintra Ide, Passos and Fisberg 19 – Reference Wang, Monteiro and Popkin 21 ). In turn, no data on temporal variations in skinfold thickness, WC and WHtR for schoolchildren were found in the Brazilian literature. Accordingly, the aim of the present study was to describe changes in adiposity and body fat distribution by investigating changes in BMI, WC, WHtR and SFT between 2002 and 2007 in 7–10-year-old schoolchildren from Florianopolis, Brazil.
Methods
Participants
Data were extracted from the database of two cross-sectional epidemiological studies designed to investigate obesity-related behaviours of schoolchildren from Florianopolis in 2002 and 2007( Reference de Assis, Rolland-Cachera and Grosseman 22 – Reference de Assis, Calvo and Kupek 24 ). Florianopolis, the capital of Santa Catarina state (south of Brazil), has a high Human Development Index (HDI 2000=0·766; HDI 2010=0·847)( 25 ).
In 2002, a representative sample of 7–10-year-old schoolchildren from elementary schools in the city of Florianopolis was selected using a stratified cluster sampling design. Detailed sampling procedures have been published elsewhere( Reference de Assis, Rolland-Cachera and Grosseman 22 ). The schools were grouped into four strata, by geographic area (centre and coastal) and type of school (public and private). Schools with equal probability were randomly selected within each stratum. Of the 122 schools (seventy-eight public and forty-four private), sixteen schools (nine public and seven private) were randomly selected. All children enrolled in the 2nd to 5th grades were invited to participate, but only 7–10-year-old children were included in the analysis. After those outside the age range and with missing data were excluded, the final sample comprised 2936 schoolchildren (public schools=1988 children; private schools=948 children).
All sixteen schools were contacted again in 2007 and invited to participate in a second survey. This second-wave sample was calculated taking into account the estimated population of 7–10-year-old children living in Florianopolis by geographical area( 26 ). A sample size of 1100 children was estimated for this second wave, assuming 22·1 % prevalence of overweight( Reference de Assis, Rolland-Cachera and Grosseman 22 ) with a margin of error of 3 % around the point estimates and taking into account stratification and cluster effects. As a 10 % non-response rate was expected, the total sample increased to 1210 children. Fourteen schools accepted the invitation and the two private schools that refused were replaced by two others in the same stratum, including also another public school in the sample. Unlike the 2002 survey, a probabilistic sample of students was performed within each selected school. The expected total number of children was divided proportionally to the type of school (public and private) and geographical area (centre and coastal). In each school, the students were selected from a systematic sampling applied to a complete list of the students ordered by age and separately by sex. The list of selected children included possible substitutions in case of refusal. The final sample consisted of 1232 individuals from seventeen schools (782 children from eleven public schools and 450 children from six private schools). The children who refused to participate or who did not have parental consent were replaced by others from the same age range, living in the same geographic area and enrolled at the same school. The final number of children was slightly higher than the estimated value because of a lower-than-expected proportion of incomplete data obtained. Elementary school is mandatory in Florianopolis and nearly all 7–10-year-old children were enrolled in the 2nd to 5th grades.
Anthropometric data (weight, height, skinfolds and arm, waist and hip circumferences) were collected at both time points, and parents’ sociodemographic (monthly family income) and anthropometric information (self-reported weight and height) was assessed through a questionnaire. The present paper addresses the children’s changes in BMI, WC and skinfolds between 2002 and 2007.
Parents gave written consent for their child’s participation in the study, which was approved by the Human Studies Committee of the Federal University of Santa Catarina (protocol numbers 037/02 and 028/06).
Measurements
A trained research team measured the weight, height, circumferences and SFT of participants, following the standard techniques recommended by Lohman et al.( Reference Lohman, Roche and Martorell 27 ) in both studies. Theoretical and practical workshops on measurement techniques were held in order to standardize anthropometric measurements in both surveys. No data on reliability and accuracy of anthropometric measures were reported in 2002. In 2007, the intra-class (within-observer) correlation coefficients were >0·95 for SFT and >0·99 for WC, while the inter-class (between-observers) correlation coefficients were >0·95 for SFT and WC( Reference Frainer, Adami and Vasconcelos Fde 28 ). Anthropometric measurements were taken on lightly dressed barefoot children. WC (in centimetres) was measured at the midpoint between the lowest rib and the iliac crest (natural waist). SFT (in millimetres) were measured at four regional body sites: triceps, subscapular, suprailiac and median calf, on the right side of the body. The measurements were done in duplicate and a third measurement was performed if the duplicates differed by more than 1 mm. The average of two readings at each site or of the two nearest readings was used in the analysis.
All data were inserted twice into EpiData 3·2 software (Epidata Assoc., Odense, Denmark) by previously trained data imputers, and typing errors were corrected and revised.
Statistical analysis
In 2002, sampling weights were calculated taking into account the unequal probabilities of selection between private and public schoolchildren, resulting from the stratified sample design( Reference de Assis, Rolland-Cachera and Grosseman 22 ). In 2007, the data were weighted according to the respondents’ probability of being selected and took into account the population density of schoolchildren in the stratified sample design of the study( Reference de Assis, Calvo and Kupek 24 ).
The sampling and analytic structure with the distribution of participating schools and schoolchildren into the different strata in 2002 and 2007 are shown in Appendix 1 and Appendix 2, respectively. School sampling weights for each stratum (ranging from 2·6 to 13·7) underscored the need to adjust prevalence rates to reflect the real type of school distribution; that is, private schools would be over-represented and public schools under-represented in crude estimates. The complex survey design was taken into account in all analyses by using Stata’s ‘svy’ command.
Data analysis was conducted using only the cases that had full information regarding age, sex, height, weight, WC and skinfold thicknesses. BMI was computed as weight (in kilograms) divided by height (in metres) squared. BMI Z-scores were derived from sex- and age-specific BMI charts developed by the Centers for Disease Control and Prevention( 29 ). WHtR was calculated as WC (in centimetres) divided by height (in centimetres). BMI (raw and Z-score values), WC and WHtR values are presented as means and 95 % confidence intervals. Differences between 2002 and 2007 for BMI (raw and Z-score values), WC and WHtR were examined using the independent Student’s t test. Changes in anthropometric variables between study periods were tested by general linear regression models. SFT were analysed according to medians and interquartile ranges due to asymmetrical distribution. Differences between the surveys were examined for SFT using the significance of coefficients in linear quantile regression models by appropriate t statistics( Reference Koenker 30 ). In all the analyses anthropometric variables were defined as the dependent variables, study period was the fixed factor, and analyses were adjusted for type of school (public or private) and monthly family income (four categories of minimum wages, and a specific category with ~20 % of missing data, included only for adjustment). All analyses were stratified by sex.
Considering the sample size available, with 80 % sample power and 5 % alpha error, the study was able to detect statistically significant differences ≥0·5 kg/m2 in BMI, ≥1·0 cm in WC and ≥0·006 in WHtR, among boys. The corresponding values for girls were 0·4 kg/m2, 0·9 cm and 0·006. When considering the age range, the minimal detectable difference oscillated between 0·7 and 0·9 kg/m2 for BMI, 1·6 and 2·2 cm for WC and 0·010 and 0·013 for WHtR, in boys and girls, respectively.
The significance level was set at P<0·05. Statistical analyses were performed with the statistical software package STATA 11·0 and the package ‘Quantreg’ of the R Project( 31 ).
Results
The proportion of children in each age and sex category was balanced in both surveys and no statistically significant difference was observed (Table 1). Approximately one-third of the children attended private schools, and this proportion was 3·2 percentage points higher in 2007 compared with 2002 (P=0·01). Since the percentage of children who attended private schools was higher in 2007 than in 2002, all analyses were adjusted for type of school and monthly family income.
Table 1 Comparison of demographic and socio-economic characteristics of the 7–10-year-old schoolchildren from public and private schools in Florianopolis, Brazil in 2002 and 2007

† P values from χ 2 test.
‡ 1 minimum wage=$US 64 ($BR 200); September 2002 exchange rate.
§ 1 minimum wage=$US 204·30 ($BR 380); September 2007 exchange rate.
|| Missing monthly income data: 2002 (21·9 %); 2007 (18·1 %).
Attending a private or public school was highly dependent on monthly family income in both surveys. Among children whose parents reported monthly income of up to ten times the minimum wage (2002=$US 64; 2007=$US 204), approximately 95 % and 98 % were from public schools in 2002 and 2007, respectively. At the other end of income distribution, approximately 73 % of parents earning more than ten times the minimum wage enrolled their children in a private school, in both surveys.
Table 2 shows mean BMI (raw and Z-score values), WC and WHtR in each survey, as well as mean differences between 2002 and 2007 in crude and adjusted analyses (type of school and monthly family income), according to sex. Mean differences for BMI and WC were positive and of similar magnitude in crude and adjusted analyses of both sexes. Although a statistically significant increase in adjusted means was observed only for BMI (raw and Z-score values) in boys, no changes were observed for WHtR in either sex.
Table 2 Mean BMI (raw and Z-score values), WC and WHtR among 7–10-year-old schoolchildren from public and private schools in Florianopolis, Brazil in 2002 and 2007, stratified by sex
WC, waist circumference; WHtR, waist-to-height ratio.
† P values from t-test.
‡ Adjusted for school type and monthly family income.
§ Z-scores based on 2000 Centers for Disease Control and Prevention growth charts.
Figure 1 displays the changes in BMI (Fig. 1(a) and (b)), WC (Fig. 1(c) and (d)) and WHtR (Fig. 1(e) and (f)) between 2002 and 2007, according to sex and age. No statistically significant change was observed for adjusted mean BMI in any of the age groups or either sex. Adjusted mean WC and WHtR increased only in 9-year-old boys (P=0·04 in both cases).
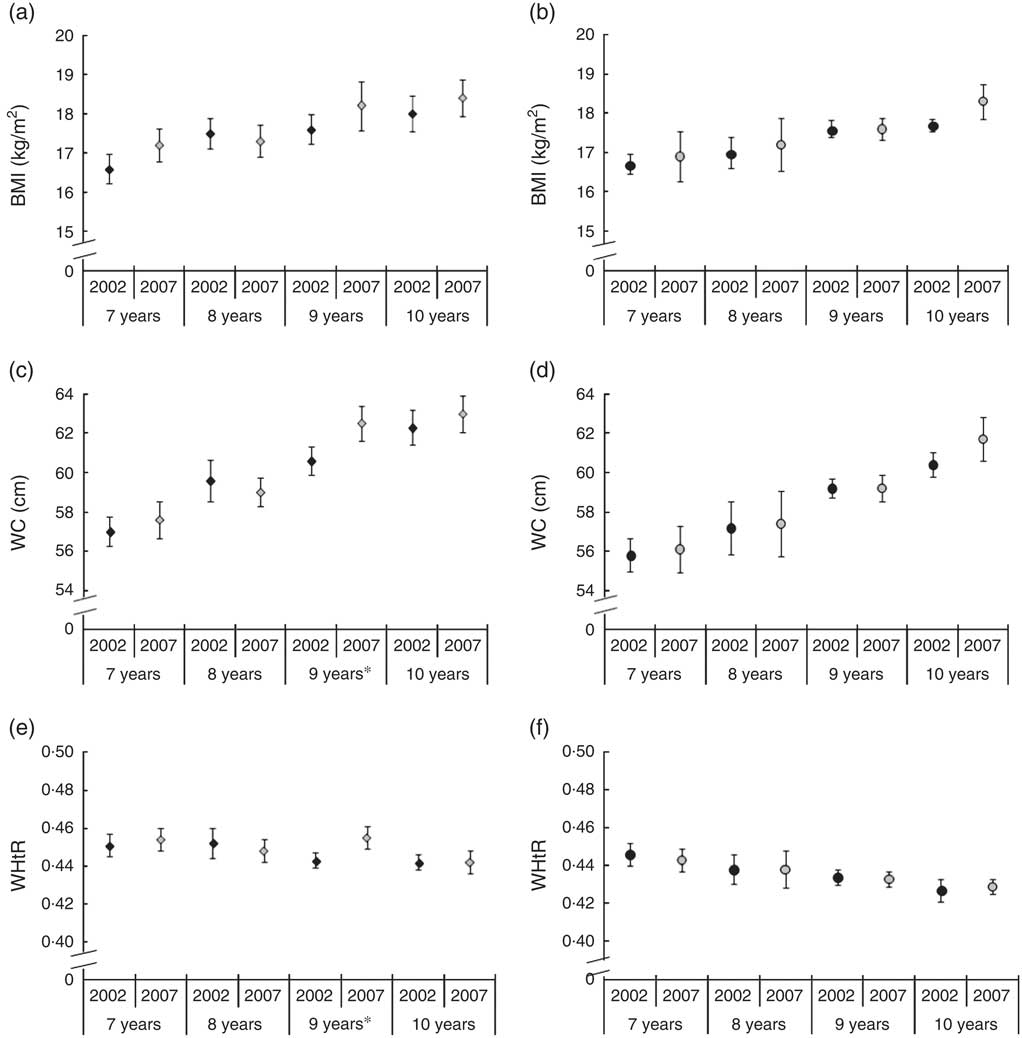
Fig. 1 BMI (a, b), waist circumference (WC; c, d) and waist-to-height ratio (WHtR; e, f) among 7–10-year-old schoolchildren from public and private schools in Florianopolis, Brazil in 2002 (![]() ) and 2007 (
) and 2007 (![]() ), stratified by sex (a, c, e, boys; b, d, f, girls) and age. Values are means, with their 95 % confidence intervals represented by vertical bars. Mean values were significantly different between years: *P<0·05
), stratified by sex (a, c, e, boys; b, d, f, girls) and age. Values are means, with their 95 % confidence intervals represented by vertical bars. Mean values were significantly different between years: *P<0·05
Table 3 presents the medians and interquartile ranges for triceps, medial calf, subscapular and suprailiac skinfold thicknesses in both surveys, as well as median differences between 2002 and 2007 in crude and adjusted analysis (type of school and monthly family income), according to sex. Triceps skinfold remained stable between 2002 and 2007, with median values of approximately 10 mm in boys and 12 mm in girls. By contrast, the adjusted median values for medial calf, suprailiac and subscapular skinfolds increased in both sexes (P<0·05).
Table 3 Median skinfold thicknesses and IQR among 7–10-year-old schoolchildren from public and private schools in Florianopolis, Brazil in 2002 and 2007, stratified by sex

IQR, interquartile range.
† P values from t test.
‡ Adjusted for type of school and monthly family income.
Figure 2 shows the changes in triceps (Fig. 2(a) and (b)), medial calf (Fig. 2(c) and (d)), subscapular (Fig. 2(e) and (f)) and suprailiac (Fig. 2(g) and (h)) skinfold thicknesses between 2002 and 2007, according to sex and age. Adjusted median values for peripheral SFT (triceps and medial calf) showed a levelling off over the 5-year period, except for 9-year-old girls, who exhibited an increase in medial calf skinfold (P=0·048). In turn, central SFT (subscapular and suprailiac) showed a statistically significant increase among boys for subscapular skinfold in 7-year-olds (P<0·001), 9-year-olds (P=0·012) and 10-year-olds (P=0·002), and for suprailiac skinfold in 9-year-olds (P=0·018). In girls, central skinfolds remained stable between 2002 and 2007, except in 8-year-olds, who displayed an increase in median values for suprailiac skinfold thickness (P=0·047).
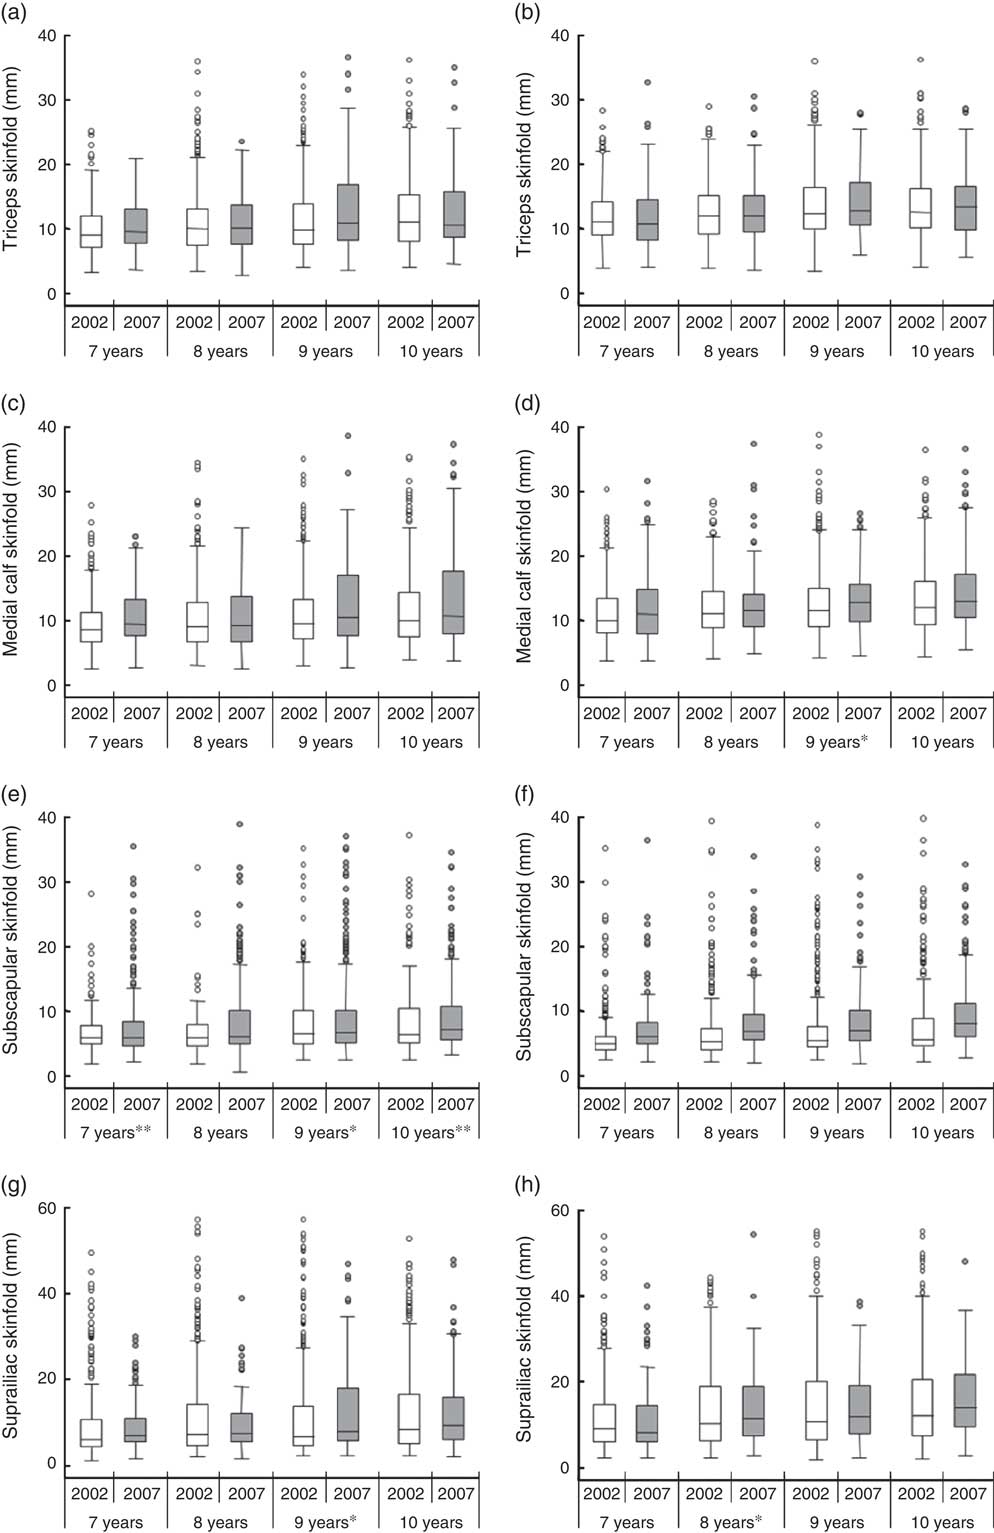
Fig. 2 Box-and-whisker plots of triceps (a, b), medial calf (c, d), subscapular (e, f) and suprailiac (g, h) skinfold thickness among 7–10-year-old schoolchildren from public and private schools in Florianopolis, Brazil in 2002 (![]() ) and 2007 (
) and 2007 (![]() ), stratified by sex (a, c, e, g, boys; b, d, f, h, girls) and age. The line within the box represents the median; the lower and upper edges of the box represent the 25th and 75th percentile, respectively (interquartile range); the lower and upper whisker represent the minimum and maximum values, respectively; and the circles represent outliers. Median values were significantly different between years: *P<0·05, **P<0·01
), stratified by sex (a, c, e, g, boys; b, d, f, h, girls) and age. The line within the box represents the median; the lower and upper edges of the box represent the 25th and 75th percentile, respectively (interquartile range); the lower and upper whisker represent the minimum and maximum values, respectively; and the circles represent outliers. Median values were significantly different between years: *P<0·05, **P<0·01
Discussion
The present study shows that the magnitude of BMI increase (raw and Z-score values) between 2002 and 2007 was similar in both sexes, although this change was statistically significant only in boys. In addition, the effect of time differences between 2002 and 2007 on the rise in WC in both sexes was attenuated after adjustment, with slight changes in mean differences. The WHtR appears to have plateaued, demonstrating that correcting WC for height may have influenced the estimate of central adiposity. On the other hand, the increase in subscapular, medial calf and suprailiac skinfold thicknesses indicates body fat accumulation, for both sexes. These results reveal a change in total body weight, in addition to body shape and body composition. Caution must be taken when generalizing these changes in light of the short period of time considered in the present study. Further analyses, with another study being carried out with data collected in 2012–2013, will help clarify the changes over time.
Findings from studies conducted in high- and middle-income countries seem to corroborate the results of the present study, given that Florianopolis exhibited the highest HDI of the Brazilian capitals in 2002 (HDI=0·766) and 2010 (HDI=0·847), comparable to countries with medium HDI (HDI between 0·50 and 0·79) and high-income countries (HDI>0·80)( 25 ). Data from a systematic review showed that prevalence of overweight and obesity has stabilized in all eight high-income countries included in the study and in China( Reference Olds, Maher and Zumin 5 ). Nevertheless, other studies performed with US (1988–1994 to 1999–2004)( Reference Li, Ford and Mokdad 32 ), British (1977 to 1997)( Reference McCarthy, Ellis and Cole 33 ), Australian (1985 to 2007)( Reference Garnett, Baur and Cowell 18 ) and Spanish (1995 to 2000–2002)( Reference Moreno, Sarria and Fleta 34 ) children and adolescents showed a significant increase in mean BMI and WC. A Norwegian study examined changes in anthropometric variables between 1999–2000 and 2005, adjusted for age, sexual maturity and school, and reported no increase in mean BMI among 9–11-year-old children, whereas a significant increase in WC was found for both sexes and an increase in SFT (triceps, biceps, subscapular and suprailiac) was observed for girls( Reference Kolle, Steene-Johannessen and Holme 16 ). Similar increases in BMI and WC were reported by studies in middle-income countries conducted with Indian adolescents (from 2003 to 2008)( Reference Singhal, Misra and Shah 35 ), 6–12-year-old Argentinean schoolchildren (from 1990 to 2005–2007)( Reference Orden, Bucci and Petrone 4 ) and 7–18-year-old Chinese (2005–2010)( Reference Zhao, Zu and Zhu 36 ).
Our results are in accordance with previous studies showing that increases in SFT are greater than increases in BMI( Reference Kolle, Steene-Johannessen and Holme 16 , Reference Moreno, Fleta and Sarría 37 ). Considering that SFT is a more direct measure of subcutaneous adipose tissue, this result may indicate that the relative weight gain is due to an increase in body fat. Furthermore, the highest relative change being observed for central skinfolds in both sexes compared with peripheral skinfolds suggests a rise in central fat.
The increase in childhood obesity and body adiposity has been attributed to a shift in activity patterns from outdoor play to indoor entertainment: television viewing, Internet and computer games( Reference Popkin 38 ). A decrease in the proportion of schoolchildren who actively commuted to school (from 49 % in 2002 to 41 % in 2007) was observed in both public and private schools in our study population( Reference Costa, Silva and Schmoelz 39 ). Further, between the two time points there was a reduction in the consumption of healthy foods (beans, meat/fish, fruits and vegetables), as well as an increase in the consumption of high-energy and low-nutrient foods (sodas, snack foods and pizza/French fries), in both types of school( Reference Costa, Assis and Leal 40 ).
Several studies have reported that WC is related to the metabolic complications of obesity such as poor lipid profile, increased blood pressure and insulin resistance in children and adolescents( Reference Freedman, Serdula and Srinivasan 15 , Reference Maffeis, Pietrobelli and Grezzani 41 , Reference Moreno, Pineda and Rodriguez 42 ). When measured in conjunction with height, WC provides a proportionality index; that is, whether or not the amount of upper body fat accumulation in relation to height is appropriate. WHtR appears to have plateaued between 2002 and 2007, in contrast to what was observed in previous studies on WHtR trends in 7–15-year-old Australian children from 1985 to 2007( Reference Garnett, Baur and Cowell 18 ) and among British adolescents aged 11–16 years between 1977/87 and 1997( Reference McCarthy and Ashwell 43 ).
In addition to comparisons between the sexes, stratification by age range is an effective method for controlling any possible confusion due to age differences between the two samples. Our results showed that significant changes in body composition between the study periods depend on age and sex. There was a significant increase in WC and WHtR among 9-year-old boys, consistent with their relative changes in subscapular and suprailiac SFT. The graphical presentation of the data, which allows an assessment of changes without depending exclusively on statistical test interpretation, showed that the central skinfolds, especially the subscapular skinfold, increased between the study periods in all age ranges. A study conducted in the USA with 7–17-year-old children and adolescents showed that the relationships between anthropometric measures (WC, waist-to-hip ratio, triceps, suprailiac and subscapular SFT, and SFT ratios) and body fat distribution (measured by dual-energy X-ray absorptiometry) all depended on age, and that some of the measures were also dependent on gender, race or body fat percentage( Reference Daniels, Khoury and Morrison 44 ). Other biological variables that affect height and body composition must be investigated to determine the reasons for the secular trend towards increased adiposity among children and adolescents, such as age at sexual maturation( Reference Thompson, Baxter-Jones and Mirwald 12 ). Unfortunately, this information was not obtained in our sample of 7–10-year-old children and was not included for analysis.
We highlight the importance of analysing nutritional status in order to evaluate not only BMI values, but also body composition. Although BMI is the most widely used measure of adiposity, body composition and body fat distribution can be highly variable between individuals with the same BMI( Reference Prentice and Jebb 45 ). Skinfold measurements, which provide additional information on changes in body fat distribution, are considered good indicators of total body fatness( Reference Sardinha, Going and Teixeira 10 ). The method is also simpler to use than laboratory techniques and costs are minimal; however, it is prone to random and systematic errors( Reference Ulijaszek and Kerr 46 ). For this reason, measures were adopted in 2002 and 2007 to reduce the likelihood of error, including not only training prior to evaluations, but also standardization and the use of properly calibrated equipment. The lack of information on technical measurement errors in 2002 may be of concern, but the investigators were thoroughly trained, minimizing the possibility of assessment bias.
A strong point of the current study was the fact that several objective measures of body mass and body composition were included. Further, the samples described are representative of the target population in Florianopolis and the incorporation of socio-economic variables (type of school and monthly family income) as moderators in the statistic model avoided the overestimation of the magnitude and/or direction of the differences found between the two time points. It is unlikely that the changes in anthropometric variables were due to methodological differences between studies.
In summary, our data showed an increasing trend in BMI among boys, and in subscapular, suprailiac and medial calf SFT in both boys and girls aged 7–10 years, over a 5-year period. The increase in central skinfold thickness between 2002 and 2007 indicates that the relative change is due primarily to a rise in central adiposity. This result is particularly important because fat accumulation in the early years of life has a tendency to persist into adulthood and obesity is linked to serious medical and psychological complications in children, adolescents and adults as well.
Acknowledgements
Financial support: This research received funding from the Foundation for Support of Scientific and Technological Research in the State of Santa Catarina (FAPESC; grant number 062/2002); the National Council for Scientific and Technological Development (CNPq; grant number 402322/2005-3); and the Scholarship Program from the Support Fund for Maintenance and Development of Higher Education (FUMDES). FAPESC, CNPq and FUMDES had no role in the design, analysis or writing of this article. Conflict of interest: None. Authorship: The authors’ responsibilities were as follows: D.B.L. participated in the concept, data analysis and interpretation, and preparation of the paper. M.A.A.A. participated in the design, ethics submission, supervised the study implementation including recruitment, anthropometric measurements, interpretation and preparation of the paper. D.A.G.-C. and D.F.A. assisted with data analysis, interpretation and reviewed the paper. F.F.C. and A.S.L. assisted with interpretation and reviewed the paper. All authors had final approval of the submitted and published versions. Ethics of human subject participation: Parents gave written consent for their child’s participation in this study, which was approved by the Human Studies Committee of the Federal University of Santa Catarina (protocol numbers 037/02 and 028/06).
Appendix 1 Sampling and analytic structure by type of school (public or private) and geographical area (centre or coastal) in the 2002 survey

Appendix 2 Sampling and analytic structure by type of school (public or private) and geographical area (centre or coastal) in the 2007 survey


