


Vitamin D deficiency is prevalent among aged-care residents due primarily to reduced sunlight exposure( Reference MacLaughlin and Holick 1 ) and inadequate dietary intake. The most severe consequence of vitamin D deficiency is osteomalacia; however, lesser degrees of vitamin D deficiency are associated with increased risk of osteoporosis, fractures and falls due to its essential role in Ca homeostasis. Vitamin D is known to contribute to bone health, nerve functioning, muscle synthesis and strength( 2 – Reference Bouillon, Schoor and Gielen 7 ) with supplementation studies in adults aged 65 years or older demonstrating improved lower-limb strength, reduced body sway( Reference Dawson-Hughes 6 ) and reduced rates of falls in the aged-care setting( Reference Rolland, de Souto Barreto and van Kan 8 ). Furthermore, the presence of vitamin D receptors in non-skeletal tissues has led to growing research examining the association between vitamin D and other common diseases of particular relevance in ageing adults including frailty( Reference Pabst, Zimmermann and Huth 9 ), inflammation( Reference De Vita, Lauretani and Bauer 10 ), cognitive decline( Reference Balion, Griffith and Strifler 11 – Reference Annweiler, Dursun and Féron 13 ) and dementia( Reference Annweiler, Dursun and Féron 13 ).
New Zealand’s high latitude (35–47°S) and absence of universal vitamin D food fortification further predisposes the population to poor vitamin D status, particularly in the winter months. The main marker of vitamin D in the body is 25-hydroxyvitamin D (25(OH)D) and it reflects both the dietary intake of vitamin D and endogenous skin production. The optimal level of circulating 25(OH)D is, however, controversial. Evidence-based guidelines issued in 2010 by the US Institute of Medicine state that serum concentrations greater than 50 nmol/l are considered sufficient for health at all ages( 2 ), whereas recommendations issued by other expert groups specific to older adults recommend serum 25(OH)D levels greater than 60 nmol/l( Reference Dawson-Hughes 6 ) or 75 nmol/l( 14 ). Reported average serum 25(OH)D levels in aged-care residents can range from 11·8 to 43·8 nmol/l, with most studies reporting more than half of residents having vitamin D insufficiency (<50 nmol/l)( Reference Rolland, de Souto Barreto and van Kan 8 ).
While the benefit of vitamin D supplementation for community-dwelling older adults has recently been questioned( Reference Reid, Bolland and Grey 4 , Reference Bolland, Grey and Gamble 15 ), vitamin D supplementation continues to be recommended for aged-care residents( 14 , 16 ). In New Zealand, the Accident Compensation Corporation, a government-funded department which provides personal injury cover for all New Zealand residents, encourages the provision of a government-subsidised, monthly vitamin D supplement for all aged-care residents as part of a wider falls reduction programme. In this capacity the Accident Compensation Corporation, in collaboration with district health boards, recommends a loading dose of 2500 µg (100 000 IU) cholecalciferol (vitamin D3) in the first month followed by a maintenance dose of 1250 µg (50 000 IU) monthly thereafter for life( 17 , Reference Campbell and Robertson 18 ). This preventive ‘Vitamin D within Residential Care’ programme was piloted in 2008 and subsequently implemented nationwide by 2011( 19 , Reference Willaims 20 ). Assessment of vitamin D status is not recommended at any stage of the Accident Compensation Corporation programme due to the presumed high likelihood of vitamin D deficiency in older aged-care residents and effectiveness of supplementation at improving vitamin D status( 2 ). As such, there is little information that addresses the need for, and implications of, long-term supplementation on serum 25(OH)D levels of this population group.
To the best of our knowledge, the present study is the first to examine the vitamin D status of New Zealand aged-care residents since the government-led programme was initiated. It is also the first study to investigate a population-based approach to vitamin D supplementation in aged-care residents. Moreover, we examined the predictors of serum 25(OH)D concentration and investigated whether the government-funded vitamin D supplementation programme was associated with adequate vitamin D status.
Methods
Study design and population
The current cross-sectional survey was conducted in two phases from February to September 2014 and involved 309 participants recruited from sixteen aged-care facilities (nursing homes) throughout New Zealand (North and South Island, latitude ranging from 37°S to 46°S). In phase one, participants were recruited from February to April (late summer/autumn), and phase two encompassed the months of July to September (late winter/spring). Residents were eligible for inclusion if they were over 65 years of age (with no upper age limit) and were receiving residential rest-home level care. Rest-home level care is the lowest level of residential care in New Zealand and is for residents who require 24 h supervision with activities of daily living, but who are generally able to self-feed and are mobile with supervision. To minimise the influence of nutritional effects of residing in the community prior to aged-care admission, participants were excluded from the study if they had been admitted to an aged-care residence within the 12 weeks prior to data collection commencing.
Trained research assistants collected all study data. Information regarding age, ethnicity, aged-care length of stay, medical history, medication and nutritional supplement use was collected from clinical notes and in discussion with both the participants and care staff. A pretested sociodemographic and health status questionnaire was also administered to each participant, which collected information on perceived exhaustion, appetite, walking ability and mood. Participants were identified as either non-smoker or current smoker based on their response to the question ‘Do you currently smoke cigarettes?’
Anthropometric measurements
Anthropometric measurements were taken on the non-dominant side in triplicate by the same trained research staff using standardised techniques and calibrated equipment. Standing height was not measured as most participants were unable to be positioned correctly on a stadiometer. Instead, height was estimated from ulna length measured using a Lufkin Executive Thinline anthropometry tape (Apex Tool Group, Baltimore, MD, USA), while participants were seated in a standardised position. Ulna length was converted to height using published conversion charts( 21 ). Body weight was measured using Seca 813 scales (Seca Corporation, Hamburg, Germany). For participants unable to stand on these scales, seated scales from the aged-care facility were used. These scales were calibrated against the study scales; differences for all facilities were less than 0·5 kg. BMI (kg/m2) was calculated from the estimated height and measured body weight. Cut-offs which represent increasing adiposity and which have previously been used to categorise BMI in similar populations( 22 , Reference Wood, Secombes and Thies 23 ) were used as follows: underweight, <20 kg/m2; healthy weight, 20–24·99 kg/m2; overweight, 25–29·99 kg/m2; and obese, ≥30 kg/m2.
Dietary assessment
Dietary intake data for all main meals, daytime snacks and beverages, including macronutrient-dense oral nutritional supplements (e.g. Complan, Diasip or Ensure), were collected by the same trained research assistants using weighed, 3 d food records. Dietary data were collected over one week on non-consecutive days, consisting of two weekdays and a weekend day. All food and beverages that were served to each participant were weighed prior to consumption using Salter electronic scales accurate to within ±1 g (range 2–2000 g; Salter Housewares Ltd, Tonbridge, UK). The weight of leftovers returned at the end of the meal service was then subtracted to determine the net dietary intake. Details of evening snacks and any foods and beverages consumed away from the rest home were collected using food diaries and interviewer-administered food recalls. Portion sizes for the recall dietary intake were estimated using serving sizes comparable to those for the particular rest home.
Dietary vitamin D intake was not assessed because the New Zealand Food Composition Database has incomplete vitamin D data. Dietary Ca intakes were determined with the use of computer software (Kai-culator, version 1.1; University of Otago, Dunedin, New Zealand) which matches foods to nutrient lines in the 2010 New Zealand Food Composition Database (Plant & Food Research, New Zealand). There were no missing values for Ca in this database. Total Ca intakes were calculated by adding the Ca content of dietary supplements to each participant’s dietary Ca intake. The distributions of usual Ca intakes, both dietary and total, were estimated using IMAPP software (version 1.02; Iowa State University, Ames, IA, USA) to remove the effect of day-to-day variation in nutrient consumption( Reference Gibson 24 , Reference Dodd, Guenther and Freedman 25 ). In addition, the proportion of participants with inadequate Ca intakes was calculated using the estimated average requirement (EAR) cut-point method based on the Nutrient Reference Values for Australia and New Zealand( 3 ).
Data regarding vitamin D- and Ca-containing supplements and medications were collected from resident drug charts and clinical records. Detailed information about the type, consumption frequency and dose was collected for all participants with reported use. The vitamin D and Ca content of supplements and medications was obtained from product labels, websites and the New Zealand drug formulary( 26 ). Medications known to decrease serum 25(OH)D levels (anticonvulsants, corticosteroids and lipid-regulators)( 2 , 14 , Reference Holick and Chen 27 ) were identified from participants’ drug charts and coded as a categorical variable: prescribed or not.
Malnutrition and frailty
Risk of malnutrition was assessed for each participant using the Mini Nutritional Assessment Short Form (MNA-SF)( Reference Rubenstein, Harker and Salvà 28 ), a six-item questionnaire examining appetite, mobility, psychological and anthropometric parameters. Scores from the MNA-SF were categorised as follows: ≥11, normal nutrition; 8–11, at risk of malnutrition; and 0–7, malnourished( 21 ).
Frailty scores were determined using the Survey of Health, Ageing and Retirement in Europe Frailty Instrument (SHARE-FI)( Reference Romero-Ortuno, Lawlor and Kenny 29 ). Participants were assigned a score for each of five variables: exhaustion, diminished appetite, low activity, walking difficulty and weakness. Exhaustion, appetite change, low activity and walking difficulty were scored based on participant responses to previously validated questions. Weakness was determined by handgrip strength, measured with a digital dynamometer (JAMAR PLUS+ Model J000105 Hydraulic Hand Dynamometer; Sammons Preston, Bolingbrook, IL, USA) using a standardised protocol( Reference Roberts, Syddall and Sparkes 30 ). The highest measurement recorded from either hand was included as a continuous variable for weakness in the SHARE-FI calculators. Participants were subsequently categorised as non-frail, pre-frail or frail as per the sex-specific cut-offs validated by Romero-Ortuno and colleagues( Reference Romero-Ortuno, Lawlor and Kenny 29 ).
Laboratory analyses
Fasting peripheral venous blood samples (6 ml) were collected from 292 participants by trained phlebotomists in trace-element-free tubes and placed on ice for transport to a central laboratory on the same day as collection. Serum was then separated by centrifugation (3000 g for 10 min at 4°C) and stored at −80°C.
Serum 25-hydroxyergocalciferol (25(OH)D2) and 25-hydroxycholecalciferol (25(OH)D3) concentrations were determined using isotope-dilution LC–tandem MS on an API 3200 instrument (Applied Biosystems, Foster City, CA, USA) based on the method of Maunsell et al.( Reference Maunsell, Wright and Rainbow 31 ). The National Institute of Standards and Technology (NIST) Standard Reference Material SRM 972 Vitamin D Metabolites in Frozen Human Serum was used in the set-up of the method. The limit of quantification for the assay was 5 nmol/l for both metabolites. Values less than 5 nmol/l were considered to be zero. During the analysis, pooled serum samples and external quality control (UTAK Laboratories, Inc., Valencia, CA, USA) were used to check the precision and accuracy. The pooled serum between-assay CV was 2·8 %. Values for the low and medium controls fell within the verified ranges for both the 25(OH)D3 low value of 25·0 nmol/l (mean 28·7 (sd 1·2) nmol/l; CV 4·2 %) and medium value of 69·9 nmo/l (mean 67·3 (sd 1·9) nmol/l; CV 2·8 %) and the 25(OH)D2 low value of 29·1 nmol/l (mean 27·6 (sd 1·3) nmol/l; CV 4·7 %) and medium value of 67·9 nmol/l (mean 70·8 (sd 2·7) nmol/l; CV 3·8 %). Recommendations from the US Institute of Medicine( 2 ) and the Joint Consensus Statement on Vitamin D and Sun Exposure in New Zealand( 32 ) were the basis for defining vitamin D insufficiency as serum 25(OH)D concentration <50 nmol/l.
Intact parathyroid hormone (PTH) was measured by an automated electrochemiluminescence immunoassay (Elecsys 2010®; Roche Diagnostics GmbH, Mannheim, Germany). Manufacturer-provided controls (Elecsys Preci-Control Varia 1 and 2) were analysed with each reagent kit. The means and CV for the two controls were 59·13 (sd 1·31) pg/ml and 2·2 % and 195·05 (sd 3·35) pg/ml and 1·72 %, respectively, and were within the range of the results provided by the manufacturer. Pooled serum inter-assay CV was 4·3 % (n 13).
Serum α1-acid glycoprotein 2 (AGP), a measure of chronic inflammation, was determined by automated immunoturbidimetric assay (Cobas c311®; Roche Diagnostics GmbH). Controls provided by the manufacturer, PreciControl ClinChem Multi 1 and 2 (PCCM1 and 2), were analysed daily. The means and CV for the two controls were 0·51 (sd 0·02) g/l and 3·9 % and 0·85 (sd 0·02) g/l and 2·4 % respectively, and were within the range of the results provided by the manufacturer The inter-assay CV based on a pooled serum was 7·8 % (n 7).
Serum creatinine was measured using Creatinine Jaffé Gen.2 kinetic colorimetric assay (Cobas c311®; Roche Diagnostics GmbH). Controls provided by the manufacturer (PCCM1 and PCCM2) were analysed daily. The means for the two controls were 96 (sd 1·0) µmol/l (CV 1·0 %) and 368 (sd 5·8) µmol/l (CV 1·6 %), respectively. Serum creatinine, age and sex were then entered in the online calculator from the Chronic Kidney Disease Epidemiology Collaboration (CKD-EPI) to determine estimated glomerular filtration rate (eGFR)( 33 ), an indicator of renal function.
Statistical methods
All statistical analyses were performed using Stata statistical software package version 12.1. Differences between participants who provided blood samples and those who did not were assessed using the Wilcoxon or Mann–Whitney test, where appropriate, for the continuous variables, the χ 2 test for categorical variables and, where frequency was less than five participants (e.g. smoking), Fisher’s exact test.
Factors related to serum 25(OH)D were examined by univariate regression, applying clustered (rest home) standard errors. Covariates, with either an established or potential impact on sun exposure and vitamin D metabolism, were age, sex, geographical location, season of blood collection (classified as autumn or spring), BMI category, supplemental vitamin D intake, oral nutritional supplements containing vitamin D, renal function (measured by eGFR), inflammation (measured by AGP) and current smoking status. Furthermore, variables pertinent to the study population (duration of aged-care residency, frailty and malnutrition risk) were also examined using unadjusted univariate regression applying the same clustered standard errors. Covariates with P<0·20 or that had been a priori selected (namely geographical location, season, age and sex) were then included in the final multiple regression model to determine the independent contributions of sociodemographic, biochemical, anthropometric and health predictors of 25(OH)D status. Furthermore, interactions between age and sex and between different modes of vitamin D supplementation were investigated. One participant was excluded from regression analysis because s/he was taking 1,25-dihydroxyvitamin D (calcitriol), an active vitamin D metabolite.
The relationship between serum 25(OH)D and PTH concentrations was evaluated using fractional polynomial regression, controlled for Ca intake( Reference Royston and Altman 34 ). Bootstrapping was used to obtain confidence intervals for the point of maximal suppression on the basis of 1000 bootstrapped samples and defining maximal suppression as the lowest concentration of 25(OH)D where PTH is ≤25 % higher than its lowest (positive) value. This is approximately equivalent to the approach where −3/C is the estimated point of maximal suppression and an exponential model (y=A+B× e C×25(OH)D) was applied to this data set with an additional linear term for dietary Ca (the approximate estimates being A=x, B=x and C=x). A 95 % confidence interval was obtained from the percentile method( Reference Royston and Altman 34 ).
Results
Participant characteristics
Of the 309 residents who consented to participate in the study, 97·7 % (n 302) were of New Zealand European ethnicity with the remaining being Maori (n 3), Pacific People (n 1), Asian (n 1) and other ethnicity (n 2). The mean age of all participants was 85 (sd 8) years (range 65–107 years old) and two-thirds of the participants surveyed were women (n 209).
The average length of aged-care residency was 31·4 months, with approximately 72 % having resided in aged-care facilities for greater than one year. Geographical location and season of blood collection were equally represented within the study population (Table 1). A high proportion of participants were classified as pre-frail (30·1 %) or frail (46·3 %). The mean BMI was 25·8 (95 % CI 25·1, 26·4) kg/m2, and half of the participants were categorized as overweight (31 %) or obese (19 %) with 14 % being underweight. One-quarter of participants were not taking the prescribed funded monthly 1250 µg (50 000 IU) vitamin D supplement. Sources of supplemental vitamin D other than the funded monthly prescription included over-the-counter multivitamin and nutrition supplements as well as a prescription bisphosphonate with added cholecalciferol (Fosamax Plus®). The vitamin D content of additional nutritional supplements ranged from 7·5 to 30 µg (300 to 1200 IU), while a weekly dose of Fosamax Plus® contained 140 µg (5600 IU) cholecalciferol. Forty participants (13 %) were regularly taking one of these additional sources of vitamin D and, of these, half were also taking the funded monthly vitamin D supplement. Fifty-seven (18·4 %) participants were not taking any form of supplemental vitamin D. More women (78·5 %) than men (68·0 %) were taking the funded vitamin D supplement (P=0·047).
Table 1 Serum 25-hydroxyvitamin D (25(OH)D) concentrations of New Zealand aged-care residents and the proportion with 25(OH)D below 50 nmol/l by demographic and health characteristics, February–September 2014
* Cholecalciferol 1250 µg (50 000 IU) once per month.
† Bisphosphonate (Fosamax Plus®) or multivitamin containing cholecalciferol.
‡ Frailty coded by the Survey of Health, Ageing and Retirement in Europe Frailty Instrument (SHARE-FI)( Reference Romero-Ortuno, Lawlor and Kenny 29 ).
§ Malnutrition by Mini Nutritional Assessment Short Form (MNA-SF) categories( 21 ).
Blood samples were provided by 292 (94·5 %) participants and there was no statistically significant differences in participant characteristics between those who provided a blood sample and those who declined phlebotomy (P>0·05).
Vitamin D status
Overall, the mean serum 25(OH)D concentration for all participants was 89·9 (95 % CI 85·2, 94·5) nmol/l (Table 1). Vitamin D insufficiency (25(OH)D <50 nmol/l) was present in almost two-thirds of residents not taking the monthly funded vitamin D supplement (49/75) compared with 1·4 % (3/217) of participants who were taking the supplement (Fig. 1). Moreover, of those taking the funded supplement, 87·1 % had serum 25(OH)D concentrations >75 nmol/l and over a fifth (21·7 %) had concentrations >125 nmol/l, including eleven (5·1 %) participants with serum 25(OH)D concentrations >150 nmol/l. Mean concentration of PTH of all participants was 58·0 (95 % CI 53·3, 62·6) pg/ml.
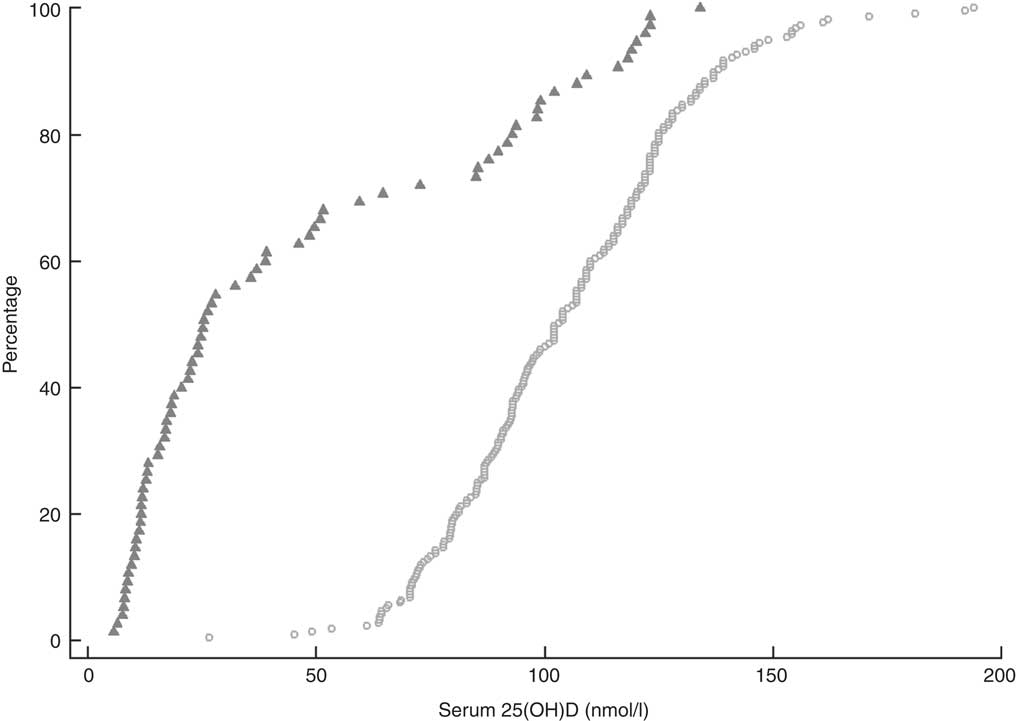
Fig. 1 Cumulative distribution of serum 25-hydroxyvitamin D (25(OH)D) concentration and cut-offs for vitamin D for 292 New Zealand aged-care residents (65–107 years), stratified by receipt of funded vitamin D supplementation (![]() , did not receive supplementation; ○, received supplementation), February–September 2014
, did not receive supplementation; ○, received supplementation), February–September 2014
Predictors of serum 25-hydroxyvitamin D concentration
Unadjusted linear regression analysis indicated that sex, duration of aged-care residency, eGFR, BMI, oral nutrition supplements, smoking status and vitamin D supplement use were associated with serum 25(OH)D (Table 2). Further examination of these factors in the multivariate analysis showed a positive association between serum 25(OH)D levels and sex, with women having an 8·9 (1·7, 16·1) nmol/l higher average serum 25(OH)D concentration than men (P=0·019). There was no statistically significant interaction between age and sex (P=0·809). Residents from North Island aged-care facilities at a lower latitude (36·5–41·2°S) had statistically significantly higher serum 25(OH)D levels than those from the South Island (latitude 43·3–46·2°S; P=0·002). There was also a statistically significant positive association with the inflammatory marker AGP, with mean serum 25(OH)D levels increasing by 13·1 (95 % CI 5·5, 20·7) nmol/l for each one unit (g/l) rise in AGP (P=0·002).
Table 2 Linear regression model of factors associated with serum 25-hydroxyvitamin D (nmol/l) among New Zealand aged-care residents, February–September 2014

eGFR, estimated glomerular filtration rate; AGP, α1-acid glycoprotein.
* Continuous variables presented as variable (unit); categorical variables presented as variable (yes/no); ordinal variables presented with the following reference categories: BMI, normal weight (20–24·99 kg/m2); malnutrition, normal nutrition status; frailty, not frail.
† n 271, one resident taking calcitriol was excluded from final model; adjusted for variables with P≤0·20 or decided a priori (geographical location, age, season of blood collection, time in residential aged-care, inflammatory markers, BMI categories).
‡ R 2 of the adjusted model =0·6918; constant =40·1 (95 % CI 0·0, 80·1); P=0·050.
§ Malnutrition by Mini Nutritional Assessment Short Form (MNA-SF) categories( 21 ).
|| Frailty coded by the Survey of Health, Ageing and Retirement in Europe Frailty Instrument (SHARE-FI)( Reference Romero-Ortuno, Lawlor and Kenny 29 ).
¶ Cholecalciferol 1250 µg (50 000 IU) once per month.
While there was a significant positive association with duration of aged-care residency (P=0·011) and a significant negative association with renal function (P=0·001), the overall effect on serum 25(OH)D levels of these factors was not clinically meaningful (0·2; 95 % CI 0·0, 0·3 nmol/l for each month of residency and −0·3; 95 % CI −0·4, −0·1 nmol/l for every unit of eGFR).
Most importantly, supplemental vitamin D intake was strongly positively associated with serum 25(OH)D levels, with consumers of both the government-funded supplement and alternative vitamin D preparations having mean serum 25(OH)D concentrations on average 71·8 nmol/l and 70·2 nmol/l higher, respectively. There was evidence of an interaction between the funded vitamin D supplement and alternative sources of supplemental vitamin D, in that mean serum 25(OH)D concentrations were 12 nmol/l higher in those on both supplements compared with those taking only the funded supplement. The final regression model explained 69·2 % of the variance in serum 25(OH)D concentrations (Table 2).
Women with low adiposity were more likely (P<0·05) to have serum 25(OH)D concentrations above the upper safety level of 150 nmol/l (data not shown).
Dietary calcium and serum parathyroid hormone
Usual daily intakes of dietary Ca were below the EAR for all sex- and age-specific groups with the exception of men aged 60–70 years (data not shown). The risk of inadequate dietary Ca intake was most prevalent in women, particularly those aged 60–70 years (98·5 %) and in men aged 71 years or older (87·6 %).
Fractional polynomial regression, controlled for total Ca intake, showed that there was a statistically significant association between serum 25(OH)D and PTH with 12·8 % of the variation explained by the model (P<0·001; Fig. 2). Mean serum PTH was 58·0 (95 % CI 53·3, 62·6) pg/ml and serum PTH increased markedly with serum 25(OH)D concentrations >60 nmol/l. The point of maximal serum PTH suppression was 76·1 (95 % CI 3·7, 148·5) nmol/l; however, caution should be exercised when applying this estimate clinically, as the width of the confidence interval indicates a high degree of uncertainty.
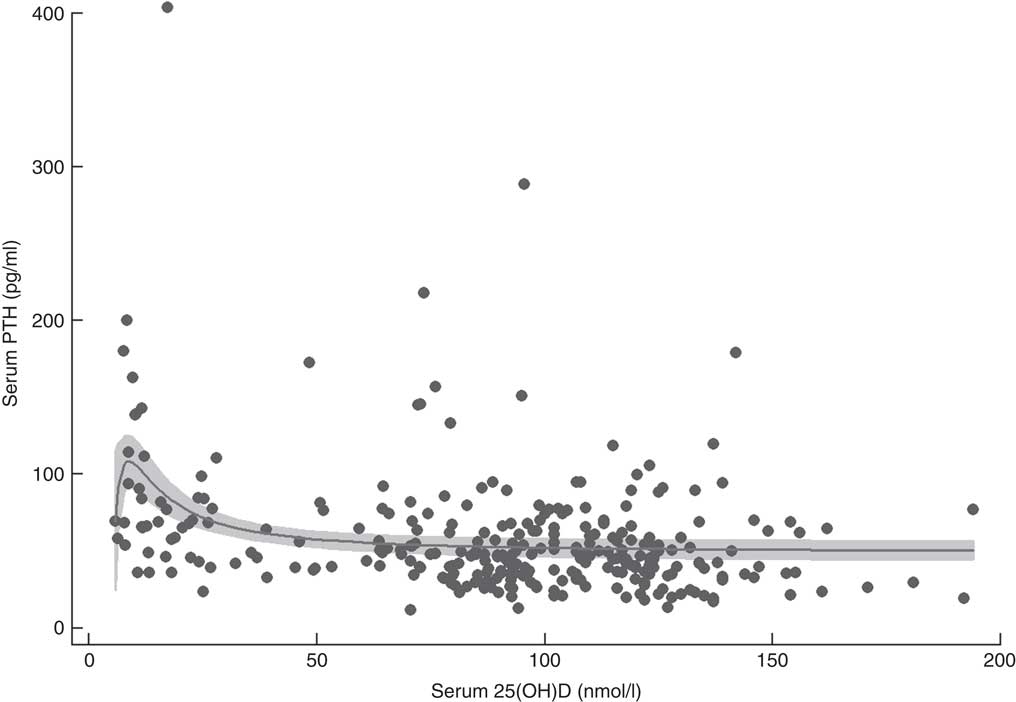
Fig. 2 Serum parathyroid hormone (PTH) v. serum 25-hydroxyvitamin D (25(OH)D) concentration in 292 New Zealand aged-care residents (65–107 years), February–September 2014. The slope of the fractional polynomial regression line controlled for dietary calcium intake is shown, with the 95 % confidence interval represented in grey
Discussion
The present study provides the first evidence of the vitamin D status of New Zealand aged-care residents since the implementation of a government-funded vitamin D supplementation programme. Overall participants had adequate vitamin D status, shown by the low prevalence of serum 25(OH)D concentrations below 50 nmol/l. This is in contrast to several other studies in the aged-care setting, where the prevalence of having 25(OH)D <50 nmol/l was in excess of 50 %( Reference Rolland, de Souto Barreto and van Kan 8 , Reference Sambrook, Cameron and Cumming 35 – Reference Grieger, Nowson and Ackland 38 ). Notably, the only participants in the present study who had 25(OH)D <50 nmol/l were those participants not taking the prescribed monthly 1250 µg (50 000 IU) cholecalciferol supplement; almost two-thirds of these participants fell below this cut-off. This observed difference between those taking supplements compared with those who did not supports previous findings that demonstrated improvements in the vitamin D status of older adults( Reference Reid, Bolland and Grey 4 , Reference Rolland, de Souto Barreto and van Kan 8 , Reference Cameron, Gillespie and Robertson 39 ), in both aged-care( Reference Wigg, Prest and Slobodian 36 , Reference Veleva, Chel and Achterberg 40 – Reference Bjorkman, Sorva and Tilvis 43 ) and community-dwelling( Reference McCarroll, Beirne and Casey 44 , Reference Glendenning, Zhu and Inderjeeth 45 ) cohorts who were receiving vitamin D supplementation.
Vitamin D is important for bone strength and muscle function and is thus a vital component in the prevention of falls and osteoporotic fractures( Reference Dawson-Hughes 6 , Reference Cameron, Gillespie and Robertson 39 ). Current recommendations for vitamin D intake in the elderly vary worldwide, ranging from 10 to 20 µg/d( 2 , 3 , 5 ). Due to the low consumption of vitamin D-rich foods and limited exposure to sunlight, vitamin D supplementation is recommended as a safe and effective means of achieving an adequate intake and improving the vitamin D status of older adults at risk of deficiency. In our cohort of New Zealand aged-care residents, supplement use, either funded or from other supplemental vitamin D sources, was the most important predictor of vitamin D status, with average serum 25(OH)D concentration being over 70 nmol/l higher than that of non-supplement users. There was also a statistically significant increase in serum 25(OH)D concentrations with increasing duration of rest-home residency indicating that, over time, monthly dosing with 1250 µg (50 000 IU) cholecalciferol appears to maintain serum 25(OH)D concentrations above the 50 nmol/l cut-off. Moreover, intermittent vitamin D dosing effectively achieves and maintains serum 25(OH)D concentrations above 50 nmol/l( Reference Wigg, Prest and Slobodian 36 , Reference Bacon, Gamble and Horne 46 ) particularly if loading doses are provided( Reference Wijnen, Salemink and Roovers 41 , Reference Bacon, Gamble and Horne 46 ), as they are in the present study.
Interestingly, concentrations of serum 25(OH)D in females remained nearly 9 nmol/l higher than in males. In similar aged-care settings sex-specific findings have been mixed, with some studies showing higher 25(OH)D levels in men( Reference Woods, Walker and Iuliano-Burns 37 , Reference Durazo-Arvizu, Dawson-Hughes and Sempos 47 ) or no difference at all between men and women( Reference Di Monaco, Castiglioni and Vallero 48 ). Contrary to research in non-supplemented populations( 2 , 22 ), we found no association between season of blood collection or obesity and serum 25(OH)D. Age-related changes in body composition suggest that current BMI cut-offs may represent adiposity in older adults differently as compared with those who are younger( Reference Villareal, Apovian and Kushner 49 ). Similar findings related to adiposity were also observed in a cohort of community-dwelling postmenopausal women where the biochemical response to vitamin D supplementation did not differ by BMI category. There was, however, an inverse relationship between vitamin D status and body fat in those taking placebo, even after sun exposure( Reference Wood, Secombes and Thies 23 ). The high level of supplement use among participants in the present study may have negated the expected roles of known predictors which have largely been established in non-supplemented populations.
Geographical location is considered an important contributor to adequate vitamin D status in free-living mobile adults( 2 , 3 ); however, decreased mobility and outdoor activity of aged-care residents may reduce the contribution of endogenous vitamin D synthesis to overall vitamin D status regardless of latitude. This is supported by a previous study of Australian aged-care residents where geographical location was not significantly associated with serum 25(OH)D( Reference Flicker, Mead and MacInnis 50 ). In contrast, we found that vitamin D status did vary with latitude, being on average 10 nmol/l higher in participants residing in the North Island of New Zealand (lower latitude). We did not measure sunlight exposure, but this association may indicate that aged-care residents in the North Island are receiving greater UVB light exposure. On average, the North Island at approximately 36·5°S receives 25 % more UV than the South Island at 45·0°S, with differences ranging from 10 % more in the summer to twice as much in the winter( Reference McKenzie, Bodeker and Keep 51 ). Therefore, where UVB sunlight is sufficient it can contribute positively to vitamin D status for older adults in aged care. A recent investigation of sun exposure as a means of improving vitamin D status in the aged-care setting observed increases in 25(OH)D levels relative to the number of sun-exposure sessions( Reference Sambrook, Cameron and Chen 52 ). The authors noted, however, that increasing sun exposure was an ineffective strategy as adherence to regular sun exposure was low (26 %) and mean 25(OH)D levels did not achieve adequacy even in participants with high adherence.
An independent positive relationship was also found between serum 25(OH)D concentration and AGP, an acute-phase protein used to monitor the later stages of inflammation. Previous research has shown varied associations between vitamin D and inflammation( Reference De Vita, Lauretani and Bauer 10 , Reference Mellenthin, Wallaschofski and Grotevendt 53 ), but elevated serum AGP has been shown to be a strong positive correlate of serum 25(OH)D in tuberculosis patients( Reference Friis, Range and Changalucha 54 ). Friis and colleagues proposed that elevated serum AGP may reflect long-lasting disease which potentially leads to loss of fat mass and release of vitamin D from fat tissue. Vitamin D is known to be sequestered in fat tissue and numerous studies have reported clinically meaningful increases in serum 25(OH)D following even modest weight loss( 2 , Reference Mason, Xiao and Imayama 55 ).
In contrast, we found a small inverse association between serum 25(OH)D and declining renal function, although the magnitude of the association was small and had minimal clinical significance. This finding is similar to that of Guessous et al., who found no significant difference in the prevalence of vitamin D deficiency between adults with renal impairment v. those without, nor did chronic kidney disease alter the effect of known predictors of vitamin D status( Reference Guessous, McClellan and Kleinbaum 56 ).
Overall our study shows that the uptake of the government-funded vitamin D supplementation programme was high, with three-quarters of participants receiving monthly vitamin D supplementation, whereas prior to the funded programme, the rate of vitamin D supplementation in New Zealand aged-care facilities was estimated to be 16 %( Reference Willaims 20 , 57 ). International data show that despite recommendations for older adults in aged care to receive at least 20 µg (800 IU) supplemental vitamin D daily, fewer than 35 %, and often only 5–15 % of residents, are prescribed vitamin D supplements( Reference Rolland, de Souto Barreto and van Kan 8 , Reference Woods, Walker and Iuliano-Burns 37 , Reference Grieger, Nowson and Ackland 38 , Reference Flicker, Mead and MacInnis 50 , Reference Rolland, Abellan Van Kan and Hermabessiere 58 ). In addition, even if supplements are prescribed, they do not always provide the recommended dosage of at least 20 µg (800 IU)/d( Reference Rolland, de Souto Barreto and van Kan 8 , Reference Yanamadala, Heflin and White 59 ). This discrepancy between clinical guidelines and clinical practice has been attributed to a number of barriers including complex monitoring protocols( Reference Rolland, de Souto Barreto and van Kan 8 ), perceived cost of supplementation( Reference Viveky, Toffelmire and Thorpe 60 , Reference Alamri, Kennedy and Marr 61 ), inconsistent prescribing guidelines, and limited education resources for both health professionals and patients and their families( Reference Wigg, Prest and Slobodian 36 , Reference Yanamadala, Heflin and White 59 , Reference Alamri, Kennedy and Marr 61 ). Implementation of the government-funded vitamin D programme for New Zealand aged-care residents is unique and addressed these barriers by providing support from a Specialist Advisory Group; education sessions and prescribing guidelines for pharmacists, doctors and other aged-care staff; as well as information brochures for residents and their families( 17 , Reference Willaims 20 , 62 , 63 ). Furthermore, residents and nursing staff have found intermittent dispensing of vitamin D, such as that used in this programme, to be an acceptable practice, likely because it reduces the patient burden of remembering to take daily supplements and does not notably increase nursing workload( Reference Wigg, Prest and Slobodian 36 ). Such strategies have been demonstrated to successfully improve vitamin D supplementation rates in the aged-care setting( Reference Rolland, de Souto Barreto and van Kan 8 , Reference Wigg, Prest and Slobodian 36 , Reference Yanamadala, Heflin and White 59 , Reference Alamri, Kennedy and Marr 61 ) and will have contributed to the high proportion (75·1 %) of aged-care residents in New Zealand receiving vitamin D supplements.
While the funded monthly supplement was the most frequently consumed form of supplemental vitamin D, there was a small proportion of participants who were concurrently receiving other vitamin D supplements despite prescribing criteria for the government-funded programme excluding residents concurrently taking other vitamin D preparations( 17 ). The small interaction effect (11·8 nmol/l) between funded and other sources of supplemental vitamin D indicates there was little added benefit of ‘double-dipping’ with vitamin D supplements. Multiple dosing of dietary supplements not only increases health-care costs, but may also contribute to the adverse effects of polypharmacy that are often observed in the aged-care setting, including increased medication burden and a negative impact on medication and supplement compliance( Reference Viveky, Toffelmire and Thorpe 60 , Reference Maher, Hanlon and Hajjar 64 ). In addition, cumulative dosing of vitamin D is of concern as the highest daily oral intake of vitamin D that will pose no risk of adverse effects for most healthy adults has not been established. A growing body of research over the past decade has raised concerns about potential adverse effects associated with serum 25(OH)D levels above 125 nmol/l. In 2010, the Institute of Medicine cautioned that serum 25(OH)D levels above approximately 125–150 nmol/l should be avoided. This is because the risk of all-cause mortality, CVD, some cancers and falls and fractures may be increased at even lower serum levels (75–120 nmol/l) in the elderly( 2 ). More than 20 % of participants in the present study had serum 25(OH)D levels greater than 125 nmol/l. Therefore, despite there being no recommendation to monitor the vitamin D status of individuals receiving vitamin D supplementation( 17 ), it may be prudent to instigate such a strategy to ensure known beneficial levels are maintained but not exceeded. Women with low body weight were at risk of serum 25(OH)D levels above 150 nmol/l and this group in particular may warrant further investigation of the effects of long-term vitamin D supplementation.
The results of the present study illustrate that monthly dosing of vitamin D effectively achieves adequate vitamin D status; however, there are differing recommendations regarding the optimal dose and frequency of vitamin D supplementation in older adults. The elevated serum 25(OH)D levels (>125 nmol/l) observed in our participants are not dissimilar to those observed in a study of Australian community-dwelling older adults where an annual dose of 12500 µg (500 000 IU) vitamin D resulted in negative skeletal outcomes( Reference Sanders, Stuart and Williamson 65 ). Consequently, smaller, more frequent vitamin D doses have been advocated( Reference Hollis and Wagner 66 ) with some researchers advocating daily dosing on the basis of achieving adequate 25(OH)D status and stable levels of circulating vitamin D( Reference Hollis and Wagner 66 ). To be effective, vitamin supplementation must be complied with. Further study of adherence to frequent dosing in this setting is warranted.
Adequate Ca intake is recommended in combination with vitamin D supplementation to ensure optimal bone health and to minimise the risk of fracture( Reference Bouillon, Schoor and Gielen 7 , 14 ). Inadequate Ca intake and vitamin D insufficiency both result in secondary hyperparathyroidism( Reference Bjorkman, Sorva and Tilvis 43 , Reference Pfeiffer, Sternberg and Schleicher 67 , Reference Deplas, Debiais and Alcalay 68 ); at low serum 25(OH)D concentrations, serum PTH levels are elevated, resulting in poor Ca absorption and increased bone turnover. The point at which maximal suppression of PTH occurs has been proposed as a clinically significant marker of optimal serum 25(OH)D levels, although it should be noted that it is not a hard end point for the determination of optimal status. In this cohort of older adults, PTH began to decrease as serum 25(OH)D concentrations rose above 60 nmol/l, with maximal suppression occurring at approximately 75 nmol/l. While there is consensus that vitamin D supplementation is effective at moderating PTH levels in the elderly, there appears to be a range of values at which maximal suppression occurs( 2 , Reference Durazo-Arvizu, Dawson-Hughes and Sempos 47 ), particularly where serum 25(OH)D concentrations are low prior to supplementation( Reference Bouillon, Schoor and Gielen 7 , Reference Gallagher, Yalamanchili and Smith 69 – Reference Seamans and Cashman 71 ). In the present study, caution should be exercised as the width of the confidence interval (95 % CI 3·7, 148·5 nmol/l) indicates a high degree of uncertainty. PTH levels in the elderly can also be affected by renal function and other metabolic pathways in addition to vitamin D and Ca levels.
Funded vitamin D supplementation was implemented in New Zealand as part of a wider falls prevention programme; however, to our knowledge, there has been no evaluation of the functional and health outcomes related to the universal programme. In the present study, we did not collect information regarding the incidence of falls or fractures and thus cannot determine the impact of the supplementation programme on skeletal outcomes. Numerous systematic reviews and meta-analyses conclude that improved vitamin D status in aged-care residents, who are at increased risk of vitamin D deficiency, can reduce the incidence of falls and their serious consequences( Reference Reid, Bolland and Grey 4 , Reference Dawson-Hughes 6 , 14 , 16 , Reference Cameron, Gillespie and Robertson 39 ). Evidence is emerging that this may be in contrast to community-dwelling older adults. A recent trial sequential meta-analysis found little benefit of vitamin D supplementation for reducing falls in community-dwelling older adults but did find a risk reduction of 16 % in institutionalised older adults when vitamin D was taken in combination with Ca( Reference Bolland, Grey and Gamble 15 ). Possible reasons for the differences between community and institutional settings could be the small number (two) of studies included in the meta-analysis or the high supplement compliance observed in residential care secondary to the dispensing role of nursing staff.
Our study shows that aged-care residents are unlikely to achieve adequate status without supplementation. The very low cost (less than $NZ 5/person per year( 72 ) of vitamin D supplementation, as well as the increasing evidence of cognitive, neurological and immunological roles for adequate vitamin D status in ageing adults( Reference Pabst, Zimmermann and Huth 9 , Reference Balion, Griffith and Strifler 11 – Reference Annweiler, Dursun and Féron 13 ) warrant further examination if the health impact and cost effectiveness of this publicly funded supplementation programme are to be determined.
Several limitations of the present study are acknowledged. Consent to access demographic and health characteristics of residents who declined to participate was not provided and we were therefore unable to determine if there were differences between residents who participated and those who did not. Moreover, participants were at the lower level of care provided by New Zealand aged-care facilities and we did not include fully dependent residents, nor those in dementia care units.
Our results, however, are likely to be applicable to all New Zealand aged-care residents for a number of reasons. First, there was a high degree of frailty in the study population, which is present across the spectrum of aged-care residents. Second, implementation of the funded vitamin D programme has occurred at all levels of aged care( 19 , Reference Willaims 20 ) and, lastly, intermittent vitamin D supplementation has been shown to improve vitamin D status in aged-care residents with a range of dependency levels( Reference Wigg, Prest and Slobodian 36 , Reference Chel, Wijnhoven and Smit 42 , Reference Yanamadala, Heflin and White 59 ). Furthermore, multiple aged-care facilities from diverse geographical and municipal locations were included in the study, making the results representative of a breadth of New Zealand aged-care settings.
Conclusion
In summary, with very few vitamin D-fortified foods available in New Zealand( 32 ) and limited sunlight exposure in aged-care residents, vitamin D supplementation is an important and pragmatic means of optimising vitamin D status in this institutional setting. Our results clearly demonstrate that a government-funded monthly supplementation programme of 1250 µg (50 000 IU) cholecalciferol achieves adequate vitamin D status which is markedly better than in similar aged-care population groups where there is an absence of universal supplementation. Nevertheless, the need to monitor recipients of long-term supplementation should be considered, due to the high proportion of supplemented residents in the present study who had elevated serum 25(OH)D levels. Moreover, given the predicted increase in the number of aged-care residents( 73 ), further work is needed to assess the costs and health effects of monthly vitamin D supplementation to ensure the programme is achieving the aims of reducing falls and fractures in aged-care residents.
Acknowledgements
Acknowledgements: The authors would like to thank Master of Dietetics students Kimberley Browning, Teresa Crowe, Mel Greacen, Daniel Greenwood, Arna McLeod, Katie McVerry, Anna Small and Bao Yin Sow (Department of Human Nutrition, University of Otago), for participant recruitment and data collection; Andrew Gray for statistical support and advice. Financial support: This work was supported by Lottery Health New Zealand and The Maurice and Phyllis Paykel Trust, New Zealand. The funders had no role in the design, analysis or writing of this article. Conflict of interest: The authors declare no conflicts of interest. Authorship: All authors developed the concept of this study. S.O.M. and J.C.M. wrote the study protocols, trained the research assistants and supervised collection of data for the study. M.J.H. and S.O.M. carried out the biochemical analysis and S.O.M. analysed the anthropometric, health and sociodemographic data. The initial draft of the manuscript was written by S.O.M. and thoroughly revised by all authors. Ethics of human subject participation: This study was conducted according to the guidelines laid down in the Declaration of Helsinki and all procedures involving human residents were approved by the Human Ethics Committee of University of Otago, Dunedin, New Zealand. Written informed consent was obtained from all participants or their legal representative for those with cognitive impairment.


