


I. INTRODUCTION
The functionalization/impregnation of low-dimensional carbon materials, i.e., the single-atomic layer carbons, graphene (GR), Reference Vélez, Encinas and Quintana1 and single wall carbon nanotubes (SWCNTs), Reference Hu and Dong2 has led to a surge of interest in a variety of modification techniques, such as low-cost chemical doping procedures, to tailor the electronic, structural, and chemical properties of GR and SWCNTs. Reference Robinson, Hollander, LaBella, Trumbull, Cavalero and Snyder3–Reference Wang, Liu, Chen, Chou and Wang6 Several studies related to the formation of GR or SWCNT-based nanostructures using Pd or Pt as a functionalizing agent have been reported, but in these cases the time to impregnate the nanoscale carbon materials is usually 12 (Refs. Reference Wang, Liu, Chen, Chou and Wang6–Reference Zhang, Chen, Swiegers, Ma and Wallace9) to 24 h. Reference Chen, Duan, Zhang, Zhang, Guo, Nie and Liu10
Electrical polarization of the interface between two immiscible electrolyte solutions (ITIES) generates electrochemical potential gradients capable of promoting ion and electron transfer across the molecular boundary. Reference Peljo and Girault11 The potential drop on the aqueous side of the liquid/liquid boundary is spread over a region of 1–10 nm. Reference Samec12,Reference Luo, Malkova, Yoon, Schultz, Lin, Meron, Benjamin, Vanysek and Schlossman13 Under potentiostatic conditions, the flux of ions across the interface manifests itself as an electrical current. Reference Samec14 The ITIES is reported to be an ideal candidate for in situ generation and reversible assembly of diverse nanostructures, Reference Rodgers, Booth and Dryfe15 such as highly complex catalytic centers and supports, including photoactive oxides Reference Jensen, Fermin, Moser and Girault16–Reference Scanlon, Bian, Vrubel, Amstutz, Schenk, Hu, Liu and Girault18 and metallic nanostructures. Reference Dryfe, Simm and Kralj19–Reference Grunder, Ramasse and Dryfe21
The advantage of interfacial assembly of low-dimensional carbon species (GR and SWCNTs) is the ability to form macroscopic films spontaneously, from self-assembly of individual flakes and particles at liquid/liquid interfaces. Reference Salvatierra, Domingues, Oliveira and Zarbin22–Reference Tang, Zhuang and Wang25 There is a small body of work on the localization of chemical vapor deposited (CVD) GR and multilayer graphene (MLG) materials (consisting of a small number, between 2 and about 10 of well-defined, countable, stacked GR layers) Reference Bianco, Cheng, Enoki, Gogotsi, Hurt, Koratkar, Kyotani, Monthioux, Park, Tascon and Zhang26 at the polarizable organic/water interface. Reference Toth, Ramasse, Velicky and Dryfe27,Reference Toth, Rodgers, Rabiu and Dryfe28 This approach is exemplified using the electro-deposition of Pd nanoparticles (NPs) on free-standing CVD GR Reference Toth, Ramasse, Velicky and Dryfe27 or MLG and SWCNT layers. Reference Toth, Rodgers, Rabiu and Dryfe28 Furthermore, the employment of easily processable, liquid-phase exfoliated, reduced graphene oxide (rGO) materials to support deposition of noble metals at the organic/water interface has been widely investigated, mainly to prepare GR-based catalysts or electrode materials on solid substrates. Reference Robinson, Hollander, LaBella, Trumbull, Cavalero and Snyder3,Reference Wang, Liu, Chen, Chou and Wang6,Reference Salvatierra, Domingues, Oliveira and Zarbin22,Reference Biswas and Drzal24,Reference Bramhaiah and John29–Reference Zan, Fang, Wu, Xiao, Huo and Duan32 The use of CVD GR offers a macroscopic material—visible to the naked eye—that has not been deliberately oxidized and consists of a high-quality, well-defined monolayer, as opposed to liquid-phase exfoliated rGO aggregates. Reference Toth, Ramasse, Velicky and Dryfe27 Functionalization of a free-standing CVD GR monolayer with noble metal (Au, Pt, Pd) nanoparticles, using a low-cost, two-step, solution chemistry-based process has been reported previously. Both sides of the GR monolayer were decorated with metal nanoclusters, creating “bimetal graphene sandwiches”, which were adsorbed at the ITIES. Reference Toth, Velicky, Ramasse, Kepaptsoglou and Dryfe33 This type of electro-active material is of interest due to its potential exploitation as a catalyst at the ITIES. For example, the two different catalyst materials (e.g., metal NPs) could be used to enhance two different redox reactions (i.e., those occurring in the organic and aqueous phases).
Raman spectroscopy is a powerful technique for the characterization and investigation of chemical modification of GR and SWCNTs. The presence of covalent bonds, dopants and their spatial distribution can all be detected. Reference Sgobba and Guldi34,Reference Ferrari and Basko35 The Raman spectrum of a single-layer GR sheet has two characteristic features (G and 2D bands); the G peak is associated with the E 2g vibrational mode of the sp 2 bonds and the 2D band is caused by the scattering of two phonons and, although independent of defects, it is instead affected by strain. Reference Ferrari, Meyer, Scardaci, Casiraghi, Lazzeri, Mauri, Piscanec, Jiang, Novoselov, Roth and Geim36–Reference Frank, Tsoukleri, Parthenios, Papagelis, Riaz, Jalil, Novoselov and Galiotis40 Both n- and p-type doping of monolayer GR cause a blueshift (frequency increase) in the G band, Reference Das, Chakraborty, Piscanec, Pisana, Sood and Ferrari41 while the 2D band frequency of monolayer GR increases for p-type doping but decreases for n-type doping. This behavior can be observed in electrochemically gated GR Reference Kalbac, Farhat, Kong, Janda, Kavan and Dresselhaus37 and, by comparison of the relative position and intensity of the G and 2D bands, it is relatively easy to determine the degree of doping. Reference Bissett, Tsuji and Ago42–Reference Bissett, Konabe, Okada, Tsuji and Ago44 This technique is also frequently used to investigate either the state of SWCNTs or their composites with metal nanoparticles. Reference Kavan, Rapta and Dunsch45–Reference Fernandez-Blanco, Ibanez, Colina, Ruiz and Heras48 The most significant Raman bands of SWCNTs are the radial breathing mode (RBM), the tangential displacement mode, which is also known as the G band, the disorder induced mode, which shows the density of the defects (D), and the high-frequency two-phonon mode (2D or G′). Reference Jorio, Saito, Hafner, Lieber, Hunter, McClure, Dresselhaus and Dresselhaus49
In this contribution, we report a self-assembly process to achieve MLG and SWCNT films at the liquid/liquid interface. Metal NP deposition on the interfacial assembly of carbon nanostructures is carried out from the aqueous phase, using a ferrocene-derivative as the reducing agent located in the organic phase. This impregnation/functionalization method is an alternative route to synthesize Pt or Pd coated GR or SWCNT composite materials at the ITIES within a short (maximum 3 h) preparation time.
II. EXPERIMENTAL SECTION
A. Materials
Lithium perchlorate (LiClO4, ≥99.5%); tetrabutylammonium perchlorate (TBAClO4, ≥99.0%); ammonium tetrachloropalladate (II) [(NH4)2PdCl4, 99.995%]; ammonium tetrachloroplatinate (II) [(NH4)2PtCl4, 99%]; decamethylferrocene or bis(pentamethylcyclopentadienyl) iron (II) (Me10FeCp2, DecMFc, 97%) and 1,2-dichloroethane (DCE, ≥99.8%), which is used as the organic phase, were purchased from Sigma–Aldrich. SWCNTs (Elicarb®, Thomas Swan & Co. Ltd.) and graphite powder (Branwell Graphite Ltd.) were used to give a suspension in DCE. Deionized water (18.2 MΩ cm resistivity) purified using a “PURELAB” Ultrafiltration unit (Elga Process Water) was used for aqueous solution preparation. Glassware was cleaned in Piranha solution, a 1:4 mixture (by volume) of 30% hydrogen peroxide (H2O2, Fisher Scientific) and concentrated sulfuric acid (H2SO4, Fisher Scientific)—CAUTION required when handling—then boiled in ultrapure water and dried.
B. Carbon nanomaterials assembly
The SWCNT and GR flake assembly at the organic/water interface are described elsewhere. Reference Toth, Rodgers, Rabiu and Dryfe28 Briefly, sonication for 30 min (Clifton Ultrasonic Bath, Nickel Electro Ltd. operating at 30–40 kHz, at 30% of its full power) was used to prepare the SWCNT dispersion in organic solvent, to exfoliate the MLG materials (consisting of micrometer and submicrometer size flakes) from natural graphite powder, and to give a carbon suspension in DCE. Then, an aliquot of dispersion with the organic electrolyte solution in DCE was placed in contact with an equal volume of aqueous phase, and then self-assembly of the SWCNT or MLG at the interface was achieved using sonication (15 min). UV–Vis spectroscopy was used to measure the concentration of the SWCNT and MLG dispersions, these measurements were carried out using a UV–Vis absorption spectrometer (DH-2000-BAL, Ocean Optics, Duiven, Netherlands) and USB2000 interface (Micropack GmbH, Ostfildern, Germany).
C. Methods
Characterization of samples was performed following deposition. The metal NP-decorated SWCNT and MLG layers were fished out using either a Si/SiO2 substrate or specifically prepared free-standing samples supported on holey carbon-coated nickel quantifoil grids (TAAB Laboratories Equipment Ltd.), dried in air for 15 min, then washed in an ethanol and isopropanol mixture (5 min) and then acetone (5 min), and finally blow-dried with nitrogen. Raman analysis was carried out using a Renishaw RM 264N94 (532 nm) spectrometer, operating at power ≤ 1 mW. Scanning electron microscopy (SEM), energy dispersive x-ray spectroscopy (EDAX) for elemental analysis (Philips XL30 ESEM-FEG, Eindhoven, Netherlands, operated at 15.0 kV) and atomic force microscopy (AFM, Bruker MultiMode 8, operated in “Peak Force” tapping mode with a silicon tip on a silicon nitride lever) were also used to analyze samples. Further characterization was carried out using a FEI Titan G2 (S)TEM (Eindhoven, Netherlands) with an aberration corrected probe operated in high resolution transmission electron microscope (HR-TEM) mode at 80 kV with a spherical aberration of 1.3 mm and a probe current of ∼1 nA. Selected area electron diffraction patterns were acquired using a selected area aperture of ∼200 nm diameter and a camera length of 550 mm. The displayed errors are either standard deviations (arithmetic averages of multiple measured values) or absolute errors determined from best fit errors.
III. RESULTS AND DISCUSSION
Absorption spectra of SWCNT dispersions at various dilutions are depicted in Fig. 1(a). The absorbance values at 660 nm from three measurements were averaged and plotted versus the concentration of the SWCNT dispersions [Fig. 1(b)]. The absorption coefficient, α, calculated from the slope of the calibration curve, according to the Lambert–Beer law, was found to be 4100 ± 41 mL mg−1 m−1. Reference Toth, Rodgers, Rabiu and Dryfe28 The concentration of all freshly prepared dispersions was determined using UV–Vis spectroscopy and the dispersions were stable for up to two weeks.

FIG. 1. (a) UV–Vis spectra of SWCNT dispersions at different concentrations and the solution after filtration of the SWCNTs, (b) the calibration curve of the measured absorbance versus the concentration of SWCNT.
Functionalization of the interfacially assembled SWCNT or MLG layer was achieved by a simple spontaneous redox reaction between decamethylferrocene (DecMFc), which acts as an organic phase electron donor, and tetrachloropalladate ( ${\rm{PdCl}}_4^{2 - }$
) in the aqueous phase (Reaction 1). 0.1 M TBAClO4 and 0.1 M LiClO4 were used as the organic (o) and aqueous (w) phase supporting electrolytes, respectively. This metal deposition reaction proceeds spontaneously at the ITIES, but in the presence of a CVD GR monolayer, it was found to occur preferentially on the GR.
Reference Toth, Ramasse, Velicky and Dryfe27,Reference Toth, Velicky, Ramasse, Kepaptsoglou and Dryfe33
${\rm{PdCl}}_4^{2 - }$
) in the aqueous phase (Reaction 1). 0.1 M TBAClO4 and 0.1 M LiClO4 were used as the organic (o) and aqueous (w) phase supporting electrolytes, respectively. This metal deposition reaction proceeds spontaneously at the ITIES, but in the presence of a CVD GR monolayer, it was found to occur preferentially on the GR.
Reference Toth, Ramasse, Velicky and Dryfe27,Reference Toth, Velicky, Ramasse, Kepaptsoglou and Dryfe33
 $${\rm{PdCl}}{_4^{2 - }_{\left( {{\rm{aq}}} \right)}} + 2\,{\rm{DecMF}}{{\rm{c}}_{\left( {\rm{o}} \right)}} \to {\rm{P}}{{\rm{d}}_{\left( {\rm{s}} \right)}} + 4\,{\rm{C}}{{\rm{l}}^ - }_{\left( {{\rm{aq}}} \right)} + 2\,{\rm{DecMFc}}_{\left( {\rm{o}} \right)}^ + \quad .$$
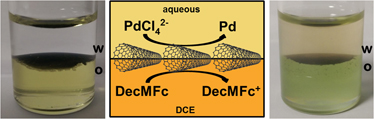
A schematic of the redox process and photographs of the Pd decorated SWCNT film (hereafter, Pd-SWCNT) at the interface are shown in Fig. 2. The SWCNT layers were assembled at the ITIES by mixing an aliquot of dispersion with an equal volume of DCE organic electrolyte (0.1 M TBAClO4) solution containing 2 mM DecMFc, followed by addition of an equal volume of aqueous phase (0.1 M LiClO4) on top of the organic phase [Fig. 2(a)]. The cell was bath sonicated for 15 min to bring about assembly of the SWCNTs at the ITIES, which occurred after standing for approximately 2 h postsonication [Fig. 2(d)]. The aqueous phase (upper) was then replaced by an aqueous phase containing ${\rm{PdCl}}_4^{2 - }$
[Fig. 2(b)] and the reduction of the
${\rm{PdCl}}_4^{2 - }$
[Fig. 2(b)] and the reduction of the ${\rm{PdCl}}_4^{2 - }$
by DecMFc occurred through the SWCNT film at the ITIES. This led to the formation of Pd NPs, which appeared as gray dots presented [Figs. 2(c) and 2(e) for illustration and photograph, respectively]. The color change of the DecMFc from yellow [Fig. 2(d)] to green [Fig. 2(e)] is evidence of the oxidation of DecMFc to the DecMFc+ cation, which accompanies the redox reaction between
${\rm{PdCl}}_4^{2 - }$
by DecMFc occurred through the SWCNT film at the ITIES. This led to the formation of Pd NPs, which appeared as gray dots presented [Figs. 2(c) and 2(e) for illustration and photograph, respectively]. The color change of the DecMFc from yellow [Fig. 2(d)] to green [Fig. 2(e)] is evidence of the oxidation of DecMFc to the DecMFc+ cation, which accompanies the redox reaction between ${\rm{PdCl}}_4^{2 - }$
and DecMFc (Reaction 1).
${\rm{PdCl}}_4^{2 - }$
and DecMFc (Reaction 1).

FIG. 2. (a, b) Schematics of SWCNT layer assembly at the ITIES, (b) ${\rm{PdCl}}_4^{2 - }$
reduction by DecMFc through the interfacially located SWCNTs and (c) the formation of Pd NPs, marked as light gray dots. (d) Photographs of the assembled SWCNT layer and (e) the Pd-SWCNT layer at the ITIES after 15 min of reaction.
${\rm{PdCl}}_4^{2 - }$
reduction by DecMFc through the interfacially located SWCNTs and (c) the formation of Pd NPs, marked as light gray dots. (d) Photographs of the assembled SWCNT layer and (e) the Pd-SWCNT layer at the ITIES after 15 min of reaction.
The resultant SEM and TEM micrographs of Pd-SWCNT are given in Fig. 3. The small, globular shaped, Pd NPs appear to deposit uniformly on and around the SWCNT bundles [Figs. 3(a)–3(c)], with the size of the Pd NPs ranging from 5–10 nm. The series of SEM images illustrate the increase in the number of deposited Pd NPs as a function of the interfacial deposition contact time from 1 min (a), to 5 min (b), to 15 min (c). The TEM images (d) confirm the existence of small Pd-NPs in the range of 1–2 nm (black dots) both individually all around the SWCNTs and as aggregated clusters of nanoparticles (visible as dark patches in the TEM images).

FIG. 3. (a–c) SEM and (d) TEM images of the Pd decorated SWCNTs after 1 min (a, d), 5 min (b), and 15 min (c) interfacial contact time of deposition. A higher magnification image is shown inset in d (scale bar corresponds to 20 nm). The samples were transferred to (a–c) a Si/SiO2 wafer and (d) a quantifoil grid for imaging.
The same calibration process was repeated to determine α for the meta-stable MLG dispersions in DCE, which was found to be 2305 ± 24 mL mg−1 m−1.
Reference Toth, Rodgers, Rabiu and Dryfe28
Then, the same interfacial assembly was repeated for MLG dispersions, forming layers of exfoliated GR flakes at the ITIES. An analogous redox process can be applied to reduce tetrachloroplatinate, ${\rm{PtCl}}_4^{2 - }$
, from the aqueous phase at ITIES-assembled nanoscale carbonaceous materials. Comparison of the pristine and Pt NP coated flakes of MLG materials (hereafter, Pt-MLG) is presented in Fig. 4. The step height of the GR layer was approximately 1 nm, which corresponds to a monolayer, in reasonable agreement with the known value for pristine monolayer GR determined from AFM (0.35–1 nm).
Reference Novoselov, Geim, Morozov, Jiang, Zhang, Dubonos, Grigorieva and Firsov50,Reference Zhao, Surwade, Li and Liu51
The angular shaped pristine flakes of MLG (2–10 nm thickness and µm2 scale) in Figs. 4(A) and 4(B) and the small, bright particles [Figs. 4(C) and 4(D)] show the deposited Pt NPs on MLG. All around the flakes of the MLG, the size of the Pt NPs detectable in these images lies between 10 and 20 nm. Raman spectra (532 nm laser) of the pristine (a) and Pt-MLG (b–d) are presented in Fig. 4(E). The spectrum of the pure MLG (a) depicts the usual peaks of GR, i.e., D, G, 2D. By fitting the 2D band, the number of layers was calculated to be below ten,
Reference Ferrari, Meyer, Scardaci, Casiraghi, Lazzeri, Mauri, Piscanec, Jiang, Novoselov, Roth and Geim36
which is consistent with the AFM data. The defect sensitive bands of the GR Raman spectra, D′ (1589.8 cm−1) and D + D′ (2931.8 cm−1), appear to increase as a function of the deposition time [Figs. 4(E-b)–4(E-d)] indicating the increase of the NPs number on the sp
2 carbon lattice. The D′ band denotes a weak disorder-induced feature and the D + D′ band requires another defect and the combination of phonons with different momenta for activation.
Reference Iqbal, Singh, Iqbal and Eom52,Reference Malard, Pimenta, Dresselhaus and Dresselhaus53
Moreover, variation in the shape of the 2D band [Fig. 4(E-b)–4(E-d)] indicates a change in the number of layers for detected GR flakes in the case of the Pt-MLG samples. After interfacial deposition of Pt NPs, the flakes can be stuck together with the Pt nanostructures, which is visible on the SEM images after 5 min [Fig. 4(C)] deposition time. The D′ band appears as a shoulder on the G band (1579 cm−1), indeed it forms as a proper peak (1589.8 cm−1) in the spectra of Pt-MLG [Figs. 4(E-b)–4(E-d)], and the G band becomes a shoulder on the D′ band. The increasing intensity of the D peak corresponds to an increased defect density (as measured from I
D
/I
G
) in the case of the composites. The I
D
/I
G
ratio increased from 0.07 (a) to 0.37 (b) 0.46 (c) 0.88 (d) in the case of pristine GR and Pt-MLG after 1 min, 5 min, and 15 min, respectively. The increase of the defect density of MLG with the increased functionalization time, (as measured from I
D
/I
G
, and appearance the D′ band) reflects the increasing extent of MLG functionalization by the metal NPs.
Reference Toth, Velicky, Ramasse, Kepaptsoglou and Dryfe33,Reference Bissett, Konabe, Okada, Tsuji and Ago44
These NPs also cause charging interaction between the Pt NPs and GR lattice, which affects the sp
2 hybridization of the carbon atoms.
${\rm{PtCl}}_4^{2 - }$
, from the aqueous phase at ITIES-assembled nanoscale carbonaceous materials. Comparison of the pristine and Pt NP coated flakes of MLG materials (hereafter, Pt-MLG) is presented in Fig. 4. The step height of the GR layer was approximately 1 nm, which corresponds to a monolayer, in reasonable agreement with the known value for pristine monolayer GR determined from AFM (0.35–1 nm).
Reference Novoselov, Geim, Morozov, Jiang, Zhang, Dubonos, Grigorieva and Firsov50,Reference Zhao, Surwade, Li and Liu51
The angular shaped pristine flakes of MLG (2–10 nm thickness and µm2 scale) in Figs. 4(A) and 4(B) and the small, bright particles [Figs. 4(C) and 4(D)] show the deposited Pt NPs on MLG. All around the flakes of the MLG, the size of the Pt NPs detectable in these images lies between 10 and 20 nm. Raman spectra (532 nm laser) of the pristine (a) and Pt-MLG (b–d) are presented in Fig. 4(E). The spectrum of the pure MLG (a) depicts the usual peaks of GR, i.e., D, G, 2D. By fitting the 2D band, the number of layers was calculated to be below ten,
Reference Ferrari, Meyer, Scardaci, Casiraghi, Lazzeri, Mauri, Piscanec, Jiang, Novoselov, Roth and Geim36
which is consistent with the AFM data. The defect sensitive bands of the GR Raman spectra, D′ (1589.8 cm−1) and D + D′ (2931.8 cm−1), appear to increase as a function of the deposition time [Figs. 4(E-b)–4(E-d)] indicating the increase of the NPs number on the sp
2 carbon lattice. The D′ band denotes a weak disorder-induced feature and the D + D′ band requires another defect and the combination of phonons with different momenta for activation.
Reference Iqbal, Singh, Iqbal and Eom52,Reference Malard, Pimenta, Dresselhaus and Dresselhaus53
Moreover, variation in the shape of the 2D band [Fig. 4(E-b)–4(E-d)] indicates a change in the number of layers for detected GR flakes in the case of the Pt-MLG samples. After interfacial deposition of Pt NPs, the flakes can be stuck together with the Pt nanostructures, which is visible on the SEM images after 5 min [Fig. 4(C)] deposition time. The D′ band appears as a shoulder on the G band (1579 cm−1), indeed it forms as a proper peak (1589.8 cm−1) in the spectra of Pt-MLG [Figs. 4(E-b)–4(E-d)], and the G band becomes a shoulder on the D′ band. The increasing intensity of the D peak corresponds to an increased defect density (as measured from I
D
/I
G
) in the case of the composites. The I
D
/I
G
ratio increased from 0.07 (a) to 0.37 (b) 0.46 (c) 0.88 (d) in the case of pristine GR and Pt-MLG after 1 min, 5 min, and 15 min, respectively. The increase of the defect density of MLG with the increased functionalization time, (as measured from I
D
/I
G
, and appearance the D′ band) reflects the increasing extent of MLG functionalization by the metal NPs.
Reference Toth, Velicky, Ramasse, Kepaptsoglou and Dryfe33,Reference Bissett, Konabe, Okada, Tsuji and Ago44
These NPs also cause charging interaction between the Pt NPs and GR lattice, which affects the sp
2 hybridization of the carbon atoms.

FIG. 4. (A, C) SEM and (B, D) AFM images of pure (A, B) and Pt NP decorated MLG (C, D), the latter recorded after 5 min of deposition. Representative Raman spectra (532 nm excitation laser) of pure GR (E-a), pure SWCNT (F-a) and Pt-MLG (E-b–d) and, Pd-SWCNT (F-b–d) nanocomposites, respectively, after 1 min (b), 5 min (c) and 15 min (d) interfacial contact time. The samples were transferred to a Si/SiO2 wafer for this analysis (the asterisk marked peaks at 520 cm−1 correspond to silicon).
The Pd-SWCNT composites were also measured by Raman spectroscopy, used to study the defects and the extent of functionalization on the surface of the SWCNTs before and after Pd NPs deposition [Fig. 4(F)]. Figures 4(F-a) and 4(F-b–F-d), respectively, show the RBM, the two main components of the G band (G − and G +), and the 2D band in Raman spectra of pure SWCNT and Pd-SWCNT composites. The peaks at about 1594 cm−1 (G + band) and at 1342 cm−1 (D band) correspond to the sp 3- and sp 2-hybridized carbons present, identifying graphitic disorder and the ordered state on the SWCNT surface, respectively. The intensity of the D band describes the degree of disorder present along the tube, indicating the extent of the modification. Reference Zhang, Chen, Swiegers, Ma and Wallace9 Thus, the I D /I G ratio increased from 0.10 (a) to 0.48 (b) 0.56 (c) 0.82 (d) in the case of pristine SWCNT and Pd-SWCNT after 1, 5, and 15 min, respectively. So, the charging/doping interaction was observed in cases of both MLG and SWCNTs materials-based metal nanocomposites. ${\rm{PdCl}}_4^{2 - }$
reduction can also be exploited for metal deposition on the MLG layers, allowing the preparation of Pd NP decorated MLG-metal nanoclusters (hereafter, Pd-MLG). The deposited metal particles show up as bright and globular structures on the angular shaped GR surfaces [Figs. 5(a)–5(c)]. Increasing the interfacial deposition contact time increases the number of NPs and the size of the formed nanostructures, mainly from small individual NPs bigger e.g., “snow flake” like structures can be built up [Fig. 5(b)] and these structures subsequently aggregate together with the flakes of the MLG material, forming nanoclusters [Fig. 5(c)]. The high resolution TEM image depicts the MLG consisting of angular shape flakes [Fig. 5(d)] with folded flake regions demonstrating typically thicknesses of 3–10 layers.
Reference Peter, Thomas, Sarah, Fredrik, Despoina, Quentin and Rik54
The high level of metal NPs coverage is clearly observable consisting of small (1–2 nm in size) individual and larger (5–10 nm in size) Pd NPs and nanostructures covering the whole surface of the flake. The electron diffraction pattern image [inset in Fig. 5(d)] demonstrates the expected lattice reflections present from MLG and crystalline Pd. The images correspond to deposition times of 1 min (a), 5 min (b), and 15 min (c, d). The location of the deposited metal NPs suggests that the electron transfer process, involving the interfacially assembled SWCNT or MLG films, proceeds via the low dimensional carbons.
${\rm{PdCl}}_4^{2 - }$
reduction can also be exploited for metal deposition on the MLG layers, allowing the preparation of Pd NP decorated MLG-metal nanoclusters (hereafter, Pd-MLG). The deposited metal particles show up as bright and globular structures on the angular shaped GR surfaces [Figs. 5(a)–5(c)]. Increasing the interfacial deposition contact time increases the number of NPs and the size of the formed nanostructures, mainly from small individual NPs bigger e.g., “snow flake” like structures can be built up [Fig. 5(b)] and these structures subsequently aggregate together with the flakes of the MLG material, forming nanoclusters [Fig. 5(c)]. The high resolution TEM image depicts the MLG consisting of angular shape flakes [Fig. 5(d)] with folded flake regions demonstrating typically thicknesses of 3–10 layers.
Reference Peter, Thomas, Sarah, Fredrik, Despoina, Quentin and Rik54
The high level of metal NPs coverage is clearly observable consisting of small (1–2 nm in size) individual and larger (5–10 nm in size) Pd NPs and nanostructures covering the whole surface of the flake. The electron diffraction pattern image [inset in Fig. 5(d)] demonstrates the expected lattice reflections present from MLG and crystalline Pd. The images correspond to deposition times of 1 min (a), 5 min (b), and 15 min (c, d). The location of the deposited metal NPs suggests that the electron transfer process, involving the interfacially assembled SWCNT or MLG films, proceeds via the low dimensional carbons.

FIG. 5. (a–c) SEM and (d) HR-TEM images of Pd decorated exfoliated MLG after 1 min (a), 5 min (b), and 15 min (c, d) interfacial deposition contact time. The electron diffraction pattern image of Pd-MLG is depicted in the upper inset of (d) with the rings corresponding to the expected lattice spacings of MLG (green) and crystalline Pd (red). The lower inset shows a higher magnification image of the smaller Pd NPs (scale bar corresponds to 5 nm). The samples were transferred to a Si/SiO2 wafer (a–c) and a quantifoil grid (d) for imaging.
Increasing the deposition time in both Pd and Pt cases (1, 5, and 15 min) caused an increase in the number of NPs and nucleation began to form larger NP structures, resulting in full coverage all around the SWCNT bundles [Figs. 3(a)–3(c)], the flakes of MLG [Figs. 5(a)–5(c)] and connected nanoclusters. Firstly, the small (1–2 nm) individual NPs are formed both on SWCNTs or MLG [Figs. 3(d) and 5(d)]. Then, on increasing the deposition time, either bigger (5–10 nm) NPs or aggregates of NPs and low-dimensional carbon materials are formed. This effect can primarily be seen in the case of Pd-SWCNT and Pd-MLG after a 15 min deposition time [Figs. 3(c) and 5(c), respectively]. The Pt coated flakes of MLG also stuck together, forming larger structures [Fig. 4(C)].
The metal content was characterized, using EDAX, via the relative metal ratio (Pd/C and Pt/C) calculated from the at.% values, as a function of the contact time, as presented in Fig. 6. In both cases, the amount of the Pd NPs [Fig. 6(a)] or Pt NPs [Fig. 6(b)] increased with a higher interfacial deposition time. At each deposition time, there was a difference in the metal/carbon ratios between the different nanocarbon materials, i.e., there is a higher Pd content for MLG compared to SWCNTs and a lower content of Pt in MLG compared to the SWCNTs. When using the same electron donor (DecMFc), the thermodynamics of metal deposition on the SWCNT, or GR layer are controlled solely by the reduction potentials of the metal species. These are +0.591 V and +0.755 V versus the standard hydrogen electrode, for the ${\rm{PdCl}}_4^{2 - }$
/Pd and
${\rm{PdCl}}_4^{2 - }$
/Pd and ${\rm{PtCl}}_4^{2 - }$
/Pt couples, respectively.
Reference Bratsch55,Reference Bard, Parsons and Jordan56
Pt deposition at unmodified ITIES has been seen to be slower than Pd deposition, in spite of the higher driving force for Pt deposition.
Reference Platt, Dryfe and Roberts57
The results presented here (Fig. 6) are consistent with the kinetic product, i.e., more rapid Pd deposition being seen in the presence of MLG [Fig. 6(a)], whereas the thermodynamic product, enhanced Pt deposition is seen with SWCNTs [Fig. 6(b)]. This observation is consistent with a higher defect density on the carbon nanotubes which facilities the more kinetically hindered nucleation of Pt. The method presented here could be an alternative route to decorate/impregnate low-dimensional carbon materials, either SWCNTs or GR particles, by noble metal NPs for the preparation of nanocomposite materials.
${\rm{PtCl}}_4^{2 - }$
/Pt couples, respectively.
Reference Bratsch55,Reference Bard, Parsons and Jordan56
Pt deposition at unmodified ITIES has been seen to be slower than Pd deposition, in spite of the higher driving force for Pt deposition.
Reference Platt, Dryfe and Roberts57
The results presented here (Fig. 6) are consistent with the kinetic product, i.e., more rapid Pd deposition being seen in the presence of MLG [Fig. 6(a)], whereas the thermodynamic product, enhanced Pt deposition is seen with SWCNTs [Fig. 6(b)]. This observation is consistent with a higher defect density on the carbon nanotubes which facilities the more kinetically hindered nucleation of Pt. The method presented here could be an alternative route to decorate/impregnate low-dimensional carbon materials, either SWCNTs or GR particles, by noble metal NPs for the preparation of nanocomposite materials.

FIG. 6. The relative metal concentrations (metal/carbon) of (a) Pd and (b) Pt NP decorated GR and SWCNTs, as a function of deposition contact time. The error bars are standard deviations (arithmetic averages of multiple measured values).
IV. CONCLUSIONS
A simple galvanic displacement process was applied to prepare SWCNT and MLG-based noble metal nanocomposites at the ITIES. EDAX elemental analysis and Raman spectroscopy were used to prove the formation of low dimensional carbon-based metal nanoclusters; electron microscopy and AFM gave evidence of the morphological properties of the composites.
Increasing the interfacial contact time of the palladium or platinum deposition, led to an increased noble metal concentration in the nanocomposites. Furthermore, the amount of the different metals varied between the two different carbon nanomaterials, due to the size distributions of the metal NPs. An increase in the I D /I G ratio of the metal NP-coated either flakes of the MLG material or SWCNTs, determined from Raman spectroscopy, indicating a higher level of functionalization with a higher amount of metal coating compared to the pristine GR.
This impregnation method using the ITIES represents an alternative way to prepare low-dimensional carbonaceous material-based metal nanocomposites.
ACKNOWLEDGMENTS
The authors thank the U.K. EPSRC (grants EP/K007033/1, EP/K039547/1, EP/G035954/1, and EP/J021172/1) for financial support. A.K.R. thanks the Educational Trust Fund (Nigeria) for a PhD scholarship. S.J.H. thanks the Defense Threat Reduction Agency Grant HDTRA1-12-1-0013.


 Open access