Introduction
Climate change, the realisation that fossil fuels constitute a finite energy source and the political aftershocks following the nuclear disasters in Chernobyl and Fukushima have nurtured a political and economic environment in many countries in which renewable energy development can flourish. In addition, governments increasingly realise that the diversification of energy sources is in the interest of both economic growth and national security. It is therefore unsurprising that renewable energy has grown strongly around the world. At the same time, it has become clear that a predictable investment environment for renewable energy is crucial to maintain its current growth rates. As renewable energy still needs government support to compete against heavily subsidised fossil fuels and nuclear power, policy uncertainty puts a major break on renewable energy development (International Energy Agency 2013).
In the United States (U.S.), policymakers and pundits have called on the government to enact more aggressive policies to support renewable energy (Friedman Reference Friedman2010; Obama Reference Obama2011). Federal policies to subsidise deployment – mostly tax credits – have been short term, sometimes expiring, leading to policy uncertainty for renewable energy investors and erratic growth in renewable energy deployment (Laird and Stefes Reference Laird and Stefes2009). To fill this policy gap, state governments have taken the lead in promoting renewable energy, especially in terms of its near-term deployment [Rabe Reference Rabe2008; for a comprehensive database of federal and state policies, see Database of State Incentives for Renewables and Efficiency (DSIRE) nd]. In the absence of consistent federal leadership, states have often filled the role of enacting policies in many fields and trying new approaches to policy problems, thereby performing the role of policy innovators that advocates of federalism ascribe to them (Derthick Reference Derthick2001). To mandate renewable energy deployment, 37 states have enacted renewable portfolio standards (RPSs), also called renewable energy standards, which require utility companies to generate a specific share of retail electricity sales from renewable sources.Footnote 1 How can we explain why some states have enacted RPSs and others have not? In addition, how do we explain the different levels of ambition in the RPSs states reveal in their attempts to promote renewable energy? These are the two central research questions of this study.
Given the importance of state leadership in renewable energy and climate change policy, several studies have investigated the factors that might promote the adoption of such policies, identifying around 20 factors (for a good review of the literature, see Wiener and Koontz Reference Wiener and Koontz2010). Among these variables are partisanship, per capita wealth, ideology, interest group strength, severity of local pollution, electricity price and many more.
Recent scholarship exhibits creativity when thinking about the potential causes for the creation of state policies surrounding renewable energy development. Yet, almost all studies depict the dependent variable, the policy output, too simply. They usually consider RPS adoption as a binary choice – states either adopt an RPS or they do not. Once a state adopts an RPS, it is excluded from the model for all subsequent years (Huang et al. Reference Huang, Alavalapati, Carter and Langholtz2007; Matisoff Reference Matisoff2008; Chandler Reference Chandler2009; Lyon and Yin Reference Lyon and Yin2010).Footnote 2 Although such an approach contributes to our understanding of why states may adopt an RPS, the simple enactment of an RPS tells us little about how serious that state is towards promoting renewable energy. For one, nearly two-thirds of states with an RPS in effect have passed subsequent amendments altering the terms of the original RPS policy. Second, there exists a great deal of variation in the ambitiousness of state RPS enactments.
Although some states have enacted RPS targets that are well within reach (or in some cases that have already been reached), others have enacted far more ambitious RPS targets that require extensive investments in renewable energy. In order to assess variations in the ambitiousness of state RPSs, we collected data on every state from 1994 to 2009. To identify the increase in renewable energy production needed for states to achieve an RPS goal, we obtained U.S. Energy Information Administration (EIA) data on the amount of renewable energy produced by each state from 1999 to the present (EIA 2010). Figure 1 provides one perspective on the differences that exist across RPS enactments.
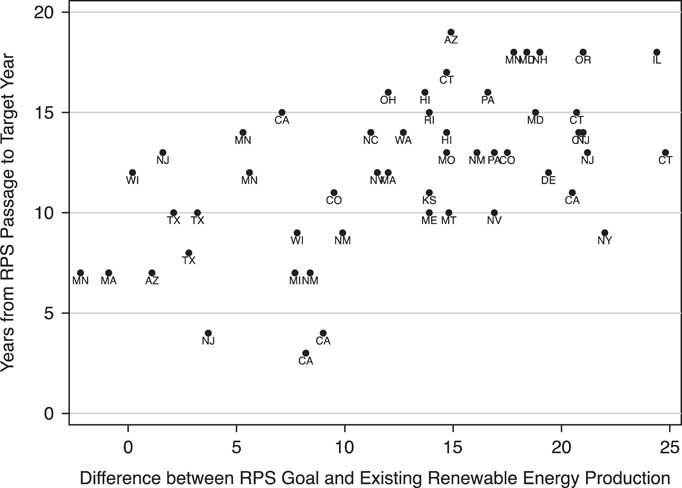
Figure 1 Renewable portfolio standard (RPS goals), existing renewable energy production and years to achieve RPS goal: 1999–2009.
Figure 1 displays two characteristics of state RPSs for the 53 state/years between 1999 and 2009 when state governments either adopted an RPS for the first time or amended an existing RPS. Along the x-axis is the increase in renewable energy production as a percentage of the total electricity production necessary for a state to successfully achieve its RPS goal. When excluding hydroelectric power, two states had imposed an RPS that had already been achieved at the time of its passage – namely, Minnesota (2009) and Massachusetts (2002). In these cases, obviously no additional renewable energy investment or development is needed to reach the RPS goal. In stark contrast, as seen on the right side of the figure, nine states adopted an RPS requiring an increase in renewable energy production of more than 20%. In 2007, Connecticut adopted an RPS goal of 27% when the share of the state's energy from nonhydroelectric sources was just 2.2%. This targeted increase of 24.8% is the largest of any state. Across all cases, the average increase in renewable energy production needed to reach the RPS is 12.5%.
The y-axis on the figure corresponds to the number of years between the passage of an RPS to the target year when the state expects to reach the RPS. For the cases included in the figure, the average number of years to reach the established renewable energy level is 12. At its minimum, an RPS passed by the California legislature in 2007 provided the state with just three years to reach the RPS goal of 20%. An additional 11 cases imposed an RPS target year fewer than 10 years from the enactment date. The remaining cases, which correspond to more than three-quarters of RPS enactments, establish a target year that extends beyond 10 years. At its maximum, Arizona’s RPS (passed in 2006) gave the state 19 years to reach an RPS of 15%. On five other occasions, states adopted a target date extending 18 years beyond the RPS adoption date.
Considering these two primary elements of RPS policy, it is striking that most existing research has treated all RPSs as essentially equal by measuring RPS adoption as a binary variable. The principle aim of this study is therefore not so much about expanding and testing the already long list of independent variables, although for comparison we do model both RPS enactments and amendments using factors previous scholars have assessed, in addition to adding some novel variables such as Berry et al.’s (Reference Berry, Ringquist, Fording and Hanson2007) citizen ideology measure. After this more traditional analysis, we reexamine influential independent variables by testing these variables against a new measure – the states’ ambitiousness in adopting an RPS. Thus, a primary contribution of this study is an examination of factors affecting the variation in the ambitiousness of state RPS enactments.
To foreshadow our results, our analysis finds that legislative partisanship, in addition to several key economic and demographic factors, significantly affect state decisions to adopt or amend an RPS, whereas characteristics of a state’s energy landscape, with the exception of electricity price, are mostly inconsequential. When we further separate legislatures into those with one-party dominance versus those with more partisan balance, we find that different variables come to prominence.
Beyond these policy adoption results, the only factors found to exert an effect on the ambitiousness of state-enacted RPS policy are Democratic control of state legislative chambers and existing electric pricing levels. A multitude of other factors theorised to affect renewable energy policy demonstrate no effect on states’ ambitiousness in promoting such policies. In sum, we find that a number of factors affect whether a state will adopt an RPS, but only Democratic legislative majorities and electricity prices are shown to affect the policy’s content.
In the following section, we review existing studies that attempt to explain why governments actively engage in the promotion of renewable energy. In doing so, we look beyond the borders of the U.S. and selectively discuss studies that cover European countries as well. Following this review, we present our data and modelling approaches along with the empirical analysis. After assessing the empirical results, our study concludes with suggestions for further research.
Promoting renewable energy in the US and abroad
Democratic governments might promote renewable energy for a variety of reasons. For one, they might believe that renewable energy offers apt solutions to pressing problems such as air pollution and unemployment. Moreover, even if they do not fully believe in the utility of renewable energy, they might feel pressure from interest groups or the electorate at large to throw their support behind it (Vachon and Menz Reference Vachon and Menz2006). Of course, governments’ inclinations to view renewable energy as a suitable means to address social and economic issues, as well as calculations concerning interest groups and voters, depend a great deal on the government’s political and institutional makeup. Republicans are generally less dependent on the votes and campaign contributions of environmental groups and voters than are Democrats.Footnote 3 Finally, these parameters are not static. Once enacted, policies and institutions develop a momentum that may change any of the variables discussed above. For instance, path dependency has significantly contributed to the German energy transition (Stefes Reference Stefes2014).
To begin, poor air quality might be an important reason why governments may support renewable energy development. However, whereas Matisoff (Reference Matisoff2008) detects a moderate positive correlation between air pollution and U.S. states’ inclination to support renewable energy, Lyon and Yin (Reference Lyon and Yin2010) as well as Fischlein et al. (Reference Fischlein, Larson, Hall, Chaudhry, Peterson, Stephens and Wilson2010) do not find any relation between the two variables. Neither do Marques and Fuinhas (Reference Marques and Fuinhas2011) in their study of renewable energy policies enacted in European countries. If policymakers do not see renewable energy as a remedy to reduce air pollution, they might instead consider it a means to meet future energy demands. In fact, it appears that governments of U.S. states with significant population growth, and therefore rising energy demands, are more inclined to support renewable energy than those whose states see stagnating population growth (Huang et al. Reference Huang, Alavalapati, Carter and Langholtz2007; Lyon and Yin Reference Lyon and Yin2010). They might especially be inclined to support renewable energy when there is large potential for wind or solar power. Although the qualitative studies of Wiener and Koontz (Reference Wiener and Koontz2010) as well as Fischlein et al. (Reference Fischlein, Larson, Hall, Chaudhry, Peterson, Stephens and Wilson2010) do not establish a link between government support for renewable energy and renewable energy potential, quantitative studies show a moderate to strong positive correlation between these two variables (Matisoff Reference Matisoff2008; Lyon and Yin Reference Lyon and Yin2010).
Further, renewable energy might be considered a powerful tool to spark economic growth and reduce unemployment. In their studies of several U.S. states, Wiener and Koontz (Reference Wiener and Koontz2010) as well as Fischlein et al. (Reference Fischlein, Larson, Hall, Chaudhry, Peterson, Stephens and Wilson2010) noted that this argument has indeed gained some traction among policymakers. However, quantitative studies again do not corroborate this finding (Huang et al. Reference Huang, Alavalapati, Carter and Langholtz2007; Matisoff Reference Matisoff2008; Chandler Reference Chandler2009; Lyon and Yin Reference Lyon and Yin2010). In fact, higher income states are more likely to support renewable energy developments than the lower income states that would gain the most from renewable energy expansion, according to the study by Wiener and Koontz (Reference Wiener and Koontz2010) and Fischlein et al. (Reference Fischlein, Larson, Hall, Chaudhry, Peterson, Stephens and Wilson2010).
In addition, Lyon and Yin (Reference Lyon and Yin2010) find that states with higher unemployment are less inclined to promote renewable energy. To explain these findings, it is safe to assume that states facing an economic crisis are less willing to promote renewable energy, which might be considered costly and a distraction from addressing other more pressing issues. As renewable sources still face economic disadvantages, the comprehensive use of renewable energy could lead to higher electricity prices that would dampen economic recovery. However, Lyon and Yin (Reference Lyon and Yin2010) as well as Marques and Fuinhas (Reference Marques and Fuinhas2011) do not establish a correlation between electricity prices and governments’ inclination to support renewable energy in U.S. states and European countries, respectively.Footnote 4 The impact of economic development on governments’ support for renewable energy might therefore be more complex and is probably filtered through political factors.
Though the ideological history of renewable energy is complex (Laird Reference Laird2001), since the 1970s policymakers have often associated it with environmental and liberal values. Therefore, it is not surprising that polities with more liberal residents are more likely to support renewable energy than conservative states (Matisoff Reference Matisoff2008; Fischlein et al. Reference Fischlein, Larson, Hall, Chaudhry, Peterson, Stephens and Wilson2010; Stefes Reference Stefes2010; Wiener and Koontz Reference Wiener and Koontz2010; Carley and Miller Reference Carley and Miller2012). With reference to the work of Inglehart (Reference Inglehart1977), the spread of liberal and environmental values might be directly linked to the economic security and well-being of citizens. In a similar vein, states whose legislatures are controlled by the Democratic Party therefore have a stronger propensity to support renewable energy than states with Republican legislatures (Huang et al. Reference Huang, Alavalapati, Carter and Langholtz2007; Fischlein et al. Reference Fischlein, Larson, Hall, Chaudhry, Peterson, Stephens and Wilson2010; Lyon and Yin Reference Lyon and Yin2010; Carley and Miller Reference Carley and Miller2012). This correlation, however, does not seem to hold for governorship (Lyon and Yin Reference Lyon and Yin2010).
Although political values are an important factor to consider, they only matter if they translate into political behaviour. Hence, several studies show that the cause of renewable energy particularly benefits from organised interest groups that lobby on behalf of renewable energy expansion (Laird and Stefes Reference Laird and Stefes2009; Lyon and Yin Reference Lyon and Yin2010; Wiener and Koontz Reference Wiener and Koontz2010). Yet, pro-renewable energy alliances usually face very strong opposition. Fossil fuel industries generally oppose renewable energy expansion, which would invariably come at the expense of other energy sources (Laird and Stefes Reference Laird and Stefes2009; Jiusto and McCauley Reference Jiusto and McCauley2010; Wiener and Koontz Reference Wiener and Koontz2010). As the presence of large industries in a state invariably causes policymakers to pay close attention to that industry’s needs and wishes, we should reasonably expect that the strength of fossil fuel industries be inversely related to a state’s support of renewable energy, especially if the former can count on a Republican legislature. Yet, neither Matisoff (Reference Matisoff2008) nor Lyon and Yin (Reference Lyon and Yin2010) notice any strong correlation between these factors; however, it is too early to discard the impact of fossil fuel industry opposition on renewable energy development. Lyon and Yin (Reference Lyon and Yin2010) also show that, in states in which utilities depend more heavily on natural gas, governments tend to be less enthusiastic about renewable energy development. Natural gas was more expensive than coal, but that has changed owing to the increased supply and resulting drop in gas prices. As a result, utilities prefer to invest in new natural gas generation and so resist mandates to invest in renewable energy.
Polities learn from each other. The diffusion effect should therefore accelerate the spread of pro-renewable energy policies among U.S. states, and some diffusion theories posit that policy learning is subject to geographic distance, with neighbouring states the first to emulate the policies of pioneer states. In fact, the study by Chandler (Reference Chandler2009) as well as Wiener and Koontz (Reference Wiener and Koontz2010) attribute a strong effect to diffusion on the propensity of neighbouring states to support renewable energy development. However, a more careful study by Matisoff (Reference Matisoff2008) reveals that geographic proximity also comes with similar economic, social and political developments, as well as comparable potential for wind and solar power. He thereby convincingly demonstrates that the correlation that seems to corroborate the geographic diffusion theory is spurious.
Finally, inertia is a common trait of policies and institutions (Pierson Reference Pierson2004). The change from fossil fuels to renewable energy is therefore an economic and political uphill battle. As Jiusto and McCauley point out, “With annual revenues of some $500 billion, ‘business as usual’ in the electrical power industry enjoys the support of powerful social, financial and political interests reinforced through public and private institutions that constitute and manage the electricity system” (2010, 552). However, once renewable energy gains a foothold, its further expansion is likely to benefit from an economic momentum that stems from sunk costs and economies of scale. At the hands of skilled policy entrepreneurs, economic expansion might then translate into increased political power (Stefes Reference Stefes2010, Reference Stefes2014). Independent state agencies that are somewhat autonomous from political pressure might further accelerate the growth of renewable energy (Laird and Stefes Reference Laird and Stefes2009). Path dependency will then favour rather than disadvantage renewable energy. The crucial but also most difficult moment would accordingly be the initial passing of a strong renewable energy policy. Yet, as the study by Urpelainen (Reference Urpelainen2012) shows, even in the absence of a strong supportive renewable energy alliance, it would still be rational for pro-renewable energy policymakers to promote stringent renewable energy standards, precisely because of the self-reinforcing dynamics that follow the implementation of these standards.
In short, scholars have found the following variables to have a strong impact on states’ decisions to enact RPSs: (1) level of economic development, (2) climatic conditions that affect the potential for renewable energy development (wind and sun), (3) population growth, (4) citizens’ ideology, (5) the power of interest groups (pro- and anti-renewable energy), (6) political control of the legislature (and maybe the governorship), (7) path dependency and (8) the existence of autonomous state energy agencies. To what degree these variables individually matter and how they interact with each other to influence state governments’ ambitiousness in promoting the expansion of renewable energy will be tested and discussed in the remainder of this study.
Data and methods
States have used a wide variety of policy tools to advance renewable energy development, often involving tax breaks for firms or individuals who use or install renewable energy (e.g. Matisoff Reference Matisoff2008). This great diversity of policies renders cross-state comparisons difficult, as there is no single metric that would comprehensively capture state renewable energy initiatives and policies. Using the actual amount of renewable energy produced is not a reasonable substitute for a variable that measures policy, as many factors other than renewable energy policy, and that are only indirectly influenced by such policy, also influence how many kilowatt hours a state gets from wind, solar or other forms of renewable energy (Delmas and Montes-Sancho Reference Delmas and Montes-Sancho2011). Indeed, some forms of renewable energy, such as that generated by passive solar building design, are difficult to measure at all. In many ways the RPS is the iconic renewable energy policy. It requires electric utilities in the state (although it may exclude municipal utilities or rural co-ops) to acquire a fraction of their retail sales from renewable sources by a specific target date. Thus, RPSs drive large-scale deployment of renewable energy more than other state policies.Footnote 5
In order to analyse state-level factors hypothesised to affect RPS enactment, amendment and ambitiousness, we collected data for all 50 states from 1994 to 2009 using the state/year as the unit of analysis. This range of years was selected, as it covers the contemporary period in which states have begun enacting such policies. In 1983, Iowa became the first state to enact an RPS, which was subsequently revised in 1991 (Wiser and Barbose Reference Wiser and Barbose2008). Minnesota became the second state to enact an RPS in 1994. Thus, with the exception of Iowa’s initial RPS enactment and amendment, the sample used for this study includes every instance of state RPS codification and post-enactment amendments through 2009.
Data regarding state RPS policy were obtained through the DSIRE database, a federally funded data gathering and research enterprise housed at the University of North Carolina. As DSIRE is the “comprehensive source of information on incentives and policies that support renewables and energy efficiency in the United States”, it is commonly used by researchers as an authoritative source of data on RPS policy (Vachon and Menz Reference Vachon and Menz2006; Chandler Reference Chandler2009; Wilson and Stephens Reference Wilson and Stephens2009; Lyon and Yin Reference Lyon and Yin2010; Yin and Powers Reference Yin and Powers2010; Carley and Miller Reference Carley and Miller2012). As of 2009, 29 states and the District of Columbia had some form of RPS policy in effect.Footnote 6 Among these states, many have passed significant RPS amendments that are also important to consider.
A ballot measure passed in 2004 by Colorado voters imposed an RPS of 3% to be achieved in three years, with an increased RPS of 10% by 2015 (Union of Concerned Scientists 2007). In 2007, the state legislature amended the existing RPS to impose a 20% renewable energy benchmark with a target date of 2020. As amendments to state renewable energy policy such as these have been commonplace over the past decade, our first dependent variable also incorporates instances of modifications to existing RPS policies in addition to their initial adoption. In total, states have acted to amend a preexisting RPS 33 times. Combined with the initial RPS enactments, states have adopted or modified RPS policies on 62 occasions. Table 1 provides state-specific RPS summary data.
Table 1 Renewable energy portfolio standard enactments: 1994–2009
Source: Database of State Incentives for Renewables and Efficiency.
RPS=renewable portfolio standard.
As shown in both Table 1 and Figure 1, there exists a substantial amount of variation in the content of state’s RPS enactments. Indeed, states that have enacted an RPS can do much to make their regulations more or less stringent. How high is the percentage of renewable energy requirement? How does that compare with renewable installations in the ground before the RPS went into effect? Which technologies count for meeting the RPS? These all affect whether a state’s RPS will require much in the way of new renewable energy installations. In order to gauge their ambitiousness, we consider three important factors for states that have adopted an RPS: the RPS goal itself, the existing amount of renewable energy production and the number of years allotted to reach the RPS target.
To reiterate, a primary goal of this study is to measure RPS policy with more precision. With such a measure, we can advance beyond an assessment of factors that affect the adoption of an RPS to an analysis that carefully differentiates RPSs from one another. As with many concepts in the social sciences, there are a number of plausible ways to measure RPS ambitiousness. Perhaps the most simplistic would be to use the raw percentage of a state’s energy required to come from renewable sources. Referencing Table 1, California’s existing RPS goal of 33% would be considered more ambitious than the goal of 5.3% set by Texas. However, the percentage of energy required to come from renewable sources as imposed by an RPS only tells part of the story.
In 2007, California and Colorado each passed legislation establishing an RPS of 20%. Considering only the raw renewable energy percentages imposed by the RPSs, these two are equally ambitious. However, we should also consider the existing amount of renewable energy production as a component of RPS ambitiousness. At the point when these RPSs passed, California was producing nearly 12% of its energy through nonhydroelectric renewable sources, whereas the share of renewable energy produced in Colorado was only 2.5% (EIA 2010). Given that the status quo regarding renewable energy production varies across states, the increase in renewable energy production needed in Colorado to reach the 20% goal is much higher than what is necessary in California. Accordingly, though they establish the same RPS goal, we consider the Colorado RPS to be more ambitious, given the preexisting amount of renewable energy produced in the state.
The final factor incorporated into our ambitiousness measure is the allotted number of years (or planning horizon) for a state to reach its RPS target. For example, Oregon and New Jersey each imposed a new RPS in 2007. Oregon pegged its RPS at 25%, whereas New Jersey established an RPS goal of 22.5%. At the time of their enactment, Oregon produced 4% of its energy from renewable sources (other than hydroelectric) and New Jersey had a renewable energy share of 1.5%. In these cases, despite the different RPS percentages, both states needed to increase their renewable energy production by 21% to reach their goals. Simply considering the increase in renewable energy production necessary to reach the RPS standard, these two would be equally ambitious. However, Oregon’s RPS goal was scheduled to be reached by 2025, whereas New Jersey sought to achieve its RPS by 2020. This difference in target years means that Oregon has an additional five years to increase its renewable energy production by the same amount as New Jersey. In this respect, we consider the New Jersey RPS more ambitious given the shorter time frame to reach the goal. To take into account these three factors, our preferred measure of RPS ambitiousness is the average per cent increase in renewable energy necessary to reach the RPS target.Footnote 7 Specifically, this variable is calculated by the equation below:
 $${\rm RPS}\,{\rm ambition} ={{({\rm RPS}\,{\rm goal}-{\rm Existing}\,{\rm renewable}\,{\rm energy}\,{\rm production})} \over {({\rm RPS}\,{\rm target}\,{\rm year}-{\rm RPS}\,{\rm adoption}\,{\rm year})}}$$
A potential critique of this measure concerns the time frame in which an RPS is scheduled to be reached. One could argue, for example, that an average annual increase in renewable energy production of 1% over a five-year period is more ambitious than an average annual increase of 1.2% over a period of 10 years, since the latter case provides double the amount of time to reach the RPS goal. However, it remains important to remember that states are not adopting RPS policies in a vacuum. In the prior example, it may be the case that sufficient technology and infrastructure exist that would allow a state to ramp up its renewable energy production over a short time span. As discussed in the following paragraphs, several independent variables are used to account for variations in existing state energy capabilities. Because of this, we argue that the average annual increase in renewable energy production necessary to successfully reach an RPS goal is the optimal way to operationalise RPS ambitiousness in a meaningful, yet parsimonious fashion.Footnote 8 In order to calculate RPS ambition in this manner, we use data from the EIA and Wiser and Barbose (Reference Wiser and Barbose2008) report on renewable energy policy among the states.
Table 2 provides values for this ambition measure in each state/year where an RPS was adopted or amended. According to this metric, three of the top five most ambitious policies were amendments to California’s RPS passed in 2006, 2007 and 2009. Beyond California, New York’s RPS passed in 2004 is the only other RPS requiring an average annual increase in renewable energy production exceeding 2%. Average RPS ambition is slightly greater than 1%, with a minimum value of 0 and a maximum of 2.73%. In order to examine factors expected to affect RPS policy change, the analysis that follows considers a number of political, economic, demographic and geographic variables.
Table 2 Ranking of state RPS ambition: 1999–2009
Source: Database of State Incentives for Renewables and Efficiency and created by authors.
RPS=renewable portfolio standard.
The specifications of our models consider those independent variables identified as relevant in the literature. Data on the party majorities in each chamber of state legislatures were obtained from the U.S. Census Bureau and publications from the Council of State Governments. These data were combined into a single ordinal variable ranging from a value of 0 when both chambers are controlled by the Republican Party to a value of 1 when each party controls one chamber and a value of 2 when both chambers are controlled by the Democratic Party.
To account for the economic well-being of both the state government and its citizens, we include variables indicating annual state revenues (standardised into a per capita ratio in thousands of dollars) and the median household income (in thousands of dollars) in each state. As other studies have identified, government revenues can be an important factor in determining a state’s “implementation capacity” for designated energy policies (Nelson Reference Nelson2012, 184). State revenue data are collected from the National Association of State Budget Officers (2010), whereas the United States Census Bureau (2012) lists household income data, which are normalised using 2010 dollars. Census data are also used to create annual variables for population change (in per cent) and density (in thousands of people per square mile). Further, we include Berry et al.’s (Reference Berry, Ringquist, Fording and Hanson2007) measure of citizen ideology to test whether a more liberal citizenry exerts an influence on state renewable energy policy.
To measure the impact of interest groups, we include the fraction of a state’s gross state product (GSP) emanating from the oil and gas industry as a measure of its importance to the state. These figures are collected and disseminated by the Bureau of Economic Analysis within the U.S. Commerce Department. The specific measure employed is the real GSP by state attributable to oil and gas extraction in millions of chained 2005 dollars, standardised into a per capita ratio variable. Equally direct measures were not available for coal. Therefore, as a proxy for the importance of this industry, we include a variable indicating the share of the state’s energy consumption that comes from coal-based sources, obtained from EIA annual reports.
States surely have different renewable resources and opportunities to exploit those resources available to them. To test the importance of these variables, we include from the Energy Department a variable indicating the wind energy potential per state. Renewable energy installations, especially wind, often require considerable land areas with low population densities, so to account for that problem we include population density as an explanatory variable.Footnote 9 To take into consideration path dependence, some models also include a variable representing the preexisting amount of nonhydroelectric renewable energy produced in each state, which assumes that states that already feature a significant share of renewable energy are more likely to take further and more ambitious steps towards an alternative energy economy.Footnote 10
Results
In line with recently published research on RPS policy (Yin and Powers Reference Yin and Powers2010; Carley and Miller Reference Carley and Miller2012), one of our main arguments is that scholars should conceptualise RPS policy in a more sophisticated fashion beyond simply whether a state has adopted a renewable energy standard. Before the analysis incorporating our preferred measure of RPS ambition, we first present results from a series of models using the more traditional binary measure of RPS adoption or amendment. We present this analysis for two reasons. First, it uses an extended time series with a full battery of variables, some of which have not been included as explanatory factors in existing studies. In this regard, we are able to construct a more comprehensive model of RPS enactments that considers both original policy adoption as well as any subsequent amendments. Second, with the results from this analysis, we can then compare whether these factors exert similar pressures on the ambitiousness of RPS enactments. As our results demonstrate that some factors shown to contribute to a change in RPS policy do not exert consistent effects on the actual content of the policy, we believe it is important to present both sets of models.
As seen in Table 1, a majority of states that have adopted an RPS have on at least one occasion amended the original enactment. As 18 states have reformed their RPS on multiple occasions, we first model RPS adoption or amendment using a Cox duration model. These types of models are optimal to assess policy adoptions that occur multiple times both within and across states (Box-Steffensmeier and Zorn Reference Box-Steffensmeier and Zorn2002; Jones and Branton Reference Jones and Branton2005). From a technical perspective, a primary advantage of Cox duration models is the fact that they do not require a parameterisation of the baseline hazard function (Cox Reference Cox1972). Further, because RPS amendments commonly occur, Table 3 presents results from Cox conditional gap-time models where the adoption or amendment of an RPS is the dependent variable of interest. This model maintains all cases across the full time period and stratifies according to the event number as they occur by state. The stratification imposed by such a model “preserves the ordering of events, whereas nonstratified estimates assume that the ordering of events is unimportant” (Jones and Branton Reference Jones and Branton2005, 431). As RPS policy change within individual states is a potentially repeatable event, this Cox model variant is the most appropriate modelling approach.
Table 3 Cox conditional gap-time model estimates of RPS policy change
Notes: Standard errors clustered by state in parentheses. Efron approximation method used for ties. Marginal effects on the hazard rate according to a one-unit change in each independent variable reported in brackets. Marginal effects calculated holding all continuous variables at their mean values and noncontinuous variables at 0.
RPS=renewable portfolio standard; GSP=gross state product.
*p<0.10; **p<0.05; ***p<0.01.
Though our analysis uses a time frame spanning 1994–2009, several independent variables were not available across the entire time series. The first model presented in Table 3 includes partisan, ideological, economic and population factors that span nearly the entire period for a sample size of 660. As subsequent models incorporate additional variables, data limitations reduce the sample size such that these models capture 10 years. Further, as will be discussed, the fourth and fifth models in Table 3 divide the sample according to the partisan balance of the state legislature.
Results from the first three models indicate that legislatures controlled by Democrats are more apt to adopt or amend RPS goals, but the partisanship of the governor does not impact RPS policy change. For each model, marginal effects for statistically significant variables indicating the per cent change in the hazard rate following a one-unit change in the variable are reported in brackets. Holding all other variables (except for the binary governor party variable) constant at their mean values, the hazard rate increase attributable to an additional chamber under Democratic control ranges from 48 to 289%. These findings regarding legislative and gubernatorial partisanship mostly comport with existing research (Huang et al. Reference Huang, Alavalapati, Carter and Langholtz2007; Fischlein et al. Reference Fischlein, Larson, Hall, Chaudhry, Peterson, Stephens and Wilson2010; Lyon and Yin Reference Lyon and Yin2010). Lyon and Yin (Reference Lyon and Yin2010), for example, similarly find evidence of legislative influence, but none on behalf of the governor. Beyond legislative partisanship, state resident ideology is also shown to be influential. In each of the first three models, this variable’s coefficient estimate is both positive and significant, which suggests that the demand for progressive renewable energy policies among many states with a more liberal citizenry contributes to the enactment of such policies. Carley and Miller (Reference Carley and Miller2012) likewise identify citizen ideology as a factor contributing to renewable energy policy reforms.
Each model includes three economic measures – median income, state revenue and average electricity price. In most models, state revenue does not correspond with the imposition of an RPS, but states with higher median incomes are more likely to implement an RPS when controlling for other factors. Thus, the general affluence of the public is of more consequence than a state’s budgetary health in any given year. The electricity pricing variable emerges as a significant explanatory variable in two of the three models, indicating that states with higher electricity prices are more apt to revise RPS policy.Footnote 11 One plausible reason for this finding is that an RPS can impose costs on utilities, which they then pass through to consumers. If pre-RPS electricity prices are already high, the electricity coming from new renewable energy sources will be more competitive and so less of a price increase to consumers, possibly blunting consumer backlash.
As the examples of several European countries show, however, high energy prices might also give ammunition to the opponents of renewable energy expansion. The opponents argue that increasing the share of renewable energy will further increase energy prices and thereby weaken the competitiveness of energy-intensive industries and impose financial strains on private households, especially low-income households. High energy prices might therefore have different effects depending on the share of renewable energy (Spiegel Online 2013). At relatively low levels, high energy prices might have no political effect or may even entice policymakers to increase the share of renewable energy. Beyond a certain threshold, however, policymakers become more worried about the economic impact of renewable energy. In the U.S., the data show that this threshold has not yet been reached.
Each of the models also includes two variables regarding state population. In the first three models, population factors are mostly insignificant in predicting RPS reform. The first model is the only one of the three where an increase in state population corresponds with a greater probability of RPS policy change. In this context, states may be more apt to consider renewable energy development as one of many resources to serve a growing population.
The additional variables – oil and gas GSP, coal and natural gas consumption, wind potential and the share of renewable energy coming from nonhydroelectric sources – added to the second and third models exhibit mixed effects on RPS policy reform. Oil and gas GSP and the existing level of renewable energy production do not make policy change in this area more likely. In the fully specified model, both coal dependence and natural gas levels exert a negative effect. As expected, RPS policy change is more likely to occur in states with greater wind potential.Footnote 12
When considered collectively, results from these three models generally demonstrate that RPS enactments and subsequent amendments are driven by a variety of factors. Characteristics of the public, legislative partisanship, electricity price and the existing energy landscape are each partially determinative of whether a state will take action on an RPS. The most consistent of these findings is that states with a more liberal, affluent public and a legislature controlled by Democrats are most inclined to adopt or reform an RPS. Despite not being as consistent, several energy-related factors do exhibit some effect on RPS policy change, though these effects are not robust across model specifications. The remaining slate of variables exhibit nonexistent effects on this particular aspect of state energy policy.Footnote 13
Weiner and Koontz (Reference Wiener and Koontz2010) make the claim that the process of creating policies to support renewable energy will differ in states with stronger ideological bent as compared with those states that are considered more moderate. To further develop and test this line of argument, the fourth and fifth models in Table 3 split the sample into two groups. The sample is split based on the partisan distribution of seats held in the state legislature. Extreme partisan legislatures include all state/years where one party controls more than 60% of the state’s legislative seats. Non-extreme partisan legislatures are those where neither party possesses more than a 60% seat majority. One would expect states in which Democrats or Republicans dominate the legislatures to enact or fail to enact RPS policies based on little more than the partisan considerations. However, in states with more competitive elections, we would expect other pressures to play a larger role, especially lobby efforts from traditional energy industries. These two additional models allow for an examination of any differences between the two groups.
Dividing the sample according to the degree of party divisions in the state legislature demonstrates some key differences. In fact, only one independent variable exerts a significant effect in both models – the ideology of the public. Comparing the substantive effects of this variable in the two models indicates that RPS change is more sensitive to shifts in public ideology when a more equitable balance exists between the parties regarding their seat share in the legislature. Differences in the effects of the remaining variables suggest that the partisan balance of the legislature exerts a conditioning effect on all other factors. Among state legislatures with a more partisan skew, citizen ideology, population density and change, as well as the existing amount of renewable energy production, each contribute to make RPS policy reform more likely. Combined, these results indicate that growing populations trending in a liberal direction combined with larger amounts of preexisting renewable energy production are the conditions most likely to engender action on RPS policy when a single party controls a large share of legislative seats. In such a partisan environment, we observe the only instance so far where the existing amount of renewable energy production appears to affect action on RPSs. Attempting to model path dependence, this variable is included to test whether greater production of renewable energy corresponds to a greater likelihood of an RPS enactment owing to the state’s success in developing this type of energy source. This does appear to be true in the extreme partisan legislature cases.
In legislatures with a more balanced party division, fewer factors are found to drive RPS policy change. Increases in electricity prices exert a positive and significant effect, as does the capacity for wind-based energy. A more liberal citizenry also corresponds with a greater likelihood of RPS adoption or amendment. In sum, there are some rather substantial differences when comparing cases where one party has a sizeable majority in the state legislature to those where the party balance is more evenly divided. Although population characteristics and path dependence are influential in more partisan legislatures, economic considerations and existing wind capacity are more determinative of RPS policy change in state/years where there is a more equitable balance between the parties.
Moving beyond the consideration of factors expected to affect whether a state will adopt an RPS or amend an existing one, the final analysis we present incorporates our preferred measure of RPS ambitiousness – the average annual increase in renewable energy production necessary for a state to reach the RPS goal. As the decision to adopt and determine the ambitiousness of an RPS is a two-step process – a decision to adopt an RPS followed by a decision regarding the renewable energy goal – we employ a two-stage Heckman selection model as the analytical approach.
Heckman selection models avoid problems associated with selection bias as a specification error (Heckman Reference Heckman1979). The first stage, known as the “selection stage”, includes independent variables hypothesised to affect whether a phenomenon occurs or is observed. As the presence or absence of an event – in this case whether a state adopts or amends an RPS – is a dichotomous outcome, a maximum likelihood estimation probit model is used to estimate the coefficients in the selection stage. The second stage, known as the “outcome stage”, uses an ordinary least squares (OLS) regression technique to model the ambitiousness of the RPS, which is measured as the annual increase in renewable energy production necessary to successfully achieve the RPS goal.Footnote 14 We are able to calculate this measure of RPS ambition for all RPS policies adopted since 1999, as EIA data on existing renewable energy production do not extend back further.
Tables 4 and 5 present estimates from two Heckman selection models examining factors expected to affect when states adopt or amend an RPS and the ambitiousness of the standard when such a policy change occurs. The first model uses nine independent variables in order to maximise the number of cases included in the model. This analysis spans 16 years. The second model adds four additional variables, but at the cost of a smaller sample size.Footnote 15
Table 4 Heckman selection models of RPS ambitiousness: selection stage
Notes: Standard errors clustered by state in parentheses.
RPS=renewable portfolio standard; GSP=gross state product.
*p<0.10; **p<0.05; ***p<0.01.
Table 5 Heckman selection models of RPS ambitiousness: outcome stage
Notes: Standard errors clustered by state in parentheses.
RPS=renewable portfolio standard; OLS=ordinary least squares; GSP=gross state product.
*p<0.10; **p<0.05; ***p<0.01.
As expected, a comparison of the results from the two modelling approaches reveals both similarities and differences. To start, the first model including fewer variables but spanning the entire time series identifies most variables as exerting a significant effect on RPS change. Examining the first column in Table 4, Democratic control of the legislature, a more liberal and affluent citizenry, increases in population growth and greater wind energy potential each correspond with a significantly greater likelihood that a state will act to amend its renewable energy standards in a given year.
To better understand the substantive effects of these factors, the second column in the table lists the derivative at the mean for each variable. The derivative at mean indicates the estimated increase in probability of a state adopting an RPS with a one-unit increase in an independent variable, holding all continuous variables constant at their average value and all remaining variables at a value of 0. For legislative partisanship, for example, the likelihood that a state will adopt an RPS increases by an expected 0.8% as Democrats attain majority-party status in an additional chamber of the legislature. Likewise, a state median income growth of $1,000 increases the expected likelihood of RPS adoption by 0.2%, or about 1 percentage point for every $5,000 increase, ceteris paribus. A 1% increase in a state’s population increases expected RPS adoption probability by 1.1%.
The selection stage of the second model, which includes several additional factors, produces similar results to the first in terms of the sign and significance of variables included in both models. Of the four additional variables included in the second model, only the state’s dependence on coal-based energy sources affects RPS policy change. As this metric increases, RPS adoption becomes less likely. Comparing the derivatives at mean from the second model to those from the first model shows that the substantive effects of the variables are mostly comparable. Among the statistically significant predictors, only the legislative partisanship and population change variables are noticeably different. Using a more contemporary sample and controlling for four additional variables, the estimated effect of these two variables is about twice what it was in model 1. In model 2, a one-unit increase in legislative partisanship and population growth each increase estimated RPS adoption by nearly 2%. Overall, these selection stage results generally comport with the results from the previous analysis, indicating that legislative partisanship, state resident ideology and affluence, population increases and electricity pricing often influence whether RPS policy change will occur.
Results from the outcome stages, which assess factors affecting RPS policy ambition, are presented in Table 5. Findings from this analysis are notable for multiple reasons. First, for state/years where RPS policy change occurs, fewer variables emerge as having a statistically significant effect on the content of these policies. Model 1, which uses the entire time series, shows that RPS goals have become more ambitious over time (as evidenced by the significant coefficient estimate on the time trend variable), as well as under the conditions when Democrats control the legislature and when electricity prices are higher. As these estimates are OLS coefficients, they are more easily interpreted. As Democrats gain an additional chamber in the legislature, we would expect the ambition of the RPS enactment to rise by nearly 0.2%. Results from the second model also demonstrate that RPS policy enactments are more ambitious when Democrats hold legislative majorities in the statehouse. The estimated effect of Democratic majorities is greater in the second model where an additional chamber under Democratic control is expected to increase RPS ambition by 0.28%. Accordingly, for an RPS goal that is targeted to be reached in 11 years (the average among all cases in our sample), this would mean that the RPS itself would be expected to be 3.08% greater under unified Democratic control relative to one passed under divided legislative majorities, if all other factors are held constant. In fact, Democratic legislative partisanship is the only variable shown to influence RPS ambition in both models, and it is the single factor where we can confidently reject the null hypothesis out of the 12 total independent variables included in the second model.
When considered in totality, the results from our analysis show that many economic and demographic variables affect the likelihood of RPS policy change. Relatively fewer variables exert an appreciable effect on the ambitiousness of the RPS objective codified by the state. These findings align with those of Carley and Miller (Reference Carley and Miller2012), who also identify few variables affecting the stringency of RPS policy enactments. Their analysis, which extends through 2008, finds citizen ideology, GSP per capita and a time trend variable as the sole factors responsible for influencing renewable energy objectives.
One key difference between our studies is the effect of legislative partisanship. Although we identify a robust effect for Democratic legislative partisanship, Carley and Miller do not. This discrepancy is attributable to the different partisanship measures used in the two studies. To test whether legislative partisanship is indeed a consequential factor, we consider the number of chambers where Democrats hold majority-party status, while Carley and Miller’s study uses the percentage of seats held by Democrats in the state’s lower chamber. As RPSs must pass both chambers to successfully progress towards adoption, it is critical to consider both legislative chambers. In so doing, there exists strong evidence that the RPSs are made more ambitious under the condition of Democratic majorities in the legislature. As the following section discusses, this finding is among our largest contributions to the existing scholarship on state renewable energy policy.
Discussion
The analysis presented in this article differs from that of other research on this topic in important ways. First, we developed a database that includes both when states adopt an RPS and when they amend them. Amendments to RPS policy are policy initiatives in their own right – that is, successful efforts by renewable energy supporters to strengthen policies for their energy sources. Therefore, variables that drive the adoption of RPS policies should also drive their subsequent modification and the ambitiousness of these policies.
Consistent with much of the earlier literature, economic, political and demographic variables are important factors influencing RPS policy. As is clear in Table 3, states with more liberal and wealthier citizens, growing populations, higher electricity prices and Democratic majorities in the legislature are often more likely to adopt or amend an RPS. The ideological component of this result fits with historical analyses that showed how renewable energy became politicised as a liberal issue, even though there is nothing inherently ideological in the technologies or resources (Laird Reference Laird2003; Matisoff Reference Matisoff2008; Fischlein et al. Reference Fischlein, Larson, Hall, Chaudhry, Peterson, Stephens and Wilson2010; Stefes Reference Stefes2010; Carley and Miller Reference Carley and Miller2012). The effects of resource or technological variables were largely inconsistent.
To engage in a more precise assessment of dynamics affecting RPS policy, this study presents a novel variable measuring the ambitiousness of the RPS enactment. After all, states could, in response to citizen and interest group pressures, pass RPS requirements that did not lead to much in the way of new renewable energy deployment–providing a symbolic sop to renewable energy advocates without giving them much substance. Carley and Miller provide empirical evidence for this claim, stating, “policymakers’ choices may be partially motivated by the extent to which such RPS designs can satisfy constituents’ ideological preferences by functioning as symbolic politics” (2012, 749). Moreover, in fact, the ambitiousness of RPS requirements varies greatly from those that had already been reached at the time of legislative passage to those requiring an average annual increase in renewable energy production of greater than 2% of sales.
Taking into account RPS ambitiousness as the dependent variable, the models produce very different results. In this instance, the only variable (exempting the time trend factor) with a statistically significant coefficient estimate in the outcome state of both model specifications is the partisan makeup of the legislature. These results are consistent with earlier results on the importance of political variables and show that partisan influence manifests itself in the details of the legislation, such as its ambitiousness. Although policy advocates who lobby legislatures keep close tabs on the technical details of the laws, the broader public does not, and legislators need to craft laws that can gain a majority vote. Given the overall support for renewable energy among citizens, even Republican-controlled legislatures have passed RPS policies. However, when evaluating such policies, it is important to consider the renewable energy targets that RPSs attempt to achieve. Given the resistance against renewable energy by conservative Republicans (Laird Reference Laird2001), it is unsurprising that RPS policies passed by Republican legislative majorities are often environmental fig leaves. On the other hand, Democratic legislative majorities tend to produce more stringent RPS policies. In short, for states that do adopt an RPS, the most important factor is whether the Democrats hold majority-party status in the statehouse. Under such a condition the RPS goal is apt to be more ambitious. Other variables, which have been demonstrated to affect RPS policy change, typically play a negligible role in influencing its ambition.
Conclusion
Our findings reinforce recent literature on the roles of public opinion and interest groups in the making of public policy. Although earlier literature claimed that policymakers were very sensitive to public opinion, more recent work that focuses on a broader array of policy issues concludes that such influence is quite limited (Burstein Reference Burstein2006). Hacker and Pierson (Reference Hacker and Pierson2005) point out that citizens can control politicians by threatening to throw them out of office only under a set of very stringent conditions, which policy-making circumstances rarely meet. Knowledge asymmetries undercut the responsiveness of policymakers to citizen opinion and such asymmetries play a major role in our case. As we discussed above, the ambitiousness of RPS policies, not their mere existence, determines how effective they are, and such technical features of policies usually fly under the radar of public opinion.
Our analysis of RPS policy ambition highlighted the role that partisan control of the legislature plays, which speaks to recent arguments about the relationship of interest groups to political parties. Analyses of interest groups and their efforts to influence public policy usually treat them as quite separate from political parties. However, a more recent analysis argues that interest groups are central to the formation of political parties and greatly influence whom those parties nominate more so than do party elites (Bawn et al. Reference Bawn, Cohen, Karol, Masket, Noel and Zaller2012). Based on that theory, our analysis suggests that environmental groups are becoming an increasingly important part of the Democratic Party support network, at least at the state level. In addition, our analysis shows that interest groups can be more successful to the extent that they are central to a political party. Baumgartner et al. (Reference Baumgartner, Berry, Hojnacki, Kimball and Leech2009) have studied lobbying at the national level across a random selection of policy issues and concluded that the best predictor of success for interest groups is lobbying to maintain the status quo, not which groups spend the most on lobbying. As advocates of RPS policies seek to change the status quo, they have an uphill task. To the extent that their favoured party captures state legislatures, they are more likely to get meaningful, that is, ambitious changes to that status quo. Although being associated with one political party may have drawbacks for renewable energy advocates and their environmental allies, in the case of RPS standards it is their best chance to promote strong policies.
Finally, the results from this study raise important issues for future research. Although our analysis has supported the general direction of earlier research, we have also made a case for a more nuanced approach to the dependent variable in such analysis. Political and social variables stand out as markedly important, which suggests some interesting avenues for future qualitative research. For those states with non-extreme legislatures, qualitative process-tracing studies can illuminate just what leads to the acceptance or rejection of renewable energy policies. How do the resources and tactics of renewable energy advocates and their adversaries play out in particular circumstances and lead to the adoption or rejection of policies and the ambitiousness of policies that do get adopted? Some of the earlier literature (Wilson and Stephens Reference Wilson and Stephens2009; Fischlein et al. Reference Fischlein, Larson, Hall, Chaudhry, Peterson, Stephens and Wilson2010; Wiener and Koontz Reference Wiener and Koontz2010) has already begun some of that case-based work, but much more remains to be done. Case studies of the most ambitious states would identify whether and why these states are outliers and provide insight into the effects of partisan splits between legislatures and governors.
Another striking feature of this analysis is the intensely partisan and ideological nature of renewable energy policy. Although there are historical roots to that association (Laird Reference Laird2003), it is not one given in the nature of the technology itself, and some renewable energy advocates have sought to present their technologies in a less ideological light. Thus, constructivist case studies could examine whether and how renewable energy advocates try to change or transcend that ideological condition and promote their technology as being beyond politics, a phenomenon that seems to have happened in some other countries (Laird and Stefes Reference Laird and Stefes2009; Stefes Reference Stefes2014). Their ability to do so may determine the strength and consistency of renewable energy policy in the U.S. in the future.
Acknowledgements
Financial support for this research was provided by the College of Liberal Arts and Sciences at the University of Colorado, Denver. Research assistance was provided by Christy Boerckel at the University of Colorado, Denver. We thank the anonymous reviewers and the Journal of Public Policy editors for their assistance.