


Dietary habits play an important role in the development of several chronic diseases that are the largest causes of morbidity and mortality in the world(Reference Yach, Hawkes, Gould and Hofman1, Reference Boeing, Wahrendorf and Becker2). Eating habits formed during childhood can affect the onset of several chronic diseases(Reference Ness and Powles3–Reference Waxman5). Therefore, the adoption of healthful eating in childhood and adolescence may prevent or delay the development of chronic diseases. However, several studies have reported that adolescents have poor eating habits(Reference Neumark-Sztainer, Story, Resnick and Blum6–Reference Johnson, Johnson, Wang, Smiciklas-Wright and Guthrie8). Thus, strategies aimed at modification of adolescents’ eating behaviour should be developed. However, factors associated with adolescents’ eating preferences should first be determined so that these strategies and interventions be successful. As a consequence, factors influencing the food preferences of children and adolescents have received and continue to receive increasing research interest(Reference Northstone and Emmett9–Reference Neumark-Sztainer, Hannan, Story, Croll and Perry16). A review reported that adolescents’ eating behaviour is a function of individual (i.e. attitudes, beliefs, knowledge, food preferences, dieting, etc.) and environmental influences (i.e. social environmental, macro-system and physical environmental)(Reference Story, Neumark-Sztainer and French12). In particular, environmental influences on adolescents’ eating behaviours and food choices include family members, teachers, peers, marketing and advertising, as well as accessibility and availability of foods. However, availability and access to foods reflects the family’s socio-economic status and lifestyle(Reference Roos, Lahelma, Virtanen, Prattala and Pietinen17).
There is a vast amount of studies from several populations that have revealed a significant association between children’s/adolescents’ food preferences and family socio-economic status(Reference Northstone and Emmett9, Reference Aranceta, Perez-Rodrigo, Ribas and Serra-Majem11, Reference North and Emmett14, Reference Hoglund, Samuelson and Mark15, Reference Ahmed, Zareen, Khan, Banu, Haq and Jackson18). However, studies investigating the association between lifestyle characteristics of adolescents/children and eating behaviour are limited(Reference Aranceta, Perez-Rodrigo, Ribas and Serra-Majem11).
Moreover, it should be noted that individual nutrients and food items have been used in the past to examine the relationship between dietary habits and demographic and lifestyle characteristics as well as health outcomes. However, people consume meals consisting of a variety of foods with complex combinations of nutrients and not single nutrients. Therefore, dietary pattern analysis has recently emerged as an alternative approach to evaluate the association of diet with several outcomes and has received increased attention from nutritional epidemiologists(Reference Hu19–Reference Kant21). Among methods used to determine dietary patterns are statistical techniques such as principal components analysis.
Therefore, the primary objective of the present work was to reveal the dietary patterns of Greek adolescents using principal components analysis, since, to the best of our knowledge, no previous work has been conducted with this purpose in such a population. The secondary aim was to investigate the relationships of adolescents’ lifestyle and socio-economic characteristics (i.e. number of cars owned by the family and existence of a separate bedroom for each child in the family) with the extracted dietary patterns.
Methods
Study sample
During 2004, 2118 students, aged 12–17 years (7th–12th grade), were selected from twelve schools located in the municipality of Vyronas (Greater Athens area). All high and senior high schools of Vyronas region voluntarily enrolled in the study. Prior to acceptance, children’s parents or guardians were fully informed about the objectives and methods of the study and signed an informed consent. Almost all adolescents of each school participated in the study (response rate 95–100 %). The Ethics Committee of the Vyronas Health Center approved the study, including data collection. The citizens of the Vyronas area represent an average picture of the capital’s population from the socio-economic and cultural perspective. The number of children enrolled was adequate (i.e. statistical power of 80 %) to evaluate standardized differences between various groups greater than 0·5 at probability level <0·05.
Demographic, socio-economic and lifestyle characteristics
Using a questionnaire developed for the purposes of the study, we retrieved information about age, sex, number of siblings, several indicators of the family’s socio-economic status (i.e. number of cars owned by the family, existence of a separate bedroom for each child of the family) and several adolescents’ lifestyle characteristics, such as their smoking habits (i.e. if they were current smokers and how many cigarettes smoked per day), time spent on sedentary activities (i.e. watching television, working on a computer, playing video games and studying) and the frequency and duration of their physical activities (brisk walking, swimming, etc.).
Assessment of socio-economic status is very difficult in practice, since a qualitative condition needs to be transformed into a quantitative measure. According to various social scientists, a family’s socio-economic status is based mainly on family income, parental education level and occupation skills, as well as social position within the community, such as contacts with other people and group associations, and the community’s perception of the family. Several composite indices have been proposed in order to evaluate family socio-economic status, such as the Kuppuswami Scale, the Wealthy Index Scale and the Income Scale. All of these indices incorporate information regarding the family’s annual income and ownership of some household items (i.e. television, cars, etc.). However, it should be mentioned that these indices have not been validated in many countries, including Greece; therefore, local scientists have used individual indicators of socio-economic status that include some of the previous information.
Dietary assessment
Dietary intake of the adolescents was assessed through a semi-quantitative FFQ consisting of sixty-three detailed questions. In particular, we recorded the frequency of snack foods consumed and the consumption frequency of fish, poultry, red meat, eggs, white bread, wholegrain bread, potatoes, pasta, rice, fruits, vegetables, fruit juices, soft drinks, milk, yoghurt, cheese and traditional Greek cooked meals during an average week or month of the past year (e.g. we asked ‘How many glasses of white milk do you usually drink?’, with possible answers of: none or 1 glass/month, 1 glass/week, 2–6 glasses/week, 1 glass/d, 2–3 glasses/d or ≥4 glasses/d). Emphasis was placed on seasonality of consumption with specific questions to the participants. We also retrieved information regarding the frequency of breakfast consumption, the frequency of consumption of cereals and dairy products with breakfast, the number of meals consumed during a usual day including snacks, the frequency of consumption of foods outside the home (including school canteens and no home-made meals), the cooking method usually used by the family and the type of oils/fat consumed. For every food/drink item in the questionnaire, a clearly described measure was used (e.g. a can of soft drink, one hamburger, one portion of chicken about 150 g, a bag of crisps, etc.). The aforementioned foods and beverages were coded as follows: (i) ‘fast food’, i.e. hamburger, pizza, hot dog, toast, cheese pie and spinach pie; (ii) ‘salty snack’, i.e. all kinds of crisps and pop corn and ‘sweet snack’, i.e. ice cream, milk shake, all kinds of chocolate, croissant, cakes and biscuits; (iii) ‘cheese’, i.e. cottage cheese, hard cheese and traditional Greek cheese (feta); (iv) ‘traditional Greek cooked food’, i.e. gumbo, pea, fresh bean, artichoke, gemista, moussaka, spinach with rice, cabbage with rice and aubergines; and (v) ‘potatoes’, i.e. baked, fried and boiled. Serving sizes were of typical servings sizes. When the FFQ was completed, subjects indicated how often, on average, they consumed the amount of each food item.
Statistical methods
Food component derivation
Dietary patterns were identified through principal components analysis using a correlation matrix(Reference Basilevsky22). The purpose of this approach is to identify a number of independent linear combinations (principal components) among a set of foods or food groups that retain much information about the original dietary habits. In other words, principal components analysis evaluates the correlations between all food intake variables and reveals similarities in the habits of people(Reference Basilevsky22). From the entire database, twenty-four foods and food groups were entered into principal components analysis. Because it is known that the results from a principal components analysis have some value only when strong correlations between the variables exist, the correlation matrix of the twenty-four initial food variables was extracted before performing the principal component analysis. There were several correlation coefficients |r| > 0·2, indicating that food variables were correlated together and, therefore, a principal components analysis could be effective for assessing food patterns.
The PCA procedure in STATA was used to perform the analysis. To decide the number of components to retain, two criteria were used: (i) the Kaiser criterion (eigenvalues >1); and (ii) the interpretability of components. An orthogonal rotation, varimax rotation, was used to derive optimal non-correlated components (food patterns). The information was rotated in order to increase the representation of each food or food group to a component, increasing the interpretability of each component. Based on the principle that the component scores are interpreted similarly to correlation coefficients, i.e. higher absolute values indicate that the food variable contributes most to the construction of the component, the food components (patterns) were named according to scores of the foods that correlated most with the components (scores ≥0·3).
Descriptive and other statistical analyses
Continuous variables are presented as mean and standard deviation, and categorical variables are presented as relative frequencies. Associations between categorical variables were tested by calculation of the χ 2 test, while the association between categorical and continuous variables was evaluated through Student’s t test. Multiple linear regression analysis was applied to assess the relationship between the dietary patterns extracted from the principal components analysis (dependent outcome) and the adolescents’ lifestyle as well as their families’ socio-economic characteristics (independent covariates). The variables included in the model were: age, sex, time spent watching television daily, hours of studying daily, sports activities outside school, smoking habits, number of siblings, number of cars owned by the family and the existence of a separate bedroom for each child of the family. Tests for normality of the residuals as well as for linearity and independence of the covariates included in the regression models were performed. Moreover, homoscedasticity was also assessed graphically in all regression models. All reported P values are based on two-sided tests and compared with a significance level of 5 %. The STATA statistical software package version 8 (STATA Corp., College Station, TX, USA) was used for all statistical calculations.
Results
Among 2118 students enrolled in the study, 1048 were girls and 1070 were boys with a mean age of 14 (sd 2) years for both genders. Full data had been recorded for almost 90 % of the participants. Table 1 illustrates the distribution of socio-economic and lifestyle characteristics of the adolescents, for boys and girls separately. No difference was observed between boys and girls regarding their smoking habits. However, it was observed that boys spent more time watching television/playing electronic games and they were more likely to have sports activities outside school compared with girls, while it was found that girls studied for significantly more hours than boys.
Table 1 Socio-economic and lifestyle characteristics of the Vyronas study participants by sex: adolescents (n 2118) aged 12–17 years
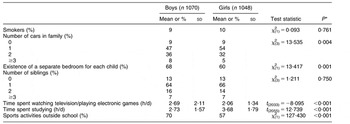
*P value for comparisons between boys and girls.
Seven components explaining the 50 % of the total variation in intake were extracted from the principal components analysis. The scores for the seven food components (patterns) are presented in Table 2 (coefficients with absolute value ≥0·3 are shown in bold font). The components were named based on the highest coefficient scores. Therefore, the patterns derived were named as follows: (i) a ‘junk food’ pattern (component 1) because of the high absolute scores on consumption of ‘sweet’ and ‘salty’ snacks, soft drinks and fast food; (ii) a ‘red meat’ pattern (component 2) since it is characterized by the consumption of beef, pork and meat products; (iii) a ‘vegetarian/healthy’ pattern (component 3) because of the high scores on vegetables, fruits and juices; (iv) a pattern characterized by the consumption of diary products, pasta and wholegrain bread (component 4); (v) a ‘close to Mediterranean diet’ pattern (component 5) including potatoes, rice, fish and poultry; (vi) a pattern characterized by the consumption of ‘traditional Greek cooked foods’ and legumes (component 6); and finally (vii) a pattern including eggs and white bread (component 7). No significant difference was observed regarding the variance explained by each component. In particular, the percentage of total variance explained by each component ranged between 8·9 % (component 1) and 6·1 % (component 7).
Table 2 Score coefficientsFootnote * derived from principal components analysis regarding foods or food groups consumed by Vyronas study participants: adolescents (n 2118) aged 12–17 years
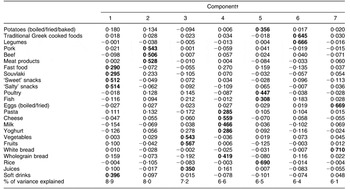
* Score coefficients are similar to the correlation coefficients. Higher absolute values indicate that the food variable is correlated with the respective component.
† Description of the components: 1, a ‘junk food’ pattern; 2, a ‘red meat’ pattern; 3, a ‘vegetarian/healthy’ pattern; 4, a pattern characterized by the intake of dairy products, pasta and wholegrain bread; 5, a ‘close to Mediterranean diet’ pattern; 6, a pattern characterized by the consumption of ‘traditional Greek cooked foods’ and legumes; 7, a pattern characterized by the consumption of eggs and white bread.
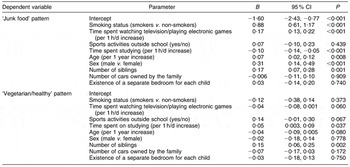
Multiple linear regression models were applied to examine independent associations between selected lifestyle and socio-economic characteristics of the adolescents and their families and the ‘junk food’ and ‘vegetarian/healthy’ dietary patterns. These two patterns were selected as representative of an ‘unhealthy’ and a ‘healthy’ food behaviour, respectively. Table 3 presents regression coefficients and the corresponding standard errors estimated by the aforementioned models. In particular, it was observed that adolescents closer to the ‘junk food’ pattern were older, boys, smokers, with many siblings, having a sedentary lifestyle (i.e. spend many hours watching television) and studying for fewer hours. On the contrary, adolescents closer to the ‘vegetarian/healthy’ pattern were younger, engaged in sports activities outside school, had increased number of siblings and spent more hours studying, while they were spending less hours viewing television or playing electronic games. In both models, no significant association was observed between socio-economic status indicators (i.e. number of cars that the family owns and existence of a separate bedroom for each child of the family) and adolescents’ dietary behaviours.
Table 3 Results from multiple linear regression analysis that evaluated the association between lifestyle and socio-economic characteristics and dietary patterns extracted by principal components analysis in the Vyronas study participants: adolescents (n 2118) aged 12–17 years
Discussion
The Vyronas study is a cross-sectional survey including 2118 adolescents from a region of Athens where the citizens represent an average picture of the capital’s population from the socio-economic and cultural perspective. Using principal components analysis, seven components were derived representing seven different dietary patterns. The first component could be described as a ‘junk food’ pattern explaining the greatest amount of variance in dietary intake. It was positively correlated with an overall unhealthy lifestyle of adolescents (i.e. many hours viewing television and smoking), while the third component was characterized as a ‘vegetarian/healthy’ pattern and it was correlated with an overall healthy lifestyle (sports activities outside school, few hours spent watching television). Moreover, no association was found between socio-economic status indicators and the aforementioned dietary patterns.
Dietary pattern analysis has recently emerged as an alternative and complementary approach to examine the relationship between diet and the risk of several chronic diseases. Similar dietary patterns have been derived, using principal components analysis, in several previous studies conducted among adults(Reference Wu, Hu, Willett and Giovannucci23–Reference Fung, Stampfer, Manson, Rexrode, Willett and Hu26). However, regarding the derivation of dietary patterns among children and adolescents, principal components analysis has been applied in only a few studies(Reference Northstone and Emmett9, Reference Aranceta, Perez-Rodrigo, Ribas and Serra-Majem11, Reference North and Emmett14) which have resulted in the extraction of different numbers of components (between three and five). Of course, in all these studies there are some similarities in extracted dietary patterns. Northstone and Emmett described one component as ‘junk’-type foods, characterized by the consumption of foods with high fat and sugar content, processed and convenience foods, and another component as a ‘health-conscious’ pattern, associated with consumption of vegetables, rice, pasta, salad and fruit(Reference Northstone and Emmett9). Aranceta et al. named the first component derived by their data as a ‘snacking’ pattern, consisting of more frequent and higher consumption of bakery products, sweets, salted snacks and soft drinks, and the third as a ‘healthy’ pattern since it was characterized by vegetables, fruits and fish intake(Reference Aranceta, Perez-Rodrigo, Ribas and Serra-Majem11). Finally, North and Emmett reported that the second component derived by their data was associated with high consumption of foods considered healthy (vegetables, fruit, etc.) and the fourth component was characterized by high loadings for snack and finger foods(Reference North and Emmett14). These results are in concordance with our findings, as mentioned above.
The current findings revealed that ‘junk food’ and ‘vegetarian/healthy’ patterns are strongly associated with hours spent watching television. In particular, a positive correlation with the former and a negative association with the latter pattern were detected. This finding is in accordance with those reported by previous published studies(Reference Aranceta, Perez-Rodrigo, Ribas and Serra-Majem11, Reference Lowry, Wechsler, Galuska, Fulton and Kann27, Reference Vereecken, Todd, Roberts, Mulvihill and Maes28). This could be attributed first to the fact that it is common for people and especially for young people to eat sweets, salty snacks and drink soft drinks while they are watching television and, second, to the food advertisements to which they are exposed during viewing. Studies with children have demonstrated that longer television viewing is associated with a higher consumption of advertised foods and drinks, usually being fast foods, snacks and soft drinks(Reference Kennedy29, Reference Taras, Sallis, Patterson, Nader and Nelson30). Moreover, fast food consumption and watching television might be positively correlated because of the shorter preparation time of fast foods.
In addition, it was revealed that the daily hours of study is a significant determinant of adolescents’ dietary behaviour. This relationship has never been reported previously. It was found that adolescents spending more time studying are more likely to follow a healthy dietary pattern, while those studying for a shorter time are more likely to adopt a ‘junk food’ pattern. Longer time of study could be an indicator of higher devotion to knowledge, higher needs for answering scientific questions and may reflect a higher educational status, especially in our country. Therefore, these adolescents may be more likely to have better knowledge about the increased importance of a healthy diet for the prevention of several chronic diseases.
Furthermore, it was found that adolescents who had sports activities outside school are more likely to follow the pattern characterized as the ‘healthy/vegetarian’ pattern and smokers are more likely to adopt the unhealthy dietary pattern. These results confirm those reported previously(Reference Neumark-Sztainer, Story, Toporoff, Himes, Resnick and Blum31). Also, a recent study conducted among young Spanish people reported an association between a higher level of physical activity and adherence to a healthier dietary pattern named as the ‘Spanish-Mediterranean’ diet(Reference Sanchez-Villegas, Delgado-Rodriguez, Martinez-Gonzalez and De Irala-Estevez32). Additionally, older adolescents were more likely to adopt a ‘junk food’ pattern. This could be partially attributed to the fact that as children move into adolescence they become more independent and eat more often away from home. Moreover, the need for peer acceptance and their busy schedule may affect their food choices and their eating behaviour.
Finally, no association was observed between adolescents’ dietary behaviour and the socio-economic status indicators evaluated in the present study. Observational studies conducted in adult populations after the middle of the 20th century reported an increased prevalence of cardiovascular and other metabolic risk factors, such as hypertension, dyslipidaemia and obesity, among the lower socio-economic groups(Reference Irala-Estevez, Groth, Jahansson, Oltersdof, Prattala and Martinez-Gonzalez33–Reference Panagiotakos, Pitsavos, Chrysohoou, Skoumas, Toutouza, Blegrinnos, Toutouzas and Stefanadis36). It has been suggested that dietary choices, together with other unhealthy behaviours, may be one of the factors mediating the relationship between socio-economic class and human health(Reference López-Azpiazu, Sánchez-Villegas, Johansson, Petkeviciene and Prättälä37, Reference Panagiotakos, Pitsavos, Chrysohoou, Vlismas, Skoumas, Palliou and Stefanadis38) and may partly explain the shift in the social class distribution of CVD (from the upper to the lower) that occurred during the 1950s and 1960s(Reference Marmot, Adelstein and Robinson39). However, in the current study no such association was observed. A potential explanation, and limitation, is that there is no established index for socio-economic status assessment in Greece. Therefore, only a few indicators, such as the number of cars owned by the family, were used in order to assess the family’s social status indirectly. This fact may account for the lack of association between dietary patterns and socio-economic status of our adolescents.
The present study, with a cross-sectional design, has several limitations. The presented findings may be valuable only for stating hypotheses and not for assessing causal relationships. Moreover, the dietary assessment was performed once, thus it cannot reflect seasonal variations. Furthermore, there is an increased risk for diet misreporting and this bias may affect the findings. The Vyronas area does not represent the whole region or the entire country; nevertheless, it still reflects the ‘common’ Greek adolescent. The principal components method itself also has some limitations that stem from several subjective decisions which have to be made in deciding the ‘nature’ of components that have been extracted.
In the present work it was revealed that unhealthy food habits among adolescents are correlated with overall unhealthy lifestyle behaviour, since smokers and those spending much time watching television/playing electronic games seem to be more likely to adopt a ‘junk food’ pattern. Also, the current results highlight that adolescents studying for few hours are more likely to be adherent to an unhealthy dietary pattern, while no significant association was detected between dietary patterns and family’s socio-economic status. Therefore, these groups of adolescents (smokers, those with a sedentary lifestyle and those studying for few hours) are at higher risk for developing obesity and other metabolic disorders, since they are more possible to adopt unhealthy dietary behaviours. As a consequence, school- or community-based interventions should be conducted promoting the necessity of adherence to a healthier dietary behaviour and an overall healthier lifestyle.
Acknowledgements
The authors would like to thank all adolescents who participated in this study and the field investigators who performed all data collection: V. Gizlis, E. Konstantinou, M. Papathanasiou, P. Daskalakis, K. Kintzolakis, C. Spentzos and Y. Lentzas.
Author contributions: G.K. performed the data analysis and wrote the paper; D.B.P. designed the study, supervised the data analysis and wrote the paper; K. Mihas, A.A. and K. Marayiannis participated in the design of the study and drafted the paper; A.M. and Y.T. participated in the design of the study and critically reviewed the paper.
Conflict of interest declaration: No conflict of interest exists.


