

Voter turnout varies widely across countries. How much of that variation can be explained by differences in the electoral system? What is the causal effect of the electoral system on voter turnout? Do citizens participate more when they are allowed to decide which individual candidates get elected (open list (OL) systems), than in elections where they vote for a party-list (closed list (CL) systems)? These questions have attracted the attention of economists and political scientists for a long time (see Blais Reference Blais2006; Blais and Aarts Reference Blais and Dobrzynska2006; Geys Reference Geys2006 for reviews of the literature).
There are two main characteristics of electoral systems: the degree of proportionality, determined mainly by the electoral formula and the district magnitude, and the ballot structure (OL versus CL). While the literature has extensively studied the former and generally agreed that more proportionality increases voter turnout (see, e.g., Jackman and Miller Reference Jackman and Miller1995; Schram and Sonnemans Reference Schram and Sonnemans1996; Blais and Dobrzynska Reference Blais and Aarts1998; Ladner and Milner Reference Ladner and Milner1999; Bowler, Donovan and Brockington Reference Bowler, Brockington and Donovan2003; Fornos, Power and Garand Reference Fornos, Power and Garand2004; Milner and Ladner Reference Milner and Ladner2006; Selb Reference Shugart, Valdini and Suominen2009; St-Vincent Reference St-Vincent2013), little is known about the effects of the ballot structure.Footnote 1 This is unfortunate, as changes between closed and OLs have been debated in several countries.Footnote 2 Understanding their influence on voter turnout is crucial to enlighten that debate and to the design of electoral systems.
Previous empirical evidence on this issue is mostly based on cross-country regressions, where small sample sizes and the endogeneity of electoral rules raise concerns about the causal interpretation of the estimates, as it is difficult to isolate the effect of the voting systems from other economic, cultural or institutional variables that may also affect voter turnout.Footnote 3 To the best of my knowledge, this is the first paper to use a quasi-experimental design to estimate how OL systems affect voter turnout. I focus on a previously unexplored setting in which electoral systems are exogenously assigned. In Spain, municipalities with >250 inhabitants elect a city council by CL proportional representation while municipalities with 250 or fewer inhabitants elect a city council in a plurality-at-large, OL election, in which voters can vote for up to four individual candidates from the same or different party-lists. While the two systems differ in both proportionality and ballot structure (OL versus CL), in the Results section I show that the difference in proportionality is small and provide evidence that the effect on turnout is driven by the difference in the ballot structure.
The institutional framework of Spanish local elections is a unique opportunity to study the causal effect of the electoral system on voter turnout for several reasons. First, the electoral system a municipality has to follow is determined by a national law as a function of the population size of the municipality, which reduces endogeneity concerns. Second, the number of observations is very high (around 72,000), as there are >8000 municipalities in Spain and election results by municipality are available for nine election years. Furthermore, there are many municipalities with a population size close to the population threshold that separates the two electoral systems (around 700 municipalities in a window of 50 inhabitants around the threshold). Third, all the municipalities under any of the electoral systems follow the exact same electoral system. This is in opposition to cross-country studies, where it is inevitable to pool into the same electoral system a set of systems that are only somewhat similar. Fourth, unlike what is often the case in situations where a policy changes at a municipal population threshold (Campa Reference Campa2012; Grembi, Nannicini and Troiano Reference Grembi, Nannicini and Troiano2012; Eggers Reference Egger and Koethenbuerger2015), no other rule changes at the threshold. Therefore, we can be confident in attributing the differences in outcomes between municipalities at each side of the threshold to the electoral system and not to some other regulation.
To carry out the analysis, I have collected a rich data set with results from all elections held in Spain since the restoration of democracy in 1977. Combining regression discontinuity design and fixed effects estimation, I find that the OL system increases voter turnout with respect to the CL system by between 1 and 2 percentage points. There are many channels that may be conducive to these results—for example, rational-choice calculations about the pivotality of votes or perceived fairness of the systems. I provide evidence that the differences in turnout are at least partially driven by the number of parties that enter competition. A higher number of parties in competition may in turn affect voter turnout by increased aggregate mobilization efforts and by providing voters with a more compelling set of options. I find that the OL system increases by 0.35 the average number of lists in competition. This effect is most likely driven by the fact that the OL system makes it much easier for popular candidates from small parties to get elected, as voters can choose individual candidates from the same or different party-lists.
An issue that requires special attention is that there exists some evidence that municipalities may be able to partially control their population size, as some sorting is observed around the threshold. I carefully study this question in the Robustness section, assessing the validity of the empirical strategy and checking the robustness of the results to donut regression discontinuity design estimation in the spirit of Barreca et al. (Reference Barreca, Guldi, Lindo and Waddell2011), by dropping observations within a window where the sorting is most likely to occur.
The rest of the paper is organized as follows. The next section reviews the literature on the impact of electoral systems on voter turnout, analyzing both theoretical predictions and the available empirical evidence. The third section provides background on the Spanish electoral systems. The data and empirical strategy are laid out in the fourth section. The fifth section presents the main results and looks into the mechanisms at work. The robustness of the results is analyzed in the penultimate section. The final section concludes.
Literature Review
This paper contributes to the literature that tries to explain voter turnout (see, e.g., Downs Reference Downs1957; Riker and Ordeshook Reference Riker and Ordeshook1968) and, in particular, to the literature that studies the link between the electoral system and voter turnout. The electoral systems that I compare in this paper differ mainly in their ballot structure. In this section, I review the theoretical arguments and the previous empirical evidence on the effect of the ballot structure on voter turnout.
In some elections, voters can express a preference for candidates within the party-lists (OL systems), while in others they are limited to choose between different lists (CL systems). There are opposing views in the literature about how the use of OL versus CL systems should affect voter turnout.
On the one hand, it has been argued that OL systems should increase turnout. Mattila (Reference Mattila2003) argues that as voters can choose the candidate they wish to vote for, they are likely to feel more satisfied with the act of voting. Along the same lines, Karvonen (Reference Karvonen2004) indicates that voting for individual candidates makes the election more personal and concrete, and that both elements should provide a stimulus for active electoral participation. Supporting this hypothesis, Hix and Hagemann (Reference Hix and Hagemann2009) find that citizens in EU states who use OL are almost 5 percent more likely to be contacted by candidates or parties than citizens in member states with CL systems. They are also >20 percent more likely to be contacted by candidates or parties and about 15 percent more likely to feel well informed about the elections than citizens in states with CL systems.
On the other hand, Robbins (Reference Robbins2010) hypothesizes that turnout should be higher in CL systems. His argument is that in OL systems parties may not exert the same level of resources to solicit support or mobilize voters as in CL systems. Individual candidates, for their part, will appeal to their supporters but will likely avoid mobilization strategies that involve the entire population. In CL systems, on the contrary, “parties place greater emphasis on mobilizing voters everywhere in hopes of soliciting additional support. After all, if they construct the list, then they are responsible for the success of their candidates and will devote more time, energy and resources calling individuals to the polls.”
The empirical evidence for the effect of the ballot structure is scarce, probably due to limited cross-country variation. Hix and Hagemann (Reference Hix and Hagemann2009) find that voters are almost 10 percent more likely to cast their votes on election day in OL systems. Robbins (Reference Robbins2010), on the contrary, finds that OL decreases turnout levels. Mattila’s (Reference Mattila2003) empirical findings, with data from elections to the European Parliament, show that a variable indicating a CL system is not significant. The empirical analyses in Blais and Aarts (Reference Blais and Dobrzynska2006), Dos Santos (Reference Dos Santos2007) and Karvonen (Reference Karvonen2004) also conclude that there is not sufficient evidence to support the hypothesis of a positive correlation between preferential voting and electoral participation. Eggers (Reference Egger and Koethenbuerger2015) uses a discontinuity in the electoral rules of French local elections and finds that a CL proportional representation system leads to more turnout than an OL plurality system, but he attributes the effect to the different proportionality of the systems. In sum, the empirical evidence is non-conclusive: the effect of the ballot structure on turnout is still an open question.
Finally, another strand of literature has studied the effects of OL systems on other outcomes.Footnote 4 Farrell and McAllister (Reference Farrell and McAllister2006) find that preferential voting systems where voters are given more freedom in completing the ballot paper lead to higher satisfaction with democracy. Other papers have found that OL systems increase the value of personal reputation with respect to party reputation by enhancing intra-party competition and electoral uncertainty (Carey and Shugart Reference Carey and Shugart1995; Chang Reference Chang2005) or by inducing voters to focus more on candidates’ characteristics and less on parties’ positions (Shugart, Valdini and Suominen Reference Selb2005). Ames (Ames Reference Ames1995a; Ames Reference Ames1995b) studies the use of OL elections in Brazil and supports these conclusions by highlighting the very weak role played by national parties in the country. Persson, Tabellini and Trebbi (Reference Persson, Tabellini and Trebbi2003) find that OL systems reduce corruption, while Chang and Golden (Reference Chang and Golden2007) find the opposite effect. Negri (Reference Negri2014) develops a theoretical model and predicts that, in general, CL proportional representation is associated to lower minority representation within Parliaments than OL systems.
Spanish Electoral Systems
Spain is politically decentralized in 17 regions and >8000 municipalities. Each municipality elects a local government in free elections. A national law requires local governments to provide a variety of services, including public lighting, waste collection, cemeteries, street cleaning and road pavement (see Table 1 for a comprehensive list). In addition, municipalities are allowed to provide any other service that they consider useful to the municipality. For example, it is common that they provide touristic information to visitors and organize local festivities. Municipalities can levy a number of taxes and charges (most importantly, a property tax) and receive transfers from regional and national governments to finance some of their expenditures. Approximately 55 percent of their revenues come from the taxes imposed by themselves (Sweeting Reference Sweeting2009).
Table 1 Services of Spanish Municipalities by Population
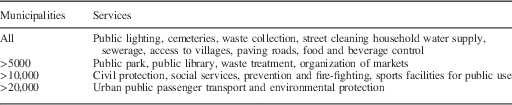
Source: Law 5/1985 and Campa (Reference Campa2012)
Note: the table shows the services that Spanish municipalities are required to provide, as a function of population size.
Local elections are held simultaneously in all municipalities in Spain every fourth year.Footnote 5 The elections follow one of three electoral systems, depending upon the population size of the municipality.
Municipalities with >250 inhabitants use a CL proportional representation system.Footnote 6 They elect a city council in a single district, CL election, where each party presents a list of candidates and citizens can vote for one of the party-lists. The size of the council increases with population at certain population cutoffs but all municipalities in the CL system used for identification elect a seven-member council (as the empirical strategy relies on municipalities close to the threshold). The conversion from votes to seats is done according to the D’Hondt rule.Footnote 7 The council elects a mayor among its members and is entitled to approve the budget, decide on expenditure in various fields, control the governing bodies and to the roll-call vote of confidence on the mayor. The mayor chairs the meetings of the council, casts the decisive vote in the event of a tie, decides on some expenditures, heads the local police and appoints mayoral deputies and cabinet members, among other responsibilities.
Municipalities with a population between 100 and 250 inhabitants follow an OL, plurality-at-large system. Under this system, a council of five members is elected. Political parties can present candidate lists of up to five candidates and voters can vote for up to four candidates from the same or different party-lists. The five most voted candidates are elected members of the council.Footnote 8 As in the CL system, the council elects a mayor among its members and the responsibilities of the council and mayor are identical under the two systems.
Finally, municipalities with <100 inhabitants directly elect a mayor in a simple plurality, first-past-the-post (FPTP) election, that is, each political party can present one candidate and the most voted candidate is elected mayor. These municipalities follow a direct democracy system in which the role of the council is played by open meetings that any citizen in the municipality can attend.Footnote 9
The paper focuses on the 250-inhabitant threshold and compares voter turnout under the CL and OL systems, as only the electoral system changes at that threshold. The results for the 100-inhabitant threshold are discussed in the Results section.
The CL and OL systems differ in two main dimensions. First, the electoral formula differs as under the OL system seats are allocated by plurality to the most voted individual candidates, while under CL they are allocated to parties according to the D’Hondt rule. Both the change in the electoral formula and the increase in the council size (from five to seven members) imply that the CL is a more proportional system at the party level. Second, the two systems differ on the ballot structure: while the CL system is a CL system where competition is limited to across-parties competition, the OL system allows voters to express their preferences for individual candidates, making it easier for popular candidates from small parties to get a seat in the council and introducing competition both across and within parties. In the Results section, I provide evidence that the difference in proportionality is small in practice, and that it is the difference in ballot structure what drives the results, with OLs increasing voter turnout.
Empirical Strategy and Data
Empirical Strategy
To estimate the effect of the electoral system on voter turnout, I combine regression discontinuity and fixed-effects estimation. In particular, I consider the following estimating equation:
 $$y_{{mt}} =\alpha _{m} {\plus}\gamma _{t} {\plus}\beta D_{{mt}} {\plus}f(x_{{mt}} {\minus}x^{{\asterisk}} ){\plus}u_{{mt}} ,$$
where y mt is the outcome of interest (in the main specifications, voter turnout), D mt a treatment dummy that captures the electoral system municipality m is required to follow in election-year t, x mt the assignment variable (log population the year before the elections),Footnote 10 x* the log of the population threshold (250 inhabitants), so that treatment status depends on whether x mt is bigger or smaller than x*, f a smooth function of the assignment variable, α m a municipality fixed effect, γ t a year fixed effect and u mt an error term. The parameter of interest is β.Footnote 11
To estimate f, I use non-parametric estimation (local linear regression). A key ingredient to this approach is the bandwidth. There is a trade-off between precision and bias: a bigger bandwidth increases precision at the cost of more bias. I choose a baseline bandwidth according to the procedure suggested by Imbens and Kalyanaraman (Reference Imbens and Kalyanaraman2012) and provide the results at different fractions of that bandwidth to see how sensitive the results are to bandwidth choice. Notice that we may not want the bandwidth to be bigger than 150 inhabitants (remember that municipalities with <100 inhabitants follow a different system), as if that happened we would be mixing outcomes from the three electoral systems in the same specification. For that reason, I restrict the analysis to bandwidths of <150 inhabitants. I use a rectangular kernel, as recommended by Imbens and Lemieux (Reference Imbens and Lemieux2008) and Lee and Lemieux (Reference Lee and Lemieux2010). This is equivalent to estimating standard linear regressions over the interval of the selected bandwidth on both sides of the cut-off point. I cluster the standard errors at the municipality level.
A possible cause of concern in a pure regression discontinuity framework would be that a discontinuity in the density of population size is observed at the threshold (Lee and Lemieux Reference Lee and Lemieux2010) (see Figure 1).Footnote 12 To deal with that issue, I add municipality and year fixed effects to the basic regression discontinuity framework. The identification assumption is that there are no unobservable factors that may simultaneously affect voter turnout and whether a municipality’s population is just above or just below the threshold, conditional on municipality and year fixed effects. The identification therefore relies on switchers: intuitively, the regressions do not compare municipalities just above and just below the threshold but municipalities that switch from one system to another with those that remain in the same system.Footnote 13 If the factors that make municipalities sort around the threshold are time invariant, β will identify the average treatment effect of the electoral system on voter turnout for municipalities close to the threshold.Footnote 14

Fig. 1 Histogram of population size
Although the identification assumption is fundamentally untestable, in the Robustness section I present three sets of tests to address the validity of the strategy. First, I test whether municipalities at each side of the threshold differ, conditional on the fixed effects, in other variables that may themselves affect the outcomes of interest. Second, I estimate a dynamic model to test for pretrends: in particular, I study whether this period’s electoral system has an effect on previous period’s turnout. Third, I consider donut regressions to examine the robustness of the results to the exclusion of some observations where any problem of self-selection that might remain after the inclusion of the fixed effects is likely to be concentrated.
Another issue that requires some consideration is that local elections are held on the same day as regional elections in 13 of the 17 Spanish regions. In 1999, local elections also coincided with elections to the European Parliament. This can be analyzed as a measurement error issue. Observed turnout t
mt
, is measured with error as it differs from the “true” turnout $t_{{mt}}^{{\asterisk}} $
, which is the turnout that would have been observed if local elections had been the only elections on election day. Let the error be
$t_{{mt}}^{{\asterisk}} $
, which is the turnout that would have been observed if local elections had been the only elections on election day. Let the error be $e_{{mt}} =t_{{mt}} {\minus}t_{{mt}}^{{\asterisk}} $
. If (1) captures the true relationship between the outcome and independent variables, then
$e_{{mt}} =t_{{mt}} {\minus}t_{{mt}}^{{\asterisk}} $
. If (1) captures the true relationship between the outcome and independent variables, then $y_{{mt}} =t_{{mt}}^{{\asterisk}} $
.
$y_{{mt}} =t_{{mt}}^{{\asterisk}} $
.
Thus, the estimated model is
 $$t_{{mt}} =\alpha _{m} {\plus}\gamma _{t} {\plus}\beta D_{{mt}} {\plus}f(x_{{mt}} {\minus}x^{{\asterisk}} ){\plus}u_{{mt}} {\plus}e_{{mt}} .$$
If the new error term u mt +e mt is uncorrelated with the regressors, the estimators will be unbiased and consistent. Thus, if e mt is not correlated with the electoral system (and there is no reason to think it is, because the population threshold does not play any role in regional or European elections), measurement error will not affect the unbiasedness and consistency of the estimators.Footnote 15
Data
I have collected data from all local elections that have taken place in Spain since the restoration of democracy after General Franco’s death in 1975. In this period, local elections have been held in nine years (1979, 1983, 1987, 1991, 1995, 1999, 2003, 2007, 2011) in all municipalities in the country (around 8000).Footnote 16 In addition to the data from local elections, I have collected data at the municipality level from all national Congress elections in that period.Footnote 17 These data will be used in the Robustness section to analyze the validity of the identification strategy. All data are from the National Statistics Institute (INE) and are publicly available.
Table 2 presents summary statistics for the variables used in the paper. The main outcome of interest is Turnout, defined as the number of votes cast divided by the electoral census. That is, Turnout measures the proportion of citizens that cast a vote over the set of potential voters (the electoral census). There is no voter registration in Spain: potential voters are all citizens from Spain, EU countries and countries under Reciprocity Treaties, older than 18 and not disenfranchised by court order.Footnote 18 The other outcome variable of interest is Lists, defined as the number of party-lists that run for election.
Table 2 Summary Statistics

Note: the first panel shows summary statistics for all municipalities. The second panel shows summary statistics for municipalities under the open list (OL) system. The third panel, for those under the closed list (CL) system and<400 inhabitants, which is the biggest bandwidth in the regressions.
I consider six variables from Congress elections: the percent of voter turnout (N turnout), defined analogously to the one for local elections, the percent of blank (N blank) and spoilt (N spoilt) votes, defined as the number of blank and spoilt votes divided by the number of votes cast, and the share of votes for the three main parties in Spain: the right-wing Popular Party (N right), the left-wing Socialist Party (N left) and the far-left United Left (N far left),Footnote 19 defined as the votes for these parties divided by the number of valid votes.Footnote 20
Results
Main Results
Table 3 presents the main estimates of the impact of the electoral system on voter turnout. The table shows the results of estimating Equation (1) by local linear regression, using Turnout as the dependent variable. The treatment variable is OL, which takes the value of 1 if the municipality follows the OL system and 0 if it follows the CL system. The coefficient on OL therefore captures the effect on turnout of using the OL system in relation to the CL system, that is, it measures the effect on turnout of crossing the threshold from right to left.
Table 3 Effect of Ballot Structure on Voter Turnout: Open Versus Closed Lists
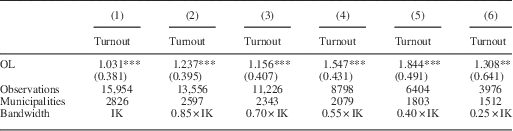
Note: standard errors clustered by municipality in parentheses. All regressions include municipality and year fixed effects. IK refers to the minimum of Imbens and Kalyanaraman’s (Reference Imbens and Kalyanaraman2012) bandwidth and 250 inhabitants.
OL=open list system.
*p<0.10, **p<0.05, ***p<0.01.
Column (1) provides the estimated effect based on the preferred specification, which uses the bandwidth suggested by Imbens and Lemieux (Reference Imbens and Lemieux2008). Under that specification, the OL system increases turnout in relation to the CL system by 1 percentage point, and the effect is statistically significant at the 1 percent level. The rest of the columns show the results for different fractions of that bandwidth. The effect is statistically significant and quantitatively similar across bandwidths, ranging from 1 to 2 percentage points, suggesting that the effect is not driven by the choice of the bandwidth. In conclusion, the results imply that the OL system leads to more voter turnout than the CL system.
Additional Results: Mechanism
The OL and CL systems differ in two main dimensions. First, the electoral formula differs as under the OL system seats are allocated by plurality to the most voted individual candidates, while under the CL system they are allocated to parties according to the D’Hondt rule. Both the change in the electoral formula and the increase in the council size (from five to seven members) imply that the CL is a more proportional system at the party level. Second, the two systems differ on the ballot structure: while the CL system is a CL system where competition is limited to competition across political parties, the OL system allows voters to express their preferences for individual candidates, introducing competition both across and within parties. In this section, I provide evidence that the ballot structure difference is more relevant and the one that drives the results.
First, although the CL system is formally a proportional representation system, in practice it is only slightly more proportional than the OL system. Under the OL system, only in 3.5 percent of the elections the most voted party does not get an absolute majority (3/5 or more) of the seats (and therefore most of the political power, including the possibility of appointing the mayor).Footnote 21 But the cases in which no party has an absolute majority of seats in the council are also rare under the CL system, around 7 percent of the elections. That is because the number of seats is small (seven) and the D’Hondt rule is used, which favors the most voted parties when the district size is small.
Second, I study whether the electoral system also has an effect on the number of party-lists running in the election. Panel A of Table 4 shows that the OL system increases the number of lists by around 0.35, which suggests that at least part of the change in voter turnout might be driven by entry decisions of candidates. A higher number of parties in competition may in turn affect voter turnout by increased aggregate mobilization efforts and by providing voters with a more compelling set of options.Footnote 22
Table 4 Effect of Ballot Structure on Number of Party-Lists and on Voter Turnout When Controlling for Party-Lists

Note: standard errors clustered by municipality in parentheses. All regressions include municipality and year fixed effects. IK refers to the minimum of Imbens and Kalyanaraman’s (Reference Imbens and Kalyanaraman2012) bandwidth and 250 inhabitants.
OL=open list system.
*p<0.10, **p<0.05, ***p<0.01.
Panel B of Table 4 shows the results for voter turnout after a control for the number of lists is included in the main regression. The coefficient on Lists indicates that one more party running in the election increases turnout by around 6 percentage points. But the more interesting result is that the estimated effect of the electoral system reverses when the control for the number of lists is introduced: conditional on the number of lists, turnout is higher under the CL system. Of course, this does not mean that the causal effect is actually positive. The number of lists is an endogenous or “bad” control in a regression whose goal is to find the true causal effect, as it is also an outcome of the electoral system (see Angrist and Pischke Reference Angrist and Pischke2008 on bad controls). However, this exercise reinforces the argument that the reason why the OL system leads to more turnout than the CL system is that it encourages more parties to enter competition.
It is hard to explain the difference in number of parties as being driven by the different proportionality of the systems: if voters care only about party-level competition, the CL system makes it easier for small parties to get some representation so we should expect more parties to run under the CL system.Footnote 23 The change in the number of parties is most likely driven by the different ballot structure of the systems, as the OL system makes it easier for individual candidates in small parties to get elected to the council. For example, assume there are three main parties A, B and C, and a small party D that has a very popular leader, and that voters care both about parties and individual candidates. Suppose that if voters can only vote for one party-list, as in the CL system, most individuals prefer to vote for parties A, B and C, so these three parties share the seven seats. That is, although D has a very popular leader, most voters prefer to vote for their preferred parties A, B and C if they can only vote for one party-list. In this scenario, party D will not enter competition if there is a cost of running. On the other hand, under the OL system, voters are allowed to vote for four individual candidates, from the same or different party-lists. Thus, voters could give three of their votes for candidates of their preferred party and one vote for the leader of party D. Under this system, party D will enter competition if the benefit of getting a seat is bigger than the cost of running. This argument suggests that the ballot structure of the OL system, which allows voters to choose among candidates from different party-lists, should lead to more parties in competition.
Third, I compare the OL system with a third electoral system, exploiting a discontinuity in electoral systems at a different threshold: municipalities with 100 or more inhabitants (but with not >250) follow the OL system, while those with <100 inhabitants elect a mayor in a FPTP election, that is, each political party can present one candidate and the most voted candidate is elected mayor. These municipalities follow a direct democracy system in which the role of the council is played by open meetings that any citizen in the municipality can attend.Footnote 24 Although the estimates for this threshold should be interpreted with caution, as in the 100-inhabitant threshold there is a change in the government system in addition to the change in the electoral system, the evidence presented here reinforces some of the conclusions drawn from the main results from the 250-inhabitant threshold. In particular, if it is the ballot structure and not the proportionality of the systems what drives the increased turnout under the OL with respect to the CL system, we would also expect that effect to be present when we compare the OL system with FPTP, as these two systems also differ on the ballot structure but are both plurality (and not proportional representation) systems.
To study turnout at this threshold, I follow the same empirical strategy described in the previous section. The treatment variable is (slightly abusing notation) again OL, which takes the value of 1 if the municipality follows the OL system and 0 if it follows the FPTP system. The results in Panel A of Table 5 show that the OL system increases voter turnout by between 2 and 3 percentage points with respect to FPTP.Footnote 25 It also increases the number of lists in competition, although by a modest amount (0.1) (Panel B). Therefore, the results from this threshold go in the same direction as those obtained from the main threshold: not only does the OL system lead to more turnout and more lists in competition than the CL system, but the OL system also produces the same effects when we compare it with FPTP.Footnote 26
Table 5 Effect of Ballot Structure on Voter Turnout and Party-Lists: Open List Versus FPTP (100-inhabitant threshold)

Note: standard errors clustered by municipality in parentheses. All regressions include municipality and year fixed effects. IK refers to the minimum of Imbens and Kalyanaraman’s (Reference Imbens and Kalyanaraman2012) bandwidth and 250 inhabitants.
OL=open list system.
*p<0.10, **p<0.05, ***p<0.01.
Robustness
As explained in the Empirical Strategy and Data section, a discontinuity in the density of population sizes is observed at the threshold. In the first part of this section, I review how that discontinuity arises. In the subsequent parts of the section I present three sets of robustness checks to assess the validity of the empirical strategy.
Sorting Around the Threshold: Process
The official population size of a municipality is given by the number of citizens who are registered in the municipal register (padrón municipal). Municipalities keep track of all the variations in the population (births, deaths, registrations and unregistrations) in the public register and report periodically the data to the INE. The INE validates the information it receives, checking that there is no fraud—for example, it makes sure that for every sign-in in a municipality there is a corresponding sign-out in another—and yearly makes the final population figures public. Given the mechanics of the process, it is hard to believe that there is outright manipulation of the population figures. Instead, the discontinuity at the threshold arises because individuals that have dwellings in more than one municipality can in practice decide in which of them to register.Footnote 27 In particular, the mayor or other local politicians may be interested in the electoral system that the municipality follows and may make an effort to persuade some individuals to register in the municipality so that it keeps the preferred electoral system.Footnote 28 Therefore, some individuals that would have registered in another municipality if there was no change of rules at the threshold, decide to register in the municipality.
Although the identification assumption is fundamentally untestable, I now present three sets of tests to assess the validity of the strategy. First, I test whether municipalities at each side of the threshold differ, conditional on the fixed effects, in other variables that may themselves affect the outcomes of interest. Second, I estimate a dynamic model to test for pretrends: in particular, I study whether this period’s electoral system has an effect on previous period’s turnout. Third, I consider donut regressions to examine the robustness of the results to the exclusion of some observations where any problem of self-selection that might remain after the inclusion of the fixed effects is likely to be concentrated.
Placebo Tests: Covariates at the Thresholds
The identification strategy requires municipalities that municipalities that switch into the OL system be comparable with those that stay in the same system and with those that switch out of the OL system. In other words, municipalities just above and just below the threshold should not differ, conditional on the fixed effects, in other variables that may themselves have an effect on voter turnout. Here, I use national Congress election variables and test whether they change at the thresholds by including them as dependent variables in Equation (1).Footnote 29 These covariates are especially suited to this context because if municipalities differ in some unobservable factors that affect voter turnout at local elections, it is likely that those unobservable variable affect turnout at national elections too. Furthermore, Congress elections are the most important elections in Spain and turnout is typically very high (78 percent in the average municipality during the sample period) so they are likely to capture any political differences across municipalities.Footnote 30
As pointed out by Lee and Lemieux (Reference Lee and Lemieux2010), it is important that the covariates are determined before the present period’s realization of the running and treatment variables if they can be affected by treatment.Footnote 31 I merge local elections data with data from the most recent previous Congress elections at the municipality level.Footnote 32 I consider the percent of voter turnout in (N turnout), blank (N blank) and spoilt votes (N spoilt) in Congress elections and the percent of votes for the three main parties in Spain (N right, N left and N far left).Footnote 33 If the empirical strategy is valid, there should be no effect of the electoral system on these variables.
The results from these tests are shown in Table 6. Among the six variables considered, only in one (the share of spoilt votes) there seems to be some difference between municipalities, but the effect is quantitatively small and only significant in some specifications. Overall, the results suggest that, conditional on the fixed effects, municipalities just above and just below the threshold do not differ systematically along these variables: while municipalities operating under open and CLs behave differently in local elections, they do not do so in national elections.
Table 6 Placebo Tests: Covariates at the Threshold

Note: standard errors clustered by municipality in parentheses. All regressions include municipality and year fixed effects. IK refers to the minimum of Imbens and Kalyanaraman’s (Reference Imbens and Kalyanaraman2012) bandwidth and 250 inhabitants.
OL=open list system.
*p<0.10, **p<0.05, ***p<0.01.
Pretrends in the Outcomes of Interest
The longitudinal structure of the data can be used to estimate dynamic causal effects. This subsection studies the timing of the effect of the electoral system on the outcomes of interest by estimating the following model:
 $$y_{{mt}} =\alpha _{m} {\plus}\gamma _{t} {\plus}\beta _{1} D_{{mt}} {\plus}\beta _{2} D_{{m,t{\plus}1}} {\plus}f_{1} (x_{{mt}} {\minus}x^{{\asterisk}} ){\plus}f_{2} (x_{{m,t{\plus}1}} {\minus}x^{{\asterisk}} ){\plus}u_{{mt}} .$$
If, conditional on the fixed effects, next period’s electoral system is as good as random for those municipalities sufficiently close to the threshold, next period’s electoral system should not help predict this period’s outcome variable.Footnote 34 Thus, the coefficient β 2 serves as a robustness check: β 2≠0 would suggest an endogeneity problem that may raise concerns about the validity of the approach of the paper. Alternatively, we can think of (3) as testing whether treatment and control municipalities were on different trends before the realization of this period’s variables.Footnote 35
Table 7 shows the results. The estimates for β 2 are not statistically significant for Turnout. For some bandwidth choices, the coefficients for Lists are significant but they are small and have the opposite sign to the contemporaneous effect, suggesting that, if there is any difference, OL municipalities had fewer lists in the previous election. Moreover, β 1, the contemporaneous effect of the electoral system on the outcomes, remains similar to the one obtained in the baseline specifications, for the three outcome variables. That implies that previous trends in the outcome variables are not driving the results.
Table 7 Robustness: Testing for Pretrends in the Outcomes of Interest

Note: standard errors clustered by municipality in parentheses. All regressions include municipality and year fixed effects. IK refers to the minimum of Imbens and Kalyanaraman’s (Reference Imbens and Kalyanaraman2012) bandwidth and 250 inhabitants.
OL=open list system.
*p<0.10, **p<0.05, ***p<0.01.
Donut Regressions
This subsection considers donut regressions in the spirit of Barreca et al. (Reference Barreca, Guldi, Lindo and Waddell2011). The idea of this technique is to exclude observations very close to the thresholds, where sorting is more likely to occur. Given the nature of the sorting process of Spanish municipalities, it is likely that the sorting of municipalities is limited to a small window around the threshold: as the discontinuity in the density appears not because of outright manipulation of the population data, but as a consequence of registration decisions of citizens, it does not seem plausible that the population size of municipalities that are self-selecting into treatment is much bigger than what is strictly necessary to be above the threshold, or that municipalities with a population size far below the threshold attempt to cross it. Thus, finding a similar effect after municipalities close to the threshold are excluded would reinforce the credibility of the estimates.
For each outcome variable and bandwidth choice, I consider four specifications. The first one is the benchmark regression, in which no observations are excluded. The second excludes observations within a window of six inhabitants around the threshold (three at each side of the threshold), the third excludes those within an interval of ten inhabitants and the fourth those within an interval of 20 inhabitants.
The results (see Table 8) show that excluding observations very close to the threshold does not affect the results, as they are remarkably similar in magnitude to the ones obtained in the baseline specifications. For voter turnout, the results are significant when up to ten inhabitants around the threshold are excluded.Footnote 36 For a bandwidth of half that length, the results are significant even when municipalities with a population within a 20 inhabitants around the threshold are excluded. For the number of lists, the coefficients remain significant across all specifications. These results suggest that the findings of the paper are not being driven by municipalities of which concerns about self-selection could still persist.
Table 8 Robustness: Donut Regressions

Note: standard errors clustered by municipality in parentheses. All regressions include municipality and year fixed effects. IK refers to the minimum of Imbens and Kalyanaraman’s (Reference Imbens and Kalyanaraman2012) bandwidth and 250 inhabitants.
OL=open list system.
*p<0.10, **p<0.05, ***p<0.01.
Conclusion
By exploiting the unique institutional framework of Spanish local elections, I have shown that the electoral system has an effect on voter turnout. In particular, an OL, plurality-at-large system increases turnout by between 1 and 2 percentage points with respect to a CL proportional representation system. The results suggest that OL systems where parties run in candidate lists but voters can express their preferences for individual candidates are conducive to more voter turnout.
Working on understanding this type of electoral systems better could be a fruitful avenue for future research. Economists and political scientists have extensively worked on voter turnout and the motivations for the decision of voting or abstaining (Ledyard Reference Ledyard1984; Palfrey and Rosenthal Reference Palfrey and Rosenthal1985; Feddersen and Pesendorfer Reference Feddersen and Sandroni1996; Feddersen and Sandroni Reference Feddersen and Pesendorfer2006; Battaglini, Morton and Palfrey Reference Battaglini, Morton and Palfrey2010), and this is still an active area of research (Gerber, Green and Larimer Reference Gerber, Green and Larimer2008; Nickerson Reference Nickerson2008; DellaVigna et al. Reference DellaVigna, List, Malmendier and Rao2013; Herrera, Morelli and Palfrey Reference Herrera, Morelli and Palfrey2013; Kartal Reference Kartal2013; Fujiwara, Meng and Vogl Reference Fujiwara, Meng and Vogl2014). However, to the best of my knowledge, we still do not have a theoretical framework to think about voter turnout in OL elections, in which there is competition both across and within parties.
Appendix
Robustness Checks for the 100-Inhabitant Threshold
In this appendix, I show robustness checks for the results at the 100-inhabitant threshold. Table A1 tests for pretrends and Table A2 shows the results of the donut regression discontinuity design.
Table A1 100-Inhabitant Threshold Robustness: Pretrends in the Outcomes of Interest

Table A2 100-Inhabitant Threshold Robustness: Donut Regressions


