


Introduction
Estimating abundances, and monitoring these measures of a population through time, is a fundamental component of ecology, conservation and management (Krebs Reference Krebs1989). While long-term population surveys provide important information on population abundance and trends, interpreting this information is often complicated by high year-to-year variability in the number of individuals counted (Urquhart and Kincaid Reference Urquhart and Kincaid1999). Statistical techniques for analysing sampling data try to minimise variability due to imperfect detection and unavailability of individuals in a surveyed population. For example, analysis of survey data from single visit techniques like distance sampling can adjust for imperfect detection of individuals (Burnham Reference Burnham1981), whereas multiple counts conducted over a short period of time allow an assessment of the availability of individuals to be counted (Alldredge et al. Reference Alldredge, Pollock, Simons, Collazo and Shriner2007a, Chandler et al. Reference Chandler, Royle and King2011). Nonetheless, population abundance estimates over time can be highly variable from both natural fluctuations in population size and error associated with the survey methods (Urquhart et al. Reference Urquhart, Paulsen and Larsen1998), and the greater the variation in the counts over time, the more difficult it is to detect trends (Thomas Reference Thomas1996, Thomas et al. Reference Thomas, Burnham and Buckland2004). One approach is to use linear trends through a time series of counts to assess trajectories of populations, helping to make sense of what is often noisy data. However, a weakness of using a linear regression model to assess trend is that linear regression assumes all of the observed deviations from the model are due to observation error and that the slope is constant across the time series (Dennis et al. Reference Dennis, Ponciano, Lele, Taper and Staples2006). Alternatively, population trajectories in long time series could be assessed using multiple slopes, which are separated by “break-points” to account for significant changes in the trajectory of populations at specific times (e.g. Freed and Cann Reference Freed and Cann2013). However, finding a statistically significant break point in a time series or deriving a well-founded biological reason for a priori break points can be difficult (Camp et al. Reference Camp, Pratt, Gorresen, Woodworth and Jeffrey2014).
An alternative to conventional linear regression for the analysis of counts is state-space models, which decompose variation in long-term census data into components of biologically meaningful process variation and observation error (Humbert et al. Reference Humbert, Mills, Horne and Dennis2009, Knape et al. Reference Knape, Jonzén and Sköld2011). Decomposing the variation in a time series of counts into these two components of variation allows for assessment of trend based only on biologically meaningful variation, process variation, which is comprised of demographic and environmental stochastic forces. State-space models are specifically autoregressive, because the population in year t is assumed to depend upon the population size in year t-1. The approach assumes that year-to-year population changes are realisations of a long-term growth rate with annual variation due to environmental (e.g. weather events such as hurricanes or droughts) and demographic (e.g. variation in clutch size) stochasticity. The approach then compares the model of the ‘true state’ to the observed data in order to estimate the amount of variation due to sampling error. Explicitly modelling the slope as a stochastic parameter allows for variation in the slope from year-to-year across the time series and can provide improved estimates of annual abundances and long-term trends (Dennis et al. Reference Dennis, Ponciano, Lele, Taper and Staples2006, Knape Reference Knape2008, Knape et al. Reference Knape, Jonzén and Sköld2011).
Accurate estimates of abundance and population trends are essential for the conservation and management of threatened and endangered species, and the forest birds of Hawai‘i have been the focus of extensive surveys and analysis over the last several decades (Scott et al. Reference Scott, Mountainspring, Ramsey and Kepler1986, Gorresen et al. Reference Gorresen, Camp, Reynolds, Woodworth and Pratt2009). The forest birds of Hawai‘i are famous both for their spectacular diversity, arising from over 4 million years of adaptive radiation, and for the tragic loss of nearly half of this diversity in just the last 200 years (Banko and Banko Reference Banko and Banko2009, Pratt Reference Pratt2009). Forty years ago the Hawaiian Forest Bird Survey project was initiated to document the status and trends of extant species, and the results of the surveys brought international attention to the conservation needs of the Hawaiian avifauna (Scott et al. Reference Scott, Mountainspring, Ramsey and Kepler1986). These landmark surveys have been resurveyed and expanded upon over the decades, resulting in a rich source of biological information from which to assess the current status and trends of native forest passerines (Camp et al. Reference Camp, Reynolds, Gorresen, Pratt and Woodworth2009, Gorresen et al. Reference Gorresen, Camp, Reynolds, Woodworth and Pratt2009). Importantly, these series of surveys provide information to managers to prioritise funds and conservation actions, and there have been many efforts over the years to improve inference made with them (Ramsey and Scott Reference Ramsey and Scott1979, Johnson et al. Reference Johnson, Camp, Brinck and Banko2006, Camp et al. Reference Camp, Seavy, Gorresen and Reynolds2008). However, surveying forest birds in Hawai‘i, especially for endangered species with low abundances, can be difficult where forests are dense and in which counts frequently consist of acoustic detections and associated distance estimates. Understanding the long-term trends in Hawai‘i’s forest birds is an example of a system in which state-space modelling may provide stronger inferences about population trends by partitioning the error attributable to observation and process error.
We applied a state-space approach to assess forest bird trends in Hakalau Forest National Wildlife Refuge (Hakalau) on Hawai‘i Island, which is one of Hawai‘i’s longest run continuous survey areas (1987–2012). Established in 1985, Hakalau is one of the most important forest bird sanctuaries in all of Hawai‘i, supporting all extant species of Hawai‘i Island forest birds, including three endangered species, and is recognised as a category IV Habitat/Species Management Area by IUCN (Dudley Reference Dudley2008). Hakalau has also been at the centre of debates on the proper interpretation of population trends (Scott Reference Scott2008, Tummons Reference Tummons2009). Specifically, the debate is whether a single linear, versus multiple linear segments, are appropriate to describe a trend when a population trajectory changes over time (Camp et al. Reference Camp, Pratt, Gorresen, Jeffrey and Woodworth2010, Reference Camp, Pratt, Gorresen, Woodworth and Jeffrey2014; Freed and Cann Reference Freed and Cann2010, Reference Freed and Cann2013). While accounting for possible changes in a population trajectory is important, determining a statistically significant change in a time series is difficult when year-to-year variation is high, a condition typical of Hawaiian bird count data (Camp et al. Reference Camp, Pratt, Gorresen, Woodworth and Jeffrey2014).
Given the importance of accurate estimates of abundance and population change for management and conservation efforts, in this paper we examine how the choice of analytical methods can facilitate assessment of population trend and trajectory evaluating two approaches for modelling error. The first involved contrasting the use of simple bird survey counts uncorrected for detection probability with that of abundance estimates produced by distance sampling that account for imperfect detection (Buckland et al. Reference Buckland, Anderson, Burnham, Laake, Borchers and Thomas2001). Using both the uncorrected counts and detection-corrected abundances, the second approach consisted of modelling population trends with an ordinary log-linear regression model where variation was not partitioned (Camp et al. Reference Camp, Seavy, Gorresen and Reynolds2008, Reference Camp, Pratt, Gorresen, Woodworth and Jeffrey2014), and comparing that with use of a state-space, log-linear model where variation was partitioned into process and observation error (following the method of Kéry and Schaub Reference Kéry and Schaub2012). The resulting estimate of trend comprised of only process error was then compared with the results from non-partitioned log-linear regression.
Methods
Study area
The 15,390 ha Hakalau Forest NWR (19o 51’N, 155o 18’W) on the windward slope of Mauna Kea volcano is the largest protected and actively managed area of mid- to high-elevation rain forest in Hawai‘i (see Camp et al. Reference Camp, Pratt, Gorresen, Jeffrey and Woodworth2010 for detailed map). Mean daily air temperature averages 15°C with an annual variation of < 5°C, and annual rainfall averages 2,500 mm with a maximum of about 6,100 mm (Juvik and Juvik Reference Juvik and Juvik1998). The montane forest has a canopy dominated by old-growth ‘ōhi‘a-lehua Metrosideros polymorpha and koa Acacia koa, with ‘ōlapa Cheirodendron trigynum, kōlea Myrsine lessertiana, pilo Coprosma montana, C. ochracea, and C. rhynchocarpa, tree ferns Cibotium spp., pūkiawe Styphelia tameiameiae, ‘ōhelo Vaccinium calycinum, and ‘ākala Rubus hawaiiensis the most common sub-canopy trees and shrubs. Vegetation at middle elevations (600–1,900 m) is dominated by native ‘ōhi‘a and koa/‘ōhi‘a forest, whereas at the highest elevations (> 1,900 m) it is comprised of open grassland and relict mature koa trees and young stands of koa planted to reforest former pasture land. Non-native plant species may be found in native forest at all elevations, the most injurious species being various pasture grasses, gorse Ulex europaeus, blackberry Rubus argutus, banana poka Passiflora tarminiana, and holly Ilex aquifolium.
For purposes of analysis, the study area was divided into two strata following Camp et al. (2010; Figure 1). Open forest, the middle section of the refuge, includes once intensively grazed forest at an elevation range of 1,400–1,920 m (area = 3,373 ha) with large trees that are widely spaced such that they form an open canopy forest. This area has been surveyed since 1987 with 204 stations (i.e. the sampling points). At lower elevations is the closed forest (1,400–1,700 m) with a dense, closed canopy forest relatively unmodified by grazing, which has been surveyed since 1999 with 197 stations (area = 1,998 ha). The uppermost areas of the refuge (1,650–2,000 m) are former open pasture lands that have seen extensive reforestation efforts since 1987. These pasture lands have been surveyed intermittently since 1987 with 35 stations (area = 1,314 ha), but because of inconsistent sampling and because the numbers of native birds using the habitat were very low until recent years, this habitat is not considered further.

Figure 1. Survey route and study areas of Hakalau Forest Unit of the Hakalau Forest National Wildlife Refuge (HFNWR), Hawai‘i.
Bird surveys
Annual bird sampling at Hakalau followed standard point-transect sampling methodology, a form of distance sampling used in Hawai‘i to estimate forest bird populations over large areas (Scott et al. Reference Scott, Jacobi and Ramsey1981a, Reference Scott, Mountainspring, Ramsey and Kepler1986, Camp et al. Reference Camp, Reynolds, Gorresen, Pratt and Woodworth2009). Surveys began in 1987 at stations spaced from 150 to 250 m apart, to assure station independence, along transects that were spaced 500 to 1,000 m apart (Camp et al. Reference Camp, Pratt, Gorresen, Jeffrey and Woodworth2010). In the open forest stratum an average of 184 stations (± 21) and in the closed forest stratum an average of 81 stations (± 19) were surveyed annually (Table S1 in the online supplementary materials). Observers received pre-survey training to calibrate for distance estimation and their ability to identify bird vocalisations, thereby reducing variability among observers and standardising for local conditions (Kepler and Scott Reference Kepler and Scott1981). Observers recorded the detection type (heard, seen, or heard then seen; 80% of all records are auditory only, while 20% are seen or heard then seen) and horizontal distance (exact distance in m) from the station centre point to individual birds detected during an 8-min count. Aurally detected birds were placed in the environment and the horizontal distance estimated to the reference point recorded; a method that improves distance measurements and yields reliable distance estimates (Scott et al. Reference Scott, Ramsey and Kepler1981b; but see Alldredge et al. Reference Alldredge, Simons and Pollock2007b,Reference Alldredge, Simons and Pollockc; Reference Alldredge, Pacifici, Simons and Pollock2008). Observers also recorded cloud cover, rain, wind and gust speed, and time of day at each station. Sampling was typically conducted between dawn and 11h00 and halted when rain, wind, or gust strength exceeded prescribed levels (light rain and wind and gust strength level 3 on the Beaufort scale).
Abundance estimation
We produced abundance estimates using two methods. First, simple counts (hereafter, uncorrected counts) were adjusted for sampling effort (detections per station visit) as an index of abundance without accounting for imperfect detection. The uncorrected counts were multiplied by 1,000 so the values were approximately on the same scale as the detection-corrected abundance estimates and both responses could be fitted with the same model priors (see below). We used the uncorrected counts in our analysis because they are commonly used as an indicator of abundance for trend assessment, especially in state-space models.
The second method used point-transect sampling procedures to correct density estimates for the birds that were present but not detected, and to account for changing detection probabilities from year to year and among sampling covariates (hereafter referred to as detection-corrected abundances; Buckland et al. Reference Buckland, Anderson, Burnham, Laake, Borchers and Thomas2001). Densities were estimated for each species in both the open and closed forest types, and multiplied by the respective areas of each stratum to produce abundance estimates. This is a standard procedure to convert from density to abundance estimates, and was conducted so that log-linear and state-space model regression trends were evaluated on the same scale.
Distance sampling uses a species-specific detection function to estimate the probability of detection as a function of distance to produce annual estimates of density and abundance that account for imperfect detection (Buckland et al. Reference Buckland, Anderson, Burnham, Laake, Borchers and Thomas2001). Much of the early development of point-transect distance sampling, including testing the model assumptions, was developed on Hawaiian forest bird surveys (Ramsey and Scott Reference Ramsey and Scott1979, Scott et al. Reference Scott, Ramsey and Kepler1981b; see Camp et al. Reference Camp, Reynolds, Gorresen, Pratt and Woodworth2009), and Buckland et al. (2001, and references therein) provide evidence that distance sampling procedures, including point-transect sampling, provide unbiased estimates of population size when certain critical model assumptions are met: all birds are detected with certainty at the station centre point, birds are detected prior to any responsive movement, and distances are measured without error. Although there is likely some violation of these assumptions for a given observer or species, we believe these assumptions are largely met. Specifically, Hawaiian forest birds are very vocal and detections of birds at the station centre are high even if the birds are not visible. Second, our experience indicates that there is little responsive movement by Hawaiian forest birds to observers, especially in the tall stature forests at Hakalau (this is supported by visual inspection of the detection function and distance histogram graphics), and therefore are not likely responding to the observer. Third, all counters take part in a long-term training programme where they serve as apprentices before becoming primary counters, and prior to each count calibration exercises are conducted for observers to practice estimating distance measurements; calibration is continued until deviations from the true distance are < 10%, a level shown to produce unbiased density estimates (Scott et al. Reference Scott, Ramsey and Kepler1981b). To further ensure that our estimates were reliable we a priori eliminated the species for which insufficient numbers of birds were detected and those species that violate distance sampling assumptions.
We produced abundance estimates for 10 forest bird species (eight native, two alien) with sufficient detections to adequately characterise detectability (Buckland et al. Reference Buckland, Anderson, Burnham, Laake, Borchers and Thomas2001: 241). These species included the Hawai‘i ‘Elepaio Chasiempis s. sandwichensis, a monarch flycatcher (Monarchidae), ‘Ōma‘o Myadestes obscurus, a thrush (Turdidae), and six Hawaiian honeycreepers (Fringillidae: Drepanidinae): Hawai‘i ‘Amakihi Hemignathus virens, ‘Akiapōlā‘au Hemignathus munroi, Hawai‘i Creeper Oreomystis mana, Hawai‘i ‘Ākepa Loxops c. coccineus, ‘I‘iwi Vestiaria coccinea, and ‘Apapane Himatione sanguinea. The ‘Akiapōlā‘au, Hawai‘i Creeper, and Hawai‘i ‘Ākepa are globally, federally and state listed endangered species. Only two of the 16 non-native birds that occur in Hakalau had sufficient detections to reliably model: Red-billed Leiothrix Leiothrix lutea (Timaliidae) and Japanese White-eye Zosterops japonicas (Zosteropidae).
Species-specific abundance estimates were calculated from point-transect data using program Distance, version 6.0, release 2 (Thomas et al. Reference Thomas, Buckland, Rexstad, Laake, Strindberg, Hadley, Bishop, Marques and Burnham2010). Stations were usually counted only once during an annual survey; but when counted more than once, estimates were adjusted by the number of times the station was counted. Candidate detection function models were limited to half normal and hazard-rate detection functions with expansion series of order two (Buckland et al. Reference Buckland, Anderson, Burnham, Laake, Borchers and Thomas2001: 361, 365; half normal was paired with cosine and Hermite polynomial adjustments, and hazard rate was paired with cosine and simple polynomial adjustments).
To improve model precision, we incorporated sampling covariates in the multiple covariate distance sampling (MCDS) engine of Distance (Thomas et al. Reference Thomas, Buckland, Rexstad, Laake, Strindberg, Hadley, Bishop, Marques and Burnham2010). Potential covariates included cloud cover, rain, wind, gust strength, observer, detection type, time of detection, elevation, vegetation type (open and closed forest study areas), and year of survey. All covariates were treated as a factor, except elevation and time of detection which were treated as continuous covariates. Assessing a continuous covariate allowed for determining if the detection rate varied with time of day or elevation. Each detectability model in the candidate set with and without covariates was fit to data pooled across strata and time (year) for each species, and the model selected was that with the lowest 2nd-order Akaike’s Information Criterion corrected for small sample sizes (AICc) (Buckland et al. Reference Buckland, Anderson, Burnham, Laake, Borchers and Thomas2001, Burnham and Anderson Reference Burnham and Anderson2002; Tables S2, S3, Figure S1). Data were truncated at a distance where detection probability was < 10%. Species-specific annual and strata abundances were estimated from the most parsimonious model, referred to as the global detection function model in Buckland et al. (Reference Buckland, Anderson, Burnham, Laake, Borchers and Thomas2001), and variances and confidence intervals were derived by bootstrap methods in Distance from 999 iterations (Thomas et al. Reference Thomas, Buckland, Rexstad, Laake, Strindberg, Hadley, Bishop, Marques and Burnham2010).
Trend assessment
We assessed change in population abundance by two methods — ordinary log-linear regression and a log-linear state-space model. We defined trend as the long-term, overall directional change in abundance following Urquhart and Kincaid (1999: 405) who state that population abundances “may deviate substantially from strict linearity” yet “we can detect trend by seeking linear trend without ever asserting that detected trend is linear”. Under this definition, a time series of counts may experience annual perturbations and appear non-linear, but systematic changes would still be detectable with linear models. Populations differ from year-to-year, vary over short periods, and go through cycles. Therefore, trends of both the log-linear regression and state-space models were assessed in an equivalency test framework to distinguish between ecologically and statistically significant changes, and to differentiate between negligible and insignificant trends (Camp et al. Reference Camp, Seavy, Gorresen and Reynolds2008).
Model diagnostics
Model diagnostics were conducted to assess the validity of using linear models. The detection-corrected abundance estimates were fitted with a traditional least-squares model using simple linear regression in R version 3.0.3; 2014-03-06 (R Core Team 2014). The R language ‘LearnBayes’ library (Albert Reference Albert2012) was used to sample from the joint posterior distribution of the slope and variance following model diagnostics procedures in Maindonald and Braun (Reference Maindonald and Braun2006). Histograms of the simulated posterior draws of the regression coefficients and error standard deviation were plotted and inspected visually to ascertain for deviations from a normal distribution.
Outliers were also identified using Bayesian residuals and visually inspected. Few densities were identified as outliers nor did the outliers occur at either the first or last time points. Because of the relatively small sample size (n = 25) the outlier values were retained. Because autocorrelation in a time series results in the error terms being dependent upon each other and thereby underestimated, temporal autocorrelation in annual abundances was assessed with the ‘acf’ function in R, and AIC procedures were used to select the lag autocorrelation that removed serial correlation where present.
Diagnostic plots indicated little to no evidence of unequal variances or non-normality in the residuals from the linear model of annual abundance for the 10 forest birds in either forest strata. The posterior medians of the slope and variance were similar in value to the ordinary regression estimates, and the histograms of simulated draws from the marginal posterior distributions appeared approximately normally distributed. AIC statistics indicate that an independence model was appropriate for all species and strata; except for Japanese White-eye in the open forest stratum, where a first-order autoregressive error model was more appropriate. The autoregressive model had a lower AIC for Red-billed Leiothrix in the open forest stratum, and Japanese White-eye in the closed forest stratum, but were within two AIC units so the independent model was used. Trends for species and stratum for which the independence model was appropriate were assessed with a log-linear model. For species that were autocorrelated, trend was estimated with a modified log-linear regression model to account for temporal autocorrelation using an autoregressive moving average (ARMA) model (Ives et al. Reference Ives, Abbott and Ziebarth2010). Species- and strata-specific models were fitted using the ‘arma’ function in R, their performance compared using AIC, and estimated slope was determined using an autoregressive adjusted log-linear model. In this model the total error term (residual) for each year was modelled as a proportion (φ) of the previous year’s residual plus a random normal error term. φ was modelled with a diffuse uniform prior (commonly referred to as a non-informative prior) between 0 and 1. The posterior distribution of the slope of the autoregressive adjusted log-linear regression model was then interpreted as described below.
Ordinary log-linear regression
We used log-linear regression in a Bayesian framework to assess population trends in uncorrected counts and detection-corrected abundances for the 10 species of forest birds in each of the two forest types. The posterior distribution of the regression slope ( $\hat \beta $) was estimated in Stan (a probabilistic programming language implementing Bayesian statistical inference) run from an R environment using the ‘rstan’ package (Stan Development Team 2014). We modelled the index count or the Distance-adjusted abundance estimate (generically N) as
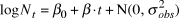 $$\log N_t = \beta _0 + \beta \cdot t + {\rm{N}}\left( {0,\sigma _{obs}^2 } \right)$$
 The intercept and the estimated annual rate of change (slope)  $\hat \beta $ were modelled with diffuse normal priors for the log-transformed abundances (mean = 0; SD = 25). The response variables were modelled with normal instead of Poisson priors because the actual counts were adjusted to account for survey effort. We tried a range of scale parameters on the priors, which had not effect on the inference, but did not assess different functional forms of priors. The log-transformation linearizes an exponential growth model and stabilizes the error variances. The log-linear regression error term was modelled as normal with standard deviation σobs, which itself was modelled with a diffuse uniform prior ranging from 0 to 20. Where there was autocorrelation, an AR1 regression was used to account for it. In the following model:
 $$\log N_t = \beta _0 + \beta \cdot t + \rho \cdot \left( {logN_t - \left( {\beta _0 + \beta \cdot t} \right)} \right) + {\rm{N}}\left( {0,\sigma _{obs}^2 } \right),$$
ρ represents the serial autocorrelation between successive years, and to which was applied the same diffuse prior (Normal, mean = 0; SD = 25) as the slope. The model parameters were estimated from 2,000 iterations for each of four chains (i.e. model runs) after discarding a “warm-up” period of an initial 2,000 iterations. Gelman-Rubin convergence statistics ( $\hat R$, Gelman et al. Reference Gelman, Carlin, Stern and Rubin2004) were calculated for all model parameters. Any model with an
  $\hat R$ value greater than 1.1 (due to the failure of a chain to converge with the others) was re-run. Maximum
  $\hat R$ in the final models was 1.04, indicating convergence. The four chains were pooled (8,000 total samples) to calculate the posterior distribution. The posterior distribution of the slope was then interpreted as described below in trend interpretation.
State-space model
Following the methods in Kéry and Schaub (Reference Kéry and Schaub2012) we fitted a log-linear state-space model of each species in both the open and closed forest, using both uncorrected counts and detection-corrected abundance estimates as the response. Models were run in Stan from an R environment as described above. We ran each model with four chains for 2,000 iterations following a burn-in of 2,000 iterations. Maximum  $\hat R$ in the final models was < 1.1, indicating convergence. The posterior distribution of the slope was then interpreted as described below in trend interpretation.
The mean slope ( $\bar \beta $) of the log-transformed response was modelled with a normal prior of mean 0 and standard deviation 25, which is uninformative on the log-scale of population abundances. Standard deviation of the mean (
 $\sigma _\beta $) was modelled with a uniform prior between 0 and 20. Beginning with the second year of the time series, the index count or Distance-adjusted abundance at time t+1 (
 $logY_{t + 1} )$) was modelled as the abundance at time t plus a random slope drawn from a normal distribution with a mean and variance of the generated priors.
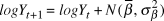 $$logY_{t + 1} = logY_t + N(\bar \beta ,\sigma _\beta ^2 )$$
 We dealt with the missing year (2009) by estimating the 2010 value as 2008 plus two draws (one for the step from 2008 to 2009, and the second for the step from 2009 to 2010) from the random slope distribution. Observation error standard deviation ( $\sigma _{obs} $) was drawn from a uniform prior ranging from 0 to 20, also uninformative on the log-scale abundances. We did not use informed priors as this information was not available for the raw count data and the Distance-derived error estimates would require a multivariate prior based on the variance-covariance matrix, which was not available. Each year’s observed abundance or index (
 $N$) was then modeled as a normal distribution.
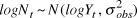 $logN_t \~N(logY_t ,\sigma _{obs}^2 )$
 Process error ( $\sigma _{proc}^2 $) was measured on the same scale as observation error by calculating the variance of the deviation between each year’s actual
  $logY$ and the previous year’s
  $logY$ plus the mean slope (i.e., the variance of
 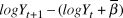 $logY_{t + 1} - (logY_t + \bar \beta )$), omitting the first year and missing year. We recorded means and 95% credible intervals of
  $\sigma _{obs}^2 $, the percent of total observation error
  $\left( {{{\sigma _{obs}^2 } \over {\sigma _{obs}^2 + \sigma _{proc}^2 }}} \right)$,
  $\bar \beta $, and
  $logY\widehat{}$. The posterior distribution of
  $\bar \beta $ was then interpreted as described below in trend interpretation.
Trend interpretation
For both the ordinary log-linear regression and state-space models we interpreted the posterior distribution of the slopes using equivalency testing to establish relevant threshold levels that differentiated between inconclusive and biologically meaningful trends (Camp et al. Reference Camp, Seavy, Gorresen and Reynolds2008). Applied in a Bayesian framework, the posterior distribution of the slope provides the probability of each of the three trend outcomes (increasing, decreasing, or stable population trend) as well as a measure of uncertainty in the estimated slope. We applied those analyses for both the uncorrected counts and detection-corrected abundances, and compared the results of the log-linear model against a state-space model.
Meaningful trends were differentiated from ecologically negligible or statistically non-significant trends by applying a rate of change of 25% over 25 years to define threshold levels of change: declining (< −0.0119); negligible (−0.0119 to 0.0093); or increasing (> 0.0093) (Camp et al. Reference Camp, Pratt, Gorresen, Jeffrey and Woodworth2010). We categorised the strength of evidence for a trend based on the posterior odds (also called Bayes factors) as weak, moderate, strong, or very strong. Based on the posterior probabilities (P) evidence was weak if P < 0.5; moderate if 0.5 ≤ P < 0.7; strong if 0.7 ≤ P < 0.9; and very strong if P ≥ 0.9. In cases where the posterior odds provided weak evidence among all three trend categories (i.e. decreasing, negligible, and increasing trends), we interpreted the trend to be inconclusive. We concluded that a population was stable given moderate to very strong evidence of a negligible trend.
Results
The four different approaches we evaluated to understand abundance and trends in the long-term survey data from Hakalau largely agreed in terms of general trend patterns, but produced very different annual abundance estimates. Indices of relative abundance from the uncorrected counts varied among species, over years and between the open and closed forest strata (sum of birds detected across all counts divided by effort; Appendices S1 and S3). ‘I‘iwi had the greatest numbers of birds detected per count with an average of 6.12 (± 0.71, minimum 4.59, maximum 7.25) birds in open forest and 5.37 (± 0.78, minimum 3.99, maximum 6.41) birds in closed forest. ‘Apapane and Hawai‘i ‘Amakihi each had abundances similar to that of ‘I‘iwi. In contrast to these relatively abundant species, the endangered birds had very low indices of abundance. ‘Akiapōlā‘au occurred at the lowest values in both open and closed forest (0.08 ± 0.03, minimum 0.05, maximum 0.18, and 0.08 ± 0.06, minimum 0.01, maximum 0.23, respectively).
Detection-corrected abundances were equally variable among species, years and forest strata (Table S4), and followed the same order rank as observed in the count data. ‘I‘iwi was the most abundant bird at 70,634 and 45,015 birds during 2012 in the open and closed forest strata, respectively. The 2012 point estimates of Hawai‘i ‘Ākepa and Hawai‘i Creeper were much lower at 4,779 and 6,999, and 5,112 and 6,348 birds in open and closed forest strata, respectively, whereas ‘Akiapōlā‘au numbered only 307 and 105 birds in these respective habitats.
Log-linear regression results
Log-linear trends of the uncorrected counts were predominantly stable or increasing (16 out of 20, or 80% of the species; Table 1; Appendices S3 and S4). The remaining trends were all decreasing, and were only observed in the closed forest stratum for Hawai‘i ‘Elepaio, ‘Ōma‘o, ‘Akiapōlā‘au, and Red-billed Leiothrix. Log-linear trends of the detection-corrected abundances yielded similar results to those from uncorrected counts (Table 2; Figure S2). A majority of the trends were stable or increasing (16 out of 20, or 80%), but downward trends were noted for Hawai‘i ‘Elepaio, ‘Akiapōlā‘au, and Red-billed Leiothrix in closed forest. One model yielded an inconclusive result due to a relatively flat trend with fluctuating abundances and uncertain estimates (‘Ōma‘o in closed forest; Table 2, Table S4).
Table 1. Log-linear regression based trends ( $\bar \beta $, lower and upper 95% credible intervals) were calculated for forest bird uncorrected counts at Hakalau in open and closed forest strata. The ecological relevance of a trend was based on a 25% change in relative abundance over 25 years. Trend was interpreted as increasing = ↑, stable = ↔, decreasing = ↓, or inconclusive = Inc.

Table 2. Log-linear regression based trends ( $\hat \beta $, lower and upper 95% credible intervals) were calculated for forest bird detection-corrected abundance at Hakalau in open and closed forest strata. An ‘arma’ model accounting for serial autocorrelation was used to estimate Japanese White-eye trend in the open stratum. See Table 1 for description of trends.

State-space model results
We reassessed the trends of the 10 species in the two forest strata using state-space models for both the uncorrected counts and detection-corrected abundances (20 models each stratum; Table S2). Fully one-half of the models resulted in inconclusive trends for the uncorrected counts (Table 3). Of the models with conclusive results, six showed evidence of increasing and four demonstrated decreasing trends. Similar to the log-linear results, the declining trends all occurred in the closed forest and for the same species — Hawai‘i ‘Elepaio, ‘Ōma‘o, ‘Akiapōlā‘au, and Red-billed Leiothrix.
Table 3. Mean overall population trend in uncorrected counts from state-space models (expressed as the log-linear slope) across the time series for all species. See Table 1 for description of trends. Percentage of observation error (Obs Error) estimated by the state-space model by strata.

Of the 20 models for the detection-corrected abundances, nine showed evidence of a population increase over the time series, two showed evidence of a decline, and one (Hawai‘i ‘Elepaio in open forest) showed evidence of a stable population trend (Table 4; Figure S2). The remaining eight models were inconclusive. Declining trends were observed for Hawai‘i ‘Elepaio and ‘Akiapōlā‘au in closed forest.
Table 4. Mean overall population trend in detection-corrected abundance from state-space models (expressed as the log-linear slope) across the time series for all species. See Table 1 for description of trends. Percentage of observation error (Obs Error) estimated by the state-space model by strata.

In general, the evidence of conclusive trends using state-space models was less strong than for ordinary log-linear regression (Figure 2). For example, models using the uncorrected counts and detection-corrected abundances of Hawai‘i ‘Ākepa in the open forest were both classified as having strong evidence of a negligible trend in the linear regression model, whereas they were both inconclusive with the state-space approach (Tables 1 vs. 3, and Tables 2 vs. 4; Figure 2). The shifts in the evidence for a trend were largely a result of reduced precision arising from the incorporation of process error in the state-space models.

Figure 2. Differences in assessed trends between ordinary log-linear and state-space models for uncorrected counts (top panel) and detection-corrected abundances (middle panel). Differences in trends between uncorrected counts and detection-corrected abundances using state-space models (bottom panel). Posterior probabilities of a meaningful trend in open and closed forest. Lines originate at log-linear model probabilities and dots indicate state-space partitioned probabilities. Vertices represent 100% of posterior probability with that trend; shade gradations represent the thresholds of moderate (0.5 ≤ P ≤ 0.7; light gray), strong (0.7 ≤ P ≤ 0.9; medium gray), and very strong (P ≥ 0.9; dark gray) evidence of trends. Species codes are HAEL = Hawai‘i ‘Elepaio, OMAO = ‘Ōma‘o, HAAM = Hawai‘i ‘Amakihi, AKIP = ‘Akiapōlā‘au, HCRE = Hawai‘i Creeper, HAAK = Hawai‘i ‘Ākepa, IIWI = ‘I‘iwi, APAP = ‘Apapane, RBLE = Red-billed Leiothrix, and JAWE = Japanese White-eye.
The amount of observation error varied widely among species but was estimated at 40% to 90% of uncertainty in uncorrected counts and detection-corrected abundances (Tables 3 and 4). Comparison of population size changes from one year to the next (population growth rates, λ) for both the uncorrected counts and detection-corrected abundances and their respective state-space estimates indicate that average geometric means of the entire time-series are very similar (Table S5), but the non-state-space estimates encompass far more extreme changes in some years. Minimum and maximum annual population changes for the three endangered species (Table S5) are large, such as over 300% increases in one year, and biologically unlikely given a generally stable population. The high variability is presumably due to their low densities, which lead to more sampling issues. However, even the more common species had high year-to-year abundance changes, and this may indicate the Hawai‘i forest birds are spatially dynamic.
Discussion
An inherent problem with bird surveys used to assess trends over time is that year-to-year abundance estimates fluctuate for a number of reasons. One source of variation is process variation, which is actual change in abundance that is biologically meaningful. For example, environmental variation can lead to reduced productivity across a population, which might reduce the population size in the subsequent year. A second source is observation error, which is caused by changes in sampling conditions between years, availability of birds to be counted in the sampled area, and stochastic measurement error. Traditional methods for evaluating trends have not been able to consider dual sources of variation, as simple linear regression models assume all variability is observation error, while time series models assume all the variability is due to process variation. State-space models are a relatively recent technique that attempts to solve the problem of both identifying unbiased abundances and robust trend assessment by partitioning the error into process and observation components (Dennis et al. Reference Dennis, Ponciano, Lele, Taper and Staples2006).
Our results indicate that observation error for the Hakalau bird surveys are high (Table 4), ranging from 40% to 90% of total variation. Not surprisingly, sampling issues are very important considerations for estimating abundance in endangered species, due to their low densities and heterogeneous distribution across the landscape. The highest estimates of observation error were for two of the endangered species, ‘Akiapōlā‘au and Hawai‘i Creeper, both in open forest habitat. However, we also found high levels of observation error in the more common species, which may reflect high degrees of movement across the landscape in response to heterogeneous resource distribution (Simon et al. Reference Simon, Pratt, Berlin, Kowalsky, Fancy and Hatfield2002). Many of Hawai‘i’s forest birds depend on nectar and fruit, and the variable nature of where flowering and fruiting trees occur at any one time may result in shifts from year-to-year on exactly where birds are concentrated. Thus, while using abundance estimates corrected for imperfect detection (via Distance) helps reduce observation variation, they cannot account for other sources of observation error due to sampling low density species, highly dispersed or clustered spatial distributions, and high rates of temporary emigration.
By partitioning observation error from a time series of counts, state-space models provide an estimate that more accurately reflects the actual abundance in a given year. For the Hakalau surveys, the state-space model’s estimates of annual abundance showed less year-to-year variation than the annual estimates of abundance derived from the uncorrected counts or the detection-corrected abundances. State-space models use the entire time series to model the year-to-year growth rates, with an underlying process (in this case exponential / log-linear growth) governing the population dynamics (Kéry and Schaub Reference Kéry and Schaub2012). They are inherently autoregressive, with every year’s estimate informed by the previous year, and thus dampen year-to-year population estimates by considering the population size in the previous year. Biological populations function in this manner, with population size in one year linked to the population size of the previous year, and such an approach produces far more biologically plausible estimates of abundance over time. For example, year-to-year changes in the state-space model estimated growth rates (change in population size from one year to the next) were typically between 0.85 and 1.15, which are consistent with the generally stable to gradually changing population trends observed at Hakalau. On the other hand, extreme growth rate estimates from the corrected/uncorrected abundance estimates result in annual growth rates that are biologically unlikely for a small forest bird. This is especially true with the three endangered species that had estimated growth rates generally greater than 3.0 in some years. Species that are more common had less extreme yearly changes, but maximum and minimum growth rates of 2.2 and 0.4 were also biologically implausible for generally stable populations. However, the geometric means of the annual growth rates were very similar between all four approaches (0.91 to 1.06), and at levels that are reasonable for populations not undergoing dramatic changes. This suggests the high year-to-year changes in the abundance estimates were just variation around stable populations.
Accurate estimates of abundance are important for detecting changes in populations over time, which can help managers identify problems before they become insurmountable and help assess progress toward meeting conservation goals by evaluating the effectiveness of ongoing management actions. The abundance estimates from the state-space models are more dependable because they are linked to the previous years’ population sizes, which more closely match the true biological process. We found a wide range of estimated abundances in Hakalau bird species, from 112,000 ‘I‘iwi to 16,000 ‘Ōma‘o for the common species (2012 estimates), and 11,000, 13,000, and 500 for Hawai‘i ‘Ākepa, Hawai‘i Creeper, and ‘Akiapōlā‘au, respectively (open and closed forest combined; state-space model derived estimates). The improved abundance estimates, with observation error removed, are critical for management activities that require abundance estimates to gauge effectiveness, and for incorporating into models that assume abundance estimates that are free of error (e.g. Integrated Population Models; Besbeas et al. Reference Besbeas, Freeman, Morgan and Catchpole2002).
Twelve of the 20 population trends were stable to increasing at Hakalau. These stable to increasing long-term trends at Hakalau are in stark contrast to those observed elsewhere in Hawai‘i where the general trends indicate declining populations (Gorresen et al. Reference Gorresen, Camp, Reynolds, Woodworth and Pratt2009, Paxton et al. Reference Paxton, Gorresen and Camp2013). Populations of the endangered birds have declined in both the central windward and Ka‘ū regions, and where extant on the Kona coast have also declined. The only exceptions to the declining trends in the common birds were stable to increasing trends in Hawai‘i ‘Amakihi and ‘Apapane.
The trends estimated by the two approaches (state-space and log-linear regression) are not contradictory, and the slopes of the regressions are similar in most cases (Tables 2 and 4), but there is less certainty of trend direction in the state-space approach. The ternary plots (Figure 2) illustrate that with the log-linear trend assessment most species portrayed either stable or increasing trends. In the ordinary log-linear method, process error is assumed to be zero and the slope is constrained to be constant, so only very “noisy” time series in which both increasing and declining slopes could be fitted yield an inconclusive result. In the state-space models the overall trend is indicated by the posterior distribution of the mean of the slope (Kéry and Schaub Reference Kéry and Schaub2012). Because the slope is allowed to vary among years, both positive and negative (and neutral) mean overall slopes are better able to fit the observed abundances, but inconclusive results on mean slopes are more likely. If, as is biologically likely, the slope does change over the course of the time series (e.g. populations fluctuate over time), then interpreting the ordinary log-linear slopes leads us to be overly confident in our assessment of long-term trends.
As an example Hawai‘i ‘Ākepa in the open forest appears to deviate from a linear model by gradually increasing, then gradually declining across the 26-year time series (Table S2) with an overall non-significant increase. In the log-linear regression model the posterior distribution of the slope showed strong evidence of a neutral trend, with some slight evidence for an increase and negligible evidence of a decrease. In the state-space model there was weak evidence for all three trends, placing the distribution in the centre of the ternary diagram, indicating the data are inconclusive of an overall trend or stability for the entire time series. Therefore, inconclusive results may indicate that the time series duration or the magnitude of change were insufficient to determine a definitive trend. An alternative to long-term trend assessment, the time series may benefit from being broken up into smaller components reflecting different population trajectories, although there is only weak evidence that the time series possesses break points (Camp et al. Reference Camp, Pratt, Gorresen, Woodworth and Jeffrey2014). However, breaking up a time series to evaluate multiple trends should be done carefully, with objective or justifiable break points used to evaluate changing trajectories.
Another consideration for long-term surveys of bird species is how their detectability may change over time through changes in habitat, bird density, and interactions with other species. Hakalau Forest NWR has been the focus of intensive restoration work, including fencing and removal of non-native ungulates (U.S. Fish and Wildlife Service 1996, Maxfield Reference Maxfield1998, Hess et al. Reference Hess, Jeffrey, Ball and Babich2006, Reference Hess, Jeffrey, Pratt and Ball2010), controlling invasive plants, and developing a native plant propagation programme to accelerate forest bird habitat recovery in open pastures (Hakalau Forest NWR, unpubl. data). This multi-faceted approach to restoring degraded forest habitat has increased the extent and density of forest and appears to have benefitted all birds given the stable to increasing trends in the once degraded, open forest. However, the increased vegetation density has changed the structure of the forest in ways that have implications for long-term surveys. For example, trends in the detection-corrected abundances were more conclusive than those for uncorrected counts (Figure 2, bottom panel). One reason for this may be that as the forest recovers and the understorey develops it has become more difficult to count birds. The differences in the trends of the state-space model between uncorrected counts and detection-corrected abundances were small in the closed forest where the thick undergrowth may not have changed much over the past 13 years, and the uncorrected count index and detection-corrected abundances appear to track each other reasonably well. Much greater change in the difference in population trends was observed in the once open forest (which had been more impacted by ungulates) where there appeared to be a shift in how detectable a species was through time. For example, ‘Ōma‘o detection probabilities have decreased since 1987, although the ratio of birds seen to those heard was inconsistent (Camp et al. Reference Camp, Pratt, Gorresen, Jeffrey and Woodworth2010). We included trends analyses of the uncorrected counts as an index because many monitoring programmes rely on simple counts to track changes in populations over time. However, index-based methods should be avoided (Anderson Reference Anderson2001, Skalski et al. Reference Skalski, Ryding and Millspaugh2005) as counts of birds are an unreliable measure of the actual number of birds present if the index and true abundance do not track each other (see Burnham Reference Burnham1981, Barker and Sauer Reference Barker and Sauer1995). Although trends in the uncorrected counts and detection-corrected abundances were generally similar, the uncorrected count index assumed that detection probabilities were invariant over time and space (Skalski et al. Reference Skalski, Ryding and Millspaugh2005). Thus, while abundances estimated with distance sampling methods are robust to marginal differences in detection probabilities when applying a globally fit detection function (Burnham Reference Burnham1981), even minor differences may adversely affect the uncorrected count index (Skalski et al. Reference Skalski, Ryding and Millspaugh2005).
Implications for incorporating state-space analyses
Hawaiian forest birds have been monitored using archipelago-wide standardised surveys for almost 40 years, 1976 to present (Camp et al. Reference Camp, Reynolds, Gorresen, Pratt and Woodworth2009). This long time series has been useful in understanding status and population trends of individual species and communities, but it is important to continually evaluate new techniques for improving surveys and their inference. Accurate estimates of population size are needed for reliable trend assessment, gauging conservation goals, and are critical for other modelling efforts that require accurate abundance numbers (e.g. integrated population modelling). State-space models can improve assessment of bird count time series because they partition year-to-year changes in population estimates into process variation and observation error (Humbert et al. Reference Humbert, Mills, Horne and Dennis2009, Knape et al. Reference Knape, Jonzén and Sköld2011), and thus are trying to estimate “true” population abundances. Partitioning the observed variation can be difficult as the process is data demanding and is reliant on the assumption that observation errors will be independent from one time point to the next (Kéry and Schaub Reference Kéry and Schaub2012). If this assumption fails then the model is unable to partition variance correctly, which may result in inconclusive or incorrect results. When variance is portioned correctly, applications of state-space models provide more biologically reasonable abundance estimates (Kéry and Schaub Reference Kéry and Schaub2012), and provide a more detailed evaluation of long-term trends by accounting for short-term increases or decreases (Humbert et al. Reference Humbert, Mills, Horne and Dennis2009). A formal comparison of performance among modelling approaches of independent and serial autocorrelated linear regression and state-space models would clarify which circumstances justify a particular modeling approach. This could be accomplished either through a multi-model information theoretic approach, simulation study, an assessment of out-of-sample predictive performance, or a hypothesis test as to whether the process variance is zero. It is worth noting that both of the trend assessment methods we have used (log-linear regression or state-space regression) assume that the abundance estimates produced by program Distance are without error. This is not the case since the detection-corrected estimates have uncertainties of their own due to lack-of-fit in the detection functions relative to natural variation in the raw count data. Incorporating the error estimates from fitting a detection function as priors for a Bayesian state-space model may provide additional improvement to the techniques we have described here.
Supplementary Material
The supplementary materials for this article can be found at journals.cambridge.org/bci
Acknowledgements
We thank the Refuge managers and field biologists who collected the bird survey data, and the interns that assisted with data preparation. This manuscript was improved by comments from Jeff Hatfield, Steffen Oppel, Nat Seavy, and an anonymous referee. Any use of trade, product, or firm names in this publication is for descriptive purposes only and does not imply endorsement by the U.S. Government. This study was funded by the U.S. Fish and Wildlife Service Inventory and Monitoring Program, Fort Collins and the U.S. Geological Survey-Pacific Island Ecosystems Research Center.


