


INTRODUCTION
Influenza is an acute respiratory tract infection caused by influenza viruses. The most commonly involved genera are influenza viruses A and B [Reference Cox and Subbarao1]. Influenza A viruses are further divided in subtypes – mainly A(H1)pdm09 and A(H3) in recent influenza seasons – and influenza B viruses are classified in lineages. In the Northern hemisphere, these viruses are responsible for the yearly influenza epidemic that infects a substantial proportion (~20%) of the population during winter [Reference Hayward2]. Although most cases of infection will be asymptomatic or suffer a relatively mild illness, the large numbers of infected inviduals result in large numbers of severe cases and deaths every season [Reference Cox and Subbarao1, Reference Nicholson, Wood and Zambon3].
The epidemiology of seasonal influenza is influenced by age on different levels. First, the highest notification rates are usually reported in younger age groups [Reference Antonova4, Reference Poehling5]. Second, the clinical presentation of the disease varies across age groups [Reference Cox and Subbarao1, Reference Hayward2]. The typical sudden onset of fever accompanied by headache, malaise, myalgia and upper respiratory symptoms seen in adults and adolescents is not as often observed in children or elderly people [Reference Cox and Subbarao1]. Third, adults aged ⩾65 years are more at risk for complications, hospitalizations and death [Reference Cox and Subbarao6, 7]. Fourth, there is some evidence that some age groups play a more prominent role in transmitting the virus. It has been suggested that children may play an important role in household transmission [Reference Viboud8], that they may even be a driver for the spread of influenza epidemics, although the magnitude of children's contribution remains controversial [Reference Schanzer, Vachon and Pelletier9]. Finally, immunity against influenza is likely to differ across age groups because of different previous exposure to influenza viruses as highlighted during the 2009 pandemic when elderly people were less affected [Reference Karageorgopoulos10], different vaccination policies [Reference Kanitz11] and different vaccine effectiveness [Reference Kissling12]. Seasonal vaccination is recommended for risk groups, including the elderly, in most European Union/European Economic Area (EU/EEA) countries, but children are included only in a minority of Member States [Reference Kanitz11]. Low vaccine effectiveness has been reported in recent influenza seasons, especially in older age groups [Reference Kissling12].
Circulating influenza strains influence the age distribution of infection, disease and severe outcomes of each season. A recent study carried out in the UK showed that the risk of symptomatic disease tends to decrease with age for influenza A and children have higher rates during influenza B waves [Reference Hayward2]. The A(H1)pdm09 subtype appears to have infected children first with adolescents and young adults being significantly affected only in the second wave of the 2009 pandemic [Reference Hayward2]. Some influenza subtypes, such as influenza A(H3N2), could be associated with a higher severity, especially in older age groups [Reference Kaji, Watanabe and Aizawa13, Reference Wie14] and in long-term healthcare facilities [Reference Lee, Mukhi and Drews15]. Influenza types and subtypes may have an impact on the age distribution of hospitalized cases [Reference Beauté16, Reference Bolotin17], but this is not well documented in primary care.
Influenza surveillance in Europe, with the integration of clinical and virological data as its cornerstone, has a long history [Reference Fleming, van der Velden and Paget18]. Virological and syndromic surveillance data [mostly influenza-like illness (ILI) but also acute respiratory illness (ARI)] are collected through national networks of sentinel primary-care providers. Aggregated numbers by age group are available for ILI/ARI, but not for the virological data.
The objectives of this study were to (a) describe age-specific differences in the distribution of influenza viruses for the influenza season 2012/2013, and (b) compare age distributions of influenza-positive sentinel cases and ILI/ARI cases.
METHODS
The surveillance of influenza in Europe is performed by the European Influenza Surveillance Network (EISN) under the coordination of the European Centre for Disease Prevention and Control (ECDC) [Reference Beauté16].
At the end of the influenza season 2012/2013, all EISN laboratories were invited to submit a subset of their data for this season. The variables were limited to reporting week, patient age and influenza type and subtype. For the purpose of this analysis, both dual influenza infections and infections with influenza virus type C were excluded. ILI and ARI data for the 2012/2013 season were obtained from the European Surveillance System (TESSy) database hosted at ECDC. EISN members are recommended to use the EU case definitions for ILI and ARI [19]. If both ILI and ARI were available, ILI was preferred. The age groups analysed were 0–4, 5–14, 15–64 and ⩾65 years.
For the description of the influenza season 2012/2013, pooled virological data was extracted from TESSy for the 29 EISN countries.
Age distributions of influenza-positive sentinel cases and ILI or ARI notifications were compared at country level. Influenza type and subtype distribution between age groups was compared at European level. In countries with age-specific specimen denominator data, the proportion of influenza-positive specimens was compared across age groups at country level. Overall dominance of virus type and subtype was compared with age-specific dominance at country level. Dominance was defined as a proportion of an influenza virus type or subtype ⩾60%.
Testing of differences was done with χ 2 or Fisher's exact tests with the level of significance set at P < 0·05.
RESULTS
Participating countries and available data
Twelve of 29 EISN Member States reported age-specific data for 7890 positive specimens during the reporting period from week 40/2012 to week 20/2013. Most participating countries reported ILI cases, but France and Bulgaria only reported ARI (Table 1). In nine countries, ILI/ARI data were available by age group (Table 1). Nine countries were able to provide denominators with the number of tests performed (Table 2). Twenty-one co-infections and two cases with a positive test for influenza virus type C were excluded. Information on age was not available for 18 cases from six countries. Finally, 7849 cases (99%) were kept in the analysis.
Table 1. Age distribution of influenza-positive sentinel specimens and ILI/ARI cases by country, 12 European Union countries, influenza season 2012/2013
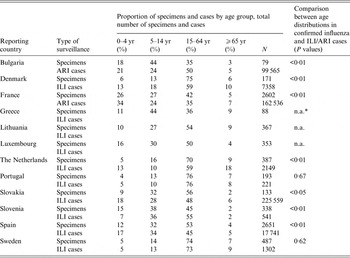
ILI, Influenza-like illness; ARI, acute respiratory illness.
* Comparisons were not applicable (n.a.) where syndromic cases were not reported by age group.
Table 2. Age distribution of the proportion of influenza-positive specimens by country, nine European Union countries with age-specific specimen denominator data, influenza season 2012/2013

Influenza season 2012/2013
At the EU/EEA level, the 2012/2013 influenza season started about week 49/2012, had a prolonged peak between week 4/2013 and week 8/2013 and lasted until week 16/2013 (Fig. 1a ). The epidemic peak occurred in week 6/2013, when 1632 of the 2607 sentinel swabs collected (63%) tested positive for influenza virus in 29 countries. From week 40/2012 to week 20/2013, these 29 countries tested 33 819 specimens, of which 15 744 (47%) tested positive for influenza virus.

Fig. 1. Number of influenza-positive sentinel specimens and percentage* by type, (sub)type and week. (a) European Union/European Economic Area (EU/EEA), (b) 12 EU countries†, week 40/2012 to week 20/2013. (* Percentages are displayed in weeks where at least 50 influenza-positive specimens were reported; † Bulgaria, Denmark, France, Greece, Lithuania, Luxembourg, The Netherlands, Portugal, Slovakia, Slovenia, Spain, and Sweden.
Similarly, in the 12 participating countries, the 2012/2013 influenza season started about week 49/2012, had a prolonged peak between week 4/2013 and week 8/2013 and lasted until week 16/2013 (Fig. 1b ). In week 7/2013, at the peak of the epidemic, 892 of the 1336 sentinel swabs collected (67%) tested positive for influenza virus. From week 40/2012 to week 20/2013, the 12 participating countries tested 16 508 specimens, of which 8076 (49%) tested positive for influenza virus.
In the 12 participating countries as well as in all EU/EEA countries, the distribution of influenza virus (sub)types over the season showed an overall predominance of influenza B virus with an increase over time (~70% of influenza-positive specimens were B virus for week 13/2013). Influenza A(H1)pdm09 virus peaked in week 2/2013 when it accounted for 40% of all influenza-positive specimens while the proportion of A(H3) virus was near or below 20% for most of the season (Fig. 1a , b ).
Influenza detections and clinical diagnoses by age group
Of the nine countries for which ILI/ARI data were available by age group, seven had an age distribution based on influenza-positive sentinel specimens that was statistically different from the one observed for ILI/ARI (Table 1). With the exception of Slovenia, the proportion of influenza-positive specimens in the ⩾65 years age group was systematically lower than the proportion of ILI/ARI.
The proportion of tested specimens by age group was statistically different from the one observed for ILI/ARI in all eight countries for which both number of tested specimens and ILI/ARI data were available by age group. However, in all these eight countries the 15–64 years age group accounted for both the highest number of ILI/ARI and tested specimens.
The proportion of influenza-positive specimens significantly differed accross age groups in six of the nine countries that provided age-specific specimen denominator data (Table 2). In some countries, substantial differences were observed as for The Netherlands, where 16% of specimens were positive in the 0–4 years group compared to 49% in the 5–14 years group.
Distribution of influenza virus type and subtype by age group
Of the 7849 positive specimens reported with information on age, 1227 (16%) were from the 0–4 years age group, 2161 (28%) from 5–14 years, 4067 (52%) from 15–64 years and 394 (5%) from cases aged ⩾65 years. In cases aged 5–14 years, 75% tested positive for influenza B virus whereas all other age groups had an even distribution of influenza A and B viruses (Fig. 2). Of the influenza A viruses subtyped, A(H1)pdm09 viruses dominated over A(H3) viruses in all cases up to age 64 years (68% vs. 32% overall) whereas in those aged ⩾65 years, A(H3) viruses dominated (65% vs. 35%). Overall, the distribution of the virus types and subtypes were significantly different in age groups (P < 0·0001).

Fig. 2. Influenza virus type and subtype distribution by age group, 12 European Union countries, influenza season 2012/2013.
In most countries, dominant virus (sub)type varied accross age groups (Tables 3 and 4). Of note, a predominance of influenza B virus was observed in most countries (10/12) in the 5–14 years age group while no clear pattern emerged in the other age groups. Spain was the only country where predominance of the same type was observed in all age groups.
Table 3. Age distribution of influenza-positive specimens by influenza virus (sub)type and country, 12 European Union countries, influenza season 2012/2013

Table 4. Dominant influenza virus type or subtype by age group and country, 12 European Union countries, influenza season 2012/2013
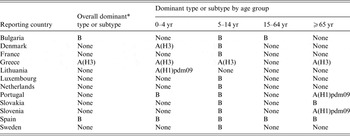
* Dominance was defined as ⩾60%.
DISCUSSION
In Europe, the influenza season 2012/2013 was characterized by a co-circulation of three influenza virus types and subtypes, offering a good opportunity to determine whether the distribution of types and subtypes differs accross age groups [Reference Snacken20].
Our findings suggest that the overall distribution of types and subtypes may mask substantial differences between age groups. Thus, A(H3) – a subtype frequently associated with a higher morbidity than the previous seasonal A(H1) and B viruses [Reference Kaji, Watanabe and Aizawa13, Reference Wie14] – was especially prevalent in cases aged ⩾65 years. Conversely, influenza B virus predominated in children aged 5–14 years, which supports prevous findings from Germany and the UK [Reference Hayward2, Reference Sauerbrei21]. The remaining age groups experienced a more evenly distributed mixed season of A and B viruses. Of note, country-specific profiles of dominance and age-specific proportions of influenza virus types and subtypes were markedly different.
Age-specific influenza surveillance data should be interpreted with caution. In most countries, the age distribution of ILI/ARI differed from the age distribution of cases with confirmed influenza. Our findings suggest that sampling strategies may have slighly differed accross age groups. The relative overrepresentation of positive specimens collected in adults aged 15–64 years may be suggestive of differences in health-seeking behaviour. Since both clinical and virological indicators are collected through the same sentinel scheme, there are at least two additional possible explanations. First, the contribution of other respiratory pathogens differs across age groups. Besides influenza A and B viruses, parainfluenza virus and respiratory syncytial virus (RSV) contribute to ILI estimates [Reference Bollaerts22]. Specifically, the burden of RSV in children aged <5 years is now well established [Reference Nair23] and there is increasing evidence suggesting that it might also cause a substantial amount of illness in the elderly [Reference Falsey24]. Second, the varying proportion of positive specimens across age group could be explained by differential virus shedding by age or virus (sub)type. A recent study carried out in Germany could not find any evidence supporting this latter hypothesis [Reference Suess25]. Regardless of the reason why age distributions differs between clinical and confirmed cases, this study reminds us that ILI/ARI rates by age group should be interpreted very cautiously in the absence of virological data. In countries where ILI/ARI data are not available by age group, influenza surveillance would therefore benefit from collecting virological data by age group.
If confirmed over several influenza seasons, these findings may have important implications for vaccination policies. The first objective of influenza vaccination is to prevent severe disease and death. It is now well established that elderly people have the highest mortality risk and therefore constitute a well-identified risk group [Reference Mertz26]. Previous studies have suggested that the extension of vaccine coverage to younger age groups would increase protection in the elderly [Reference Jordan27, Reference Weycker28]. In seasons with different dominating strains accross age groups, the impact of such an extension may well be limited.
The relatively low number of specimens collected in some countries was an important limitation of this study, as some statistical analyses were not possible. For the same reason, it was not possible to look at the dynamics of transmission across age groups. In addition, such analysis would probably have to include several seasons. This study also underlined the need to document the sampling strategies in EISN countries as the selection of patients to be swabbed may not be systematic in all surveillance schemes.
The overall distribution of influenza viruses in the 29 EISN Member States under surveillance was similar to the one observed in the 12 countries participating in this study, suggesting that our findings may also be valid for the rest of the EISN Member States.
CONCLUSION
This study demonstrates the added value of including age group data in routine virological influenza surveillance because they provide a better indication of the age-specific distribution of influenza infection and its causative virus types and subtypes than pooled virological data or age-specific ILI/ARI rates. With better estimates of the burden of influenza in different age groups, it would help identify target groups for preventive measures. Last, similar data collection in the coming years could help improve our understanding of the dynamics and transmission of influenza. Such data would not necessary have to be collected every week, but could be collected once after every season. This would also constitute a step towards a more integrated clinical and virological influenza surveillance.
ACKNOWLEDGEMENTS
We thank collaborators from the European Influenza Network (EISN) and from the European Reference Laboratory Network for Human Influenza (ERLI-Net). We are particularly grateful to Ani Teodosieva (Bulgaria), Thea Kølsen Fischer, Jesper Rønn, Bente Andersen (Denmark), Anne Mosnier, Martine Valette, Isabelle Daviaud, Françoise Stoll Keller, Jean-Marie Cohen, the GROG network (France), Andreas F. Mentis, Afroditi Moutousi (Greece), Matthias Opp (Luxembourg), Gé Donker, Marit de Lange, Pieter Overduin, Marcel Jonges (The Netherlands), Pedro Pechirra, Patricia Conde, Paula Cristovão, Baltazar Nunes (Portugal), Amparo Larrauri, Francisco Pozo, Concha Delgado, Silvia Jiménez-Jorge, Inmaculada Casas, the Spanish Influenza Surveillance System (Spain), and Chantal Quinten (ECDC).
DECLARATION OF INTEREST
None.


 Open access