


The limited resources on our planet pose challenges for future food supply and food consumption patterns( Reference Rockstrom, Steffen and Noone 1 , Reference Garnett 2 ). Typically, 20–30 % of the environmental impact of final household consumption relates to food, and meat and dairy have a particularly large share( Reference Tukker, Goldbohm and Koning 3 ). To lower the burden of human consumption on the environment, consumption patterns need to change from a diet rich in animal foods to one with a larger share of plant-based foods. Such a diet is closer to health guidelines and more environmentally friendly than currently consumed diets( Reference Westhoek, Lesschen and Rood 4 ). The shift may also benefit human health( Reference Macdiarmid, Kyle and Horgan 5 – Reference Tilman and Clark 7 ). This gives an opportunity to combine sustainability messages with public health messages. The evidence base for what direction current food consumption patterns should change is under development. Dietary patterns need to be identified that provide us the many nutrients in appropriate amounts for our health and which are sustainable( Reference Garnett 2 , Reference Riley and Buttriss 8 ).
The consumption of meat and dairy has a major impact on the environment( Reference Garnett 2 ). Modelling studies suggest that public health and climate change dietary goals are in broad alignment when the consumption of meat and dairy products is reduced( Reference Scarborough, Allender and Clarke 9 ). A scenario with 50 % reduction in meat and dairy replaced by fruit, vegetables and cereals has the largest impact on deaths from CHD, stroke and cancer( Reference Scarborough, Allender and Clarke 9 ). Reduction of the current high consumption of meat and dairy and/or replacement by plant-based substitutes is therefore an option for change. Plant-based substitutes provide mostly a more environmentally friendly alternative( Reference Macdiarmid, Kyle and Horgan 5 , Reference Carlsson-Kanyama and Gonzalez 10 , Reference Baroni, Cenci and Tettamanti 11 ). A reduction of meat and dairy consumption could benefit health by lowering the intake of SFA and, when replaced by plant foods, increasing fibre intake( Reference Scarborough, Allender and Clarke 9 , Reference Craig 12 ). Due to the role of meat or dairy as supplier of essential vitamins and minerals in currently observed diets( Reference Millward and Garnett 13 , Reference Van Rossum, Fransen and Verkaik-Kloosterman 14 ), nutritional challenges are foreseen for Ca, Fe, Zn, riboflavin and vitamin B12 ( Reference Millward and Garnett 13 ). This may be especially important for children because of growth requirements. To our knowledge, the shift in (micro) nutrient intakes from an animal-based towards a plant-based diet has not been quantified for children.
The objective of the present study was to model the impact of more sustainable diets with less or no meat and dairy products on nutrient intakes in young Dutch children. Meat and dairy foods were replaced by plant-based foods. Habitual intakes of energy, SFA, protein, fibre, Ca, Fe, Zn, thiamin and vitamin B12 were evaluated for a reference as well as a ‘less meat and dairy’ and a ‘no meat and dairy’ scenario.
Materials and methods
Data on food consumption, nutrient composition and environmental impact
Data from the Dutch National Food Consumption Survey (DNFCS) – Young Children (2005–2006)( Reference Ocké, van Rossum and Fransen 15 ) were used to estimate total nutrient intakes for the reference scenario (baseline consumption). This survey is the most recent food consumption survey in the Netherlands for children aged 2–6 years. Briefly, parents/caretakers of 1279 children recorded food consumption with a food record on two non-consecutive days (all days of the week were represented equally) and filled in a general questionnaire including questions on dietary supplement use.
For the evaluation of environmental impact, two environmental indicators were chosen: (i) greenhouse gas emissions (GHGE), i.e. kg CO2-equivalents (CO2e)/person per d; and (ii) land use of foods consumed, i.e. m2·year/person per d. Data for these parameters for meat, dairy and replacement products were derived from existing publications of Blonk Consultants, an independent advisory body on the environment( Reference Blonk, Ponsioen and Kool 16 ). Existing data are calculated in life-cycle assessments and include all stages from farm to fork.
Replacement scenarios
The impact of replacement was evaluated comparing two replacement scenarios with the reference scenario: the ‘less meat and dairy’ and the ‘no meat and dairy’ scenario. In the ‘less meat and dairy’ scenario, 30 % of meat and dairy consumption (cheese and milk products) was replaced by plant-derived substitutes. In the ‘no meat and dairy’ scenario, all meat and dairy consumed was replaced by plant-derived substitutes. Meat and dairy foods were defined as foods fully or predominantly consisting of meat or dairy. Replacement foods needed to be more ecologically sustainable (taking land use and CO2e as indicators) than meat and dairy( Reference Blonk, Ponsioen and Kool 16 ). For all foods, the amount (in grams) of the originally consumed food was replaced by exactly the same amount of replacement food.
To evaluate a replacement of meat and dairy by plant-derived products while staying close to the current eating habits, eligible replacement foods were foods with similar use in terms of the moment of consumption (breakfast, lunch, dinner and between meals). For example, cheese consumed as a snack in the evening was not replaced by a sandwich filling, but by a plant-derived snack. The top three most-consumed plant-derived replacement food groups were chosen from the Dutch Food Composition Database( 17 ). Meats consumed at dinner were replaced by a variety of plant-derived meat substitutes (soya foods, 28 % (twice weekly); vegetarian meat, 58 % (four times weekly); pulses 14 %, (once weekly); see Table 1). This is in line with recommendations for a vegetarian diet( 18 ). Meat or cheese eaten as sandwich fillings was randomly replaced by a variety of plant-derived sandwich fillings; one-third was replaced by savoury (e.g. peanut butter), one-third by sweet (e.g. chocolate sprinkles) and one-third by vegetarian fillings (e.g. vegetarian ham). Dairy foods were replaced by similar soya-based foods, e.g. semi-skimmed milk was replaced by soya milk, and milk desserts by soya milk desserts.
Table 1 Average daily consumption (frequency and amount) at baseline of the top three most-consumed products consisting of meat or dairy and products used as a substitute, their corresponding nutritional composition per 100 g of product, and their corresponding environmental impact per 1 kg of product
– indicates not present in NEVO-Tabel 2011( 17 ).
* The number of times the food was consumed during the 2558 interview days of 1279 children.
† Snacks consumed after dinner (food consumption code 11).
For meat consumed at dinner, three categories of substitutes replacing meat at dinner were identified: soya products, vegetarian meat and pulses. For each consumed meat-at-dinner product per person per observed day, a number between 0 and 1 was randomly selected. In the 100 % substitution scenario, if this number fell into the range 0–0·280, a soya product was selected as a substitute. If the number fell into the range 0·281–0·865 or 0·866–1·000, vegetarian meat and pulses were chosen as a substitute, respectively. In the 30 % substitution scenario, the random numbers 0–0·333 were used only to allocate substitutes. This means that numbers 0–0·093 were substituted with a soya product, numbers in the range 0·094–0·286 were substituted with vegetarian meat, and numbers 0·287–0·333 were substituted with pulses. Within the group ‘vegetarian meat and pulses’, a further subdivision was made for different food products, again taking into account the current consumption frequency in DNFCS – Young Children. The random number allocation was repeated ten times for each scenario. Since the differences in mean nutrient intakes between these replicates were very small (CV<1 %), one allocation was randomly chosen to represent that scenario.
For sandwich fillings, a similar procedure was applied with three categories of substitutes: savoury (e.g. peanut butter), sweet (e.g. chocolate sprinkles) and vegetarian fillings (e.g. vegetarian ham). Each category had a one-third chance to be chosen and a subdivision per category was made based on current consumption frequency in DNFCS – Young Children.
Nutritional and environmental impact
Total intakes, for the reference scenario and the two replacement scenarios, were calculated by the summation of the intakes of all foods consumed per child, per observation day, resulting in observed intakes with intra-individual and inter-individual variances. For environmental impact, the summation was restricted to meat and dairy and their plant-based replacement foods. In the tables, mean intakes are reported unless otherwise stated. Results are presented in age–gender groups (girls aged 2–3 years and 4–6 years; boys aged 2–3 years and 4–6 years).
To evaluate whether intakes are adequate on a population level, it is generally considered appropriate to use the Estimated Average Requirement (EAR)( Reference Carriquiry 19 ). The EAR cut-point method estimates the prevalence of inadequate intakes as the proportion of the population with usual intakes below the EAR. The EAR is defined as the intake adequate for 50 % of the population. The use of this technique is based on a number of assumptions: (i) intakes and requirements for the nutrient must be independent; (ii) the distribution of requirements must be symmetric around its mean, the EAR; and (iii) the variance of the distribution of requirements should be smaller than the variance of the usual intake distribution( Reference Carriquiry 19 ). The EAR cut-point method is valid for all nutrients presented in the current paper except for fibre and SFA. The EAR was also appropriate for Fe as the Box–Cox transformation resulted in a normal distribution. SFA and Zn intakes were evaluated via the Tolerable Upper Intake Level (UL). For fibre intake, the Adequate Intake (AI) was available, which allows a qualitative evaluation about the adequacy. For median intakes at or above the AI, the prevalence of inadequate intake is considered low( Reference Ocké, van Rossum and Fransen 15 , 20 ). The reference values were obtained primarily from the dietary reference values of the Health Council of the Netherlands (for SFA, protein( 21 )) and the Institute of Medicine (for Ca( 22 ), thiamin and vitamin B12 ( 23 ) and Fe, Zn( 24 )) as well as from the European Food Safety Authority (for fibre( 25 ) and upper limits for Zn( 26 )). The Health Council of the Netherlands established an AI for Ca, thiamin( 27 ), vitamin B12 ( 28 ), Fe and Zn( 29 ). The Institute of Medicine established an EAR for these nutrients; therefore, we decided to use these dietary reference intakes in our study.
Statistical methods
Dietary reference intakes are generally related to health effects associated with chronically too-low intakes. Therefore, the long-term intake, also called the habitual or usual intake, is of interest rather than the acute dietary exposure. In the DNFCS food consumption is measured in the short term with repeated 24 h food records. Such data include, besides the inter-individual variation, intra-individual variation (day-to-day variation) and as a consequence the intake distribution is wider and proportions of the population below cut-points are overestimated. To overcome this, the habitual intakes of macro- and micronutrients (energy (kJ/d), SFA (percentage of daily energy intake (E%)), protein (g/d), fibre (g/d), Ca (mg/d), Fe (mg/d), Zn (mg/d), thiamin (mg/d) and vitamin B12 (µg/d)) were estimated by statistical correction for the intra-individual variation using SPADE (Statistical Program to Assess Dietary Exposure)( Reference Dekkers, Verkaik-Kloosterman and van Rossum 30 ). The habitual intake distributions were modelled as a function of age separately for boys and girls. The habitual intake was estimated separately for intake from food (separately for users and non-users of dietary supplements) and intake from dietary supplements and thereafter combined to get the estimate of the total nutrient intake( Reference Dekkers, Verkaik-Kloosterman and van Rossum 30 ). The population’s habitual total nutrient intake distributions were compared with dietary reference intakes, and the proportion of inadequate nutrient intakes was calculated in the reference and in the two replacement scenarios. The 95 % confidence bounds were estimated using the bootstrap method with 1000 iterations. Significant differences between scenarios were evaluated by non-overlapping 95 % CI. The results were weighted for small deviances in sociodemographic characteristics, days of the week and season of data collection, in order to give results that are representative for the Dutch children in the Netherlands in 2006 and representative for all days of the week and all seasons. Unless stated otherwise, the statistical software package SAS version 9·1·3 was used for modelling.
Results
Food consumption and composition
Table 1 shows the consumption, composition and environmental impact of selected meat and dairy foods and their replacements. The upper half of Table 1 shows the average daily consumption (person-days of consumption and amount consumed on consumption days) of the top three most-consumed meat and dairy foods. The lower part of Table 1 shows the top three most-consumed plant-derived substitutes used as replacers in the present study, as well as the frequency of consumption and their average daily consumption for consumers at reference. Vegetarian meat and other plant-derived substitutes are rarely consumed in the reference scenario. The replacement sandwich fillings such as peanut butter and chocolate nut spread are consumed frequently by these children. Meat and dairy and plant-based imitation replacement foods (e.g. vegetarian meat and soya dairy substitutes) contain similar amounts of energy, protein and thiamin. Most of the commercially available meat or dairy substitutes are supplemented with Fe, vitamin B12 (for meat replacers such as GoodBite®, Vivera® and Tivall products®)( 31 ) and Ca (for dairy replacers)( 32 ). Pulses contain less protein than meat. The SFA and Zn contents are higher in meat, meat products and cheese compared with replacement foods. On the other hand, fibre content was higher in vegetarian meat and pulses than in meat products and cheese. Plant-derived foods have a similar Fe content compared with meat. However, Fe bioavailability in plant-derived products is lower than in animal-derived products( Reference Hurrell and Egli 33 ).
Environmental impact
The average land use and GHGE were evaluated for meat and dairy consumption and plant-based replacements only. Consequently, the figures do not reflect the impact of total daily diets. Land use and GHGE of meat are higher than of meat substitutes, although the type of meat is important for environmental impact, with a higher impact for beef, followed by pork and lowest for chicken. The environmental impact of 1 kg of cheese is similar to that of 1 kg of pork. Dairy milk is about 0·3 m2·year/kg and 0·9 kg CO2e/kg higher in environmental impact compared with soya milk.
The average land use and GHGE for a child’s daily consumption of meat, dairy and plant-based substitutes in the reference situation was 0·82 m2·year and 0·84 kg CO2e, respectively. In the ‘less meat and dairy’ scenario, the land use and GHGE was 0·68 m2·year and 0·67 kg CO2e, respectively, per child per d. When all meat and dairy consumptions were replaced, the land use was reduced to 0·46 m2·year and GHGE to 0·36 kg CO2e per child per d, both compared with the reference situation.
Habitual macronutrient intakes and comparison with requirements
Table 2 shows the mean intakes of energy and various macronutrients (SFA, protein and fibre) of the reference and the two replacement scenarios. Figure 1 shows the average percentage change in macro- and micronutrient intakes for the ‘less meat and dairy’ and the ‘no meat and dairy scenario’ compared with the reference. In general, daily energy and nutrient intakes increased with age, and intakes were higher for boys than for girls. In the reference scenario, the intake of total energy ranged from 5509 to 5814 kJ/d for girls and boys aged 2–3 years and from 6373 to 6673 kJ/d for girls and boys aged 4–6 years, respectively. The ‘less meat and dairy’ and ‘no meat and dairy’ scenarios did not significantly change the mean energy intake.
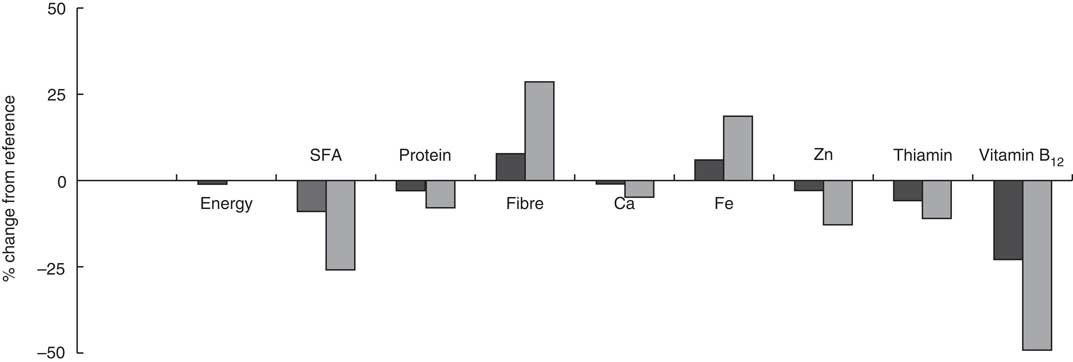
Fig. 1 Percentage change in nutrient intake for the ‘less meat and dairy’ scenario (![]() ) and the ‘no meat and dairy’ scenario (
) and the ‘no meat and dairy’ scenario (![]() ), compared with the reference, in 1279 Dutch children aged 2–6 years
), compared with the reference, in 1279 Dutch children aged 2–6 years
Table 2 Habitual mean intakes (and 95 % CI) of macronutrients (energy (kJ/d), SFA (E%), protein (g/d) and fibre (g/d)) in different meat and dairy replacement scenarios for 1279 Dutch children aged 2–6 years, weighted for sociodemographic factors and season

Rec., recommendation; E%, percentage of daily energy intake; UL, Tolerable Upper Intake Level; AI, Adequate Intake; EAR, Estimated Average Requirement.
a,b,cMean values within a row with unlike superscript letters were significantly different (based on the 95 % CI around the mean as estimated using 1000 bootstrap samples).
* Replacement of meat and cheese fillings, meat for dinner, and dairy drinks and desserts by plant-derived substitutes.
† UL for SFA from Health Council of the Netherlands( 21 ).
‡ EAR for protein from Health Council of the Netherlands( 21 ).
§ AI for fibre from EFSA Panel on Dietetic Products and Nutrition and Allergies( 25 ).
|| ad=a large proportion of the population has an adequate intake (median intake is above the AI); pa=median intake is below the corresponding AI, incl=inconclusive (within this age group, some ages have a median intake below and some above the AI).
In the reference scenario, SFA was 11–12 E% in all age–gender groups. The ‘less meat and dairy’ scenario resulted on average in a 9 % reduction and the ‘no meat and dairy’ scenario in a 26 % reduction in SFA intake. In the reference scenario, 83–91 % of the 4–6-year-olds had SFA intakes above the UL of 10 E% as assessed by the Health Council of the Netherlands( 21 ). Replacing meat and dairy with plant-based substitutes resulted in less 4–6-year-old children exceeding the UL. This reduction was 15 % and 72 %, respectively, for the ‘less meat and dairy’ and the ‘no meat and dairy’ scenario. The proportion of boys and girls aged 2–3 years who exceeded the UL for SFA of 15 E%( 21 ) in the reference situation was 2–4 %, and decreased to 0–1 % in the replacement scenarios.
The average protein intake in the reference scenario was 43–52 g/d, depending on age and gender. Meat and dairy replacements of 30 % or 100 % decreased the total protein intake on average by 3 % and 8 %, respectively. Within all scenarios and all age–gender categories, the proportion of children with a habitual protein intake under the corresponding EAR equalled 0 %.
The average habitual intake of fibre within the reference scenario ranged from 12·0 to 14·2 g/d. Girls aged 4–6 years had the highest risk of an inadequate fibre intake comparing their median intake with the AI. Fibre intake increased significantly by 8 % and 29 % within the ‘less meat and dairy’ and ‘no meat and dairy’ groups, respectively. In the ‘no meat and dairy’ scenario, fibre intakes of all age and gender groups were evaluated as adequate.
Micronutrient intakes from food sources and dietary supplements
Table 3 shows the mean daily intakes of various micronutrients (Ca, Fe, Zn, thiamin and vitamin B12) within the reference scenario and the two replacement scenarios.
Table 3 Habitual mean intakes (95 % CI) of micronutrients (calcium (mg/d), iron (mg/d), zinc (mg/d), thiamin (mg/d) and vitamin B12 (µg/d)) from food sources and dietary supplements in different meat and dairy replacement scenarios for 1279 Dutch children aged 2–6 years, weighted for sociodemographic factors and season
Rec., recommendation; UL, Tolerable Upper Intake Level; EAR, Estimated Average Requirement.
a,b,cMean values within a row with unlike superscript letters were significantly different (based on the 95 % CI around the mean as estimated using 1000 bootstrap samples).
* Replacement of meat and cheese fillings, meat for dinner, and dairy drinks and desserts by plant-derived substitutes.
† EAR for Ca from Institute of Medicine( 22 ).
‡ Fe intake was estimated without taking into account difference in bioavailability between animal and plant sources.
§ EAR for Fe from Institute of Medicine( 24 ).
|| EAR for Zn from Institute of Medicine( 24 ).
¶ EAR for thiamin from Institute of Medicine( 23 ).
** EAR for vitamin B12 from Institute of Medicine( 23 ).
†† UL for Zn from EFSA Scientific Committee on Food and Scientific Panel on Dietetic Products Nutrition and Allergies( 26 ).
The daily mean intake of Ca in the reference scenario ranged from 767 to 798 mg for the four age–gender groups. In the reference as well as both replacement scenarios, 0–80 % of the habitual intakes were under the corresponding EAR of 500 or 800 mg/d (for 2–3-year-olds and 4–6-year-olds, respectively). The mean daily intake of Fe increased from 6·6–7·7 mg/d in the reference scenario to 8·0–9·1 mg/d in the ‘no meat and dairy’ scenario, depending on age and gender. A 30 % replacement of meat and dairy resulted on average in a significant increase of 6 % in Fe intake, but Fe was of lower bioavailability. For the reference scenario, the mean Zn intake was 5–6 mg/d in all age–gender groups. Zn intake reduced especially in the ‘no meat and dairy’ scenario by 13 %. The proportion of children with Zn intakes exceeding the UL decreased with meat and dairy replacement. When a replacement of 100 % in meat and dairy was accomplished, almost none of the children aged 2–6 years had habitual Zn intakes above the UL, while 6 % of the girls aged 4–6 years had Zn intakes below the corresponding EAR.
For the reference scenario, thiamin intake was 0·83–0·94 mg/d in all age–gender groups. The proportion of girls aged 4–6 years with an intake below the corresponding EAR was 2 %. Among girls between the ages of 4 and 6 years, a meat and dairy replacement of 100 % decreased the average daily intake of thiamin by 11 % compared with the reference scenario. This decrease resulted in a larger proportion (15 %) of girls aged 4–6 years with an intake below the corresponding EAR. Also in the other age–gender groups, the ‘no meat and dairy’ scenario resulted in more (2–6 %) children with thiamin intakes under the EAR.
In the reference scenario, the mean daily total vitamin B12 intake ranged from 2·7 to 3·0 µg for the four age–gender groups. A significant decrease of on average 23 % and 49 % in daily vitamin B12 intake was calculated in the ‘less meat and dairy’ and ‘no meat and dairy’ scenario, respectively. In the ‘no meat and dairy’ scenario, 0–10 % of the children had a habitual vitamin B12 intake below the corresponding EAR.
Discussion
Shifting towards a more environmentally friendly food consumption pattern helps protect the limited resources of our planet( Reference Freibauer, Mathijs and Brunori 34 ). In the present study, the replacement of meat and dairy consumption (30 % or 100 %) by plant-derived foods was evaluated especially for its impact on the nutrient intakes of children.
In short, we found from our scenario study that partial and full replacement of meat and dairy foods by plant-derived foods resulted in a reduced SFA intake of 9 % and 26 %, respectively, while fibre intake was 8 % and 29 % higher. After 100 % meat and dairy replacement by plant foods, mean intakes of Ca, Zn and thiamin decreased by 5–13 %, and vitamin B12 intake by 49 %, while total intake of Fe was higher but of lower bioavailability. Diets with less meat and dairy were in line with recommendations except for SFA, Ca (all age and gender categories) and Zn. SFA (for boys and girls aged 4–6 years) was above and Ca intake (all age and gender categories) was below recommendations in both replacement scenarios as well as in the reference scenario. In girls aged 4–6 years, the full meat and dairy replacement scenario resulted in 6 %, 10 % and 15 % of children with inadequate intakes for Zn, vitamin B12 and thiamin, respectively.
While the benefits for the planet are evident from the reduced land use and GHGE, and for child health from the lower SFA and higher fibre intakes, there is a risk of too-low thiamin, vitamin B12 and Zn intakes. With the ‘less meat and dairy’ scenario, the intakes are similar compared with the reference situation. With the ‘no meat and dairy’ scenario, the proportion of girls aged 4–6 years with intakes below EAR increased, up to 15 % for thiamin, 10 % for vitamin B12 and 6 % for Zn.
Given the critical role of Zn in normal growth and development and immune function, the fact that dietary Zn fell below the EAR should not be disregarded. Zn deficiency has been reported in diverse populations and age groups, even in Western populations( 35 ). Recent studies on current intakes of European children indicate considerable variation in Zn intake, especially in young girls( Reference Mensink, Fletcher and Gurinovic 36 ). In the USA, children consume recommended amounts of Zn according to two national surveys, the 1988–1991 National Health and Nutrition Examination Survey (NHANES III)( Reference Alaimo, McDowell and Briefel 37 ) and the 1994 Continuing Survey of Food Intakes of Individuals (CSFII)( 38 ). In addition, the Feeding Infants and Toddlers Study (FITS) 2008 showed that the usual intakes of B-vitamins, bone-related nutrients and other micronutrients were adequate relative to the EAR, except for Zn and Fe and in a small subset of older infants( Reference Butte, Fox and Briefel 39 ). On the other hand, thiamin deficiency is rare in industrialised countries. Our study shows that full replacement of meat and dairy may increase the proportion of inadequate intakes. Zn as well as thiamin intakes may be increased by consuming more wholegrain foods (such as bread), pulses and legumes( Reference Sandström 40 ). Furthermore, processing techniques can enhance the bioavailability of Zn because leavening partially breaks down the phytate( Reference Sandström 40 ).
Vitamin B12 intakes lowered substantially by 49 %, with the habitual intakes of 10 % of the girls aged 4–6 years falling below the requirements in the ‘no meat and dairy’ scenario. Data on the adequacy of vitamin B12 intakes and status in children are limited. A recent study showed adequate daily vitamin B12 intakes and status in a representative sample of Canadian children( Reference MacFarlane, Shi and Greene-Finestone 41 ). Vegetarians are at risk for vitamin B12 deficiency due to suboptimal intake of vitamin B12 via animal-based foods. Pawlak et al.( Reference Pawlak, Parrott and Raj 42 ) reported that up to 55 % of vegetarian US children had a too-low vitamin B12 status with higher rates of deficiency reported for children following the vegetarian diet for a longer time.
Challenges were also foreseen for Ca because of the replacement of milk and cheese and for Fe intake because of the replacement of meat( Reference Millward and Garnett 13 ). With the full meat and dairy replacement, however, estimated Ca intake was similar and total Fe intake was even slightly higher compared with the reference. Especially the commercial meat and dairy replacements contain approximately a similar amount of Ca and Fe compared with the foods eaten at reference because they are often enriched. Fe needs further consideration because in the replacement scenarios the majority is from non-haem Fe. Total Fe intake was above the EAR in all scenarios. Non-haem Fe absorption is lower for those consuming vegetarian diets than for those eating non-vegetarian diets. The Institute of Medicine therefore suggested that the Fe requirement for those consuming a vegetarian diet is approximately twofold greater than for those consuming a non-vegetarian diet( 24 ). Applying this to our results showed that Fe intakes in the ‘less meat and dairy’ and ‘no meat and dairy’ scenarios are in line with this recommendation. Advice from the UK focuses on total Fe intake via a healthy balanced diet that includes a variety of foods containing Fe and which should be able to keep Fe intake adequate( 43 ).
For the intakes of SFA and fibre a favourable shift was noted when replacing meat and dairy with plant-based foods. Their replacement by plant-based foods lowered SFA intake by 9 % and 26 % and increased fibre intake by 8 % and 29 % in the ‘less meat and dairy’ and ‘no meat and dairy’ replacement scenarios, respectively. With maximal replacement, the majority of Dutch children would be in line with recommendations for SFA as well as for fibre intake. This is expected to be beneficial for children’s health. In the long term, diets low in SFA and rich in fibre are associated with a reduced risk of CVD, cancer and obesity( Reference Kromhout, Menotti and Kesteloot 44 – Reference Gingras and Beliveau 46 ), at least when studied in adults. The additional fibre may lead to decreased energy and nutrient intakes. Although a lower energy intake would be positive for many Dutch adults, this may not be the case for the 2–6-year-old period of a child’s life, which is a time of rapid growth. Protein intake was sufficient for all scenarios and all age–gender categories. Given the variety of plant-based proteins in the replacement scenarios and high levels of daily protein intake compared with recommendations, it is expected that the provision of essential amino acids is sufficient and in balance. However, this aspect was not addressed in the current calculations.
Recently, studies have focused on the environmental aspects of the adoption of healthy diet recommendations. Adopting healthy diet recommendations reduces the environmental (GHGE and land use) impact compared with current dietary patterns( Reference Meier and Christen 47 , Reference Temme, Toxopeus and Kramer 48 ). In all studies, the consumption of meat and dairy has a major impact on the environment( Reference Garnett 2 ). As far as we know, the nutritional impact of the proposed reduction of meat and dairy was never studied specifically in children. The first studies in adult populations to assess environmental as well as nutritional aspects of food intake simultaneously and optimising diets appear in scientific journals( Reference Macdiarmid, Kyle and Horgan 5 , Reference Temme, Toxopeus and Kramer 48 – Reference Vieux, Soler and Touazi 50 ). In a previous paper we studied the impact of similar replacements in young women on land use, saturated fat and Fe intake( Reference Temme, van der Voet and Thissen 49 ). We estimated reductions in saturated fat intake while the total Fe intake was similar or increased slightly. Other micronutrients were not assessed in the previous study.
The choice of substitutes and their composition is crucial for the nutritional intake estimations in the different scenarios. This type of study must be recognised for having a signalling function. In the case of a shift of children’s diets towards lower intakes of meat and/or dairy, nutritional status analyses are needed to confirm adequacy of intakes of Zn, thiamin, vitamin B12 and probably Fe by the true prevalence of marginal nutritional statuses. Starting from the current consumption patterns of Dutch children, the choice of savoury (e.g. peanut butter), sweet (e.g. chocolate sprinkles) and vegetarian fillings (e.g. vegetarian ham) as replacements for meat or cheese sandwich fillings seems reasonable. The palatability of the replacement foods and the likelihood of their acceptance by young children play a role in eating behaviour and acceptability of certain replacement foods. Savoury (especially peanut butter) and sweet (e.g. chocolate sprinkles) sandwich fillings were consumed frequently in the reference scenario and children are predisposed to prefer sweet tastes( Reference Birch and Fisher 51 ). We replaced meat and dairy with equal weights of the replacement foods. This is realistic for vegetarian meat substitutes and dairy replacers from the point of view of foods with similar use. In the Netherlands, pulses and legumes are not frequently eaten as a meat substitute. More common is to eat pulses like a staple food or as a vegetable. This might explain the relatively high consumed quantity (for consumers). Incorporating pulses in the menu as a main component with no meat added will require adapted food habits. For the scenarios, recent guidelines for ecologically friendly dietary patterns( 18 , 52 , Reference Macdiarmid, Kyle and Horgan 53 ) were considered and substitution foods were chosen that were consumed in similar consumption occasions in the reference situation. From a cultural perspective, expecting the Dutch child population to replace all its meat and dairy consumption seems unrealistic. In this cohort of children, 96 % consumed meat or meat products and 98 % milk and cheese on the interview days( Reference Van Rossum, Fransen and Verkaik-Kloosterman 14 ). There are, on the other hand, more and more semi-vegetarians, which makes the ‘less meat and dairy’ scenario a more realistic one( Reference Dagevos, Voordouw and van Hoeven 54 ). In the present study, a detailed evaluation of the environmental impact of daily diets was not the purpose. Instead, we relied on existing consensus showing that the environmental impact of meat and dairy products is higher than that of plant products( Reference Westhoek, Rood and van de Berg 55 ). Further studies will more specifically address the issue.
We conclude from the current modelling study that the partial replacement of meat and dairy by plant-derived foods is beneficial for children’s health by lowering SFA intake, increasing the fibre content and maintaining similar micronutrient intakes. When full replacements are made, attention is recommended to ensure adequate thiamin, vitamin B12 and Zn in children’s diets.
Acknowledgement
Acknowledgements: The authors thank Marinka Brosens for her assistance in this research project. Financial support: The present study was funded by the Netherlands Food and Consumer Product Safety Authority. The Netherlands Food and Consumer Product Safety Authority had no role in the design, analysis or writing of this article. Conflict of interest: None. Authorship: E.H.M.T. initiated the study. E.H.M.T., H.M.E.B. and J.V.-K. were involved in data collection, development of scenarios and intake assessments. H.M.E.B. prepared the first draft of the manuscript, which was critically evaluated and refined by E.H.M.T., S.M.S., J.V.-K., A.L.D., J.M.A.v.R. and M.C.O. E.H.M.T. prepared the final draft of the manuscript. All authors participated intellectually in the development of the paper. Ethics of human subject participation: Ethical approval was not required.


